Page Summary
-
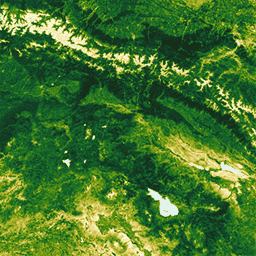
This dataset contains Landsat 7 Collection 1 Tier 1 calibrated top-of-atmosphere (TOA) reflectance data from 1999 to 2021.
-
The composites are created annually using all scenes from the year, with the greenest pixel (highest NDVI) selected as the composite value.
-
Landsat 7's orbit has been drifting to an earlier acquisition time since 2017, which is noted as important context for this data.
-
The dataset includes various spectral bands, a panchromatic band, a Quality Assessment (QA) band, and a greenness band indicating the pixel with the highest NDVI.
-
Landsat datasets are in the public domain and can be used without copyright restriction, with an acknowledgement to the USGS as the data source recommended.
- Dataset Availability
- 1999-01-01T00:00:00Z–2021-01-01T00:00:00Z
- Dataset Producer
- Tags
Description
Landsat 7 Collection 1 Tier 1 calibrated top-of-atmosphere (TOA) reflectance. Calibration coefficients are extracted from the image metadata. See Chander et al. (2009) for details on the TOA computation.
Note that Landsat 7's orbit has been drifting to an earlier acquisition time since 2017.
These composites are created from all the scenes in each annual period beginning from the first day of the year and continuing to the last day of the year. All the images from each year are included in the composite, with the greenest pixel as the composite value, where the greenest pixel means the pixel with the highest value of the Normalized Difference Vegetation Index (NDVI).
Bands
Bands
| Name | Pixel Size | Wavelength | Description | ||||||||||||||||||||||||||||||||||||||||||||||||||||||||||||||||||||||||||||||||||||||||||||||||
|---|---|---|---|---|---|---|---|---|---|---|---|---|---|---|---|---|---|---|---|---|---|---|---|---|---|---|---|---|---|---|---|---|---|---|---|---|---|---|---|---|---|---|---|---|---|---|---|---|---|---|---|---|---|---|---|---|---|---|---|---|---|---|---|---|---|---|---|---|---|---|---|---|---|---|---|---|---|---|---|---|---|---|---|---|---|---|---|---|---|---|---|---|---|---|---|---|---|---|---|
B1 |
30 meters | 0.45 - 0.52 μm | Blue |
||||||||||||||||||||||||||||||||||||||||||||||||||||||||||||||||||||||||||||||||||||||||||||||||
B2 |
30 meters | 0.52 - 0.60 μm | Green |
||||||||||||||||||||||||||||||||||||||||||||||||||||||||||||||||||||||||||||||||||||||||||||||||
B3 |
30 meters | 0.63 - 0.69 μm | Red |
||||||||||||||||||||||||||||||||||||||||||||||||||||||||||||||||||||||||||||||||||||||||||||||||
B4 |
30 meters | 0.77 - 0.90 μm | Near infrared |
||||||||||||||||||||||||||||||||||||||||||||||||||||||||||||||||||||||||||||||||||||||||||||||||
B5 |
30 meters | 1.55 - 1.75 μm | Shortwave infrared 1 |
||||||||||||||||||||||||||||||||||||||||||||||||||||||||||||||||||||||||||||||||||||||||||||||||
B6_VCID_1 |
60 meters | 10.40 - 12.50 μm | Low-gain Thermal Infrared 1. This band has expanded dynamic range and lower radiometric resolution (sensitivity), with less saturation at high Digital Number (DN) values. Resampled from 60m to 30m. |
||||||||||||||||||||||||||||||||||||||||||||||||||||||||||||||||||||||||||||||||||||||||||||||||
B6_VCID_2 |
60 meters | 10.40 - 12.50 μm | High-gain Thermal Infrared 1. This band has higher radiometric resolution (sensitivity), although it has a more restricted dynamic range. Resampled from 60m to 30m. |
||||||||||||||||||||||||||||||||||||||||||||||||||||||||||||||||||||||||||||||||||||||||||||||||
B7 |
30 meters | 2.08 - 2.35 μm | Shortwave infrared 2 |
||||||||||||||||||||||||||||||||||||||||||||||||||||||||||||||||||||||||||||||||||||||||||||||||
B8 |
15 meters | 0.52 - 0.90 μm | Panchromatic |
||||||||||||||||||||||||||||||||||||||||||||||||||||||||||||||||||||||||||||||||||||||||||||||||
BQA |
30 meters | Landsat Collection 1 QA Bitmask (See Landsat QA page) |
|||||||||||||||||||||||||||||||||||||||||||||||||||||||||||||||||||||||||||||||||||||||||||||||||
greenness |
30 meters | The pixel with the highest value of the Normalized Difference Vegetation Index (NDVI) for the year covered by the image. |
|||||||||||||||||||||||||||||||||||||||||||||||||||||||||||||||||||||||||||||||||||||||||||||||||
Terms of Use
Terms of Use
Landsat datasets are federally created data and therefore reside in the public domain and may be used, transferred, or reproduced without copyright restriction.
Acknowledgement or credit of the USGS as data source should be provided by including a line of text citation such as the example shown below.
(Product, Image, Photograph, or Dataset Name) courtesy of the U.S. Geological Survey
Example: Landsat-7 image courtesy of the U.S. Geological Survey
See the USGS Visual Identity System Guidance for further details on proper citation and acknowledgement of USGS products.