Page Summary
-
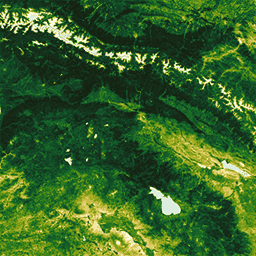
The dataset contains Landsat 8 Collection 1 Tier 1 calibrated top-of-atmosphere (TOA) reflectance data.
-
Composites are created annually from all scenes, using the greenest pixel (highest NDVI) as the composite value.
-
The dataset is available from 2013 to 2022.
-
This dataset is provided by Google and the USGS and is in the public domain with standard citation requirements.
- Dataset Availability
- 2013-01-01T00:00:00Z–2022-01-01T00:00:00Z
- Dataset Producer
- Tags
Description
Landsat 8 Collection 1 Tier 1 calibrated top-of-atmosphere (TOA) reflectance. Calibration coefficients are extracted from the image metadata. See Chander et al. (2009) for details on the TOA computation.
These composites are created from all the scenes in each annual period beginning from the first day of the year and continuing to the last day of the year. All the images from each year are included in the composite, with the greenest pixel as the composite value, where the greenest pixel means the pixel with the highest value of the Normalized Difference Vegetation Index (NDVI).
Bands
Bands
| Name | Pixel Size | Wavelength | Description | ||||||||||||||||||||||||||||||||||||||||||||||||||||||||||||||||||||||||||||||||||||||||||||||||
|---|---|---|---|---|---|---|---|---|---|---|---|---|---|---|---|---|---|---|---|---|---|---|---|---|---|---|---|---|---|---|---|---|---|---|---|---|---|---|---|---|---|---|---|---|---|---|---|---|---|---|---|---|---|---|---|---|---|---|---|---|---|---|---|---|---|---|---|---|---|---|---|---|---|---|---|---|---|---|---|---|---|---|---|---|---|---|---|---|---|---|---|---|---|---|---|---|---|---|---|
B1 |
30 meters | 0.43 - 0.45 μm | Coastal aerosol |
||||||||||||||||||||||||||||||||||||||||||||||||||||||||||||||||||||||||||||||||||||||||||||||||
B2 |
30 meters | 0.45 - 0.51 μm | Blue |
||||||||||||||||||||||||||||||||||||||||||||||||||||||||||||||||||||||||||||||||||||||||||||||||
B3 |
30 meters | 0.53 - 0.59 μm | Green |
||||||||||||||||||||||||||||||||||||||||||||||||||||||||||||||||||||||||||||||||||||||||||||||||
B4 |
30 meters | 0.64 - 0.67 μm | Red |
||||||||||||||||||||||||||||||||||||||||||||||||||||||||||||||||||||||||||||||||||||||||||||||||
B5 |
30 meters | 0.85 - 0.88 μm | Near infrared |
||||||||||||||||||||||||||||||||||||||||||||||||||||||||||||||||||||||||||||||||||||||||||||||||
B6 |
30 meters | 1.57 - 1.65 μm | Shortwave infrared 1 |
||||||||||||||||||||||||||||||||||||||||||||||||||||||||||||||||||||||||||||||||||||||||||||||||
B7 |
30 meters | 2.11 - 2.29 μm | Shortwave infrared 2 |
||||||||||||||||||||||||||||||||||||||||||||||||||||||||||||||||||||||||||||||||||||||||||||||||
B8 |
15 meters | 0.52 - 0.90 μm | Band 8 Panchromatic |
||||||||||||||||||||||||||||||||||||||||||||||||||||||||||||||||||||||||||||||||||||||||||||||||
B9 |
15 meters | 1.36 - 1.38 μm | Cirrus |
||||||||||||||||||||||||||||||||||||||||||||||||||||||||||||||||||||||||||||||||||||||||||||||||
B10 |
30 meters | 10.60 - 11.19 μm | Thermal infrared 1, resampled from 100m to 30m |
||||||||||||||||||||||||||||||||||||||||||||||||||||||||||||||||||||||||||||||||||||||||||||||||
B11 |
30 meters | 11.50 - 12.51 μm | Thermal infrared 2, resampled from 100m to 30m |
||||||||||||||||||||||||||||||||||||||||||||||||||||||||||||||||||||||||||||||||||||||||||||||||
BQA |
30 meters | Landsat Collection 1 QA Bitmask (See Landsat QA page) |
|||||||||||||||||||||||||||||||||||||||||||||||||||||||||||||||||||||||||||||||||||||||||||||||||
greenness |
30 meters | The pixel with the highest value of the Normalized Difference Vegetation Index (NDVI) for the year covered by the image. |
|||||||||||||||||||||||||||||||||||||||||||||||||||||||||||||||||||||||||||||||||||||||||||||||||
Terms of Use
Terms of Use
Landsat datasets are federally created data and therefore reside in the public domain and may be used, transferred, or reproduced without copyright restriction.
Acknowledgement or credit of the USGS as data source should be provided by including a line of text citation such as the example shown below.
(Product, Image, Photograph, or Dataset Name) courtesy of the U.S. Geological Survey
Example: Landsat-7 image courtesy of the U.S. Geological Survey
See the USGS Visual Identity System Guidance for further details on proper citation and acknowledgement of USGS products.