Page Summary
-
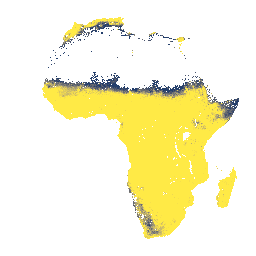
This dataset provides predicted mean and standard deviation for depth to bedrock at 0-200 cm depth for Africa.
-
The data has a pixel size of 30 meters and includes bands for both mean and standard deviation of bedrock depth.
-
Areas of exposed rock and dense jungle may have masked data or lower model accuracy, respectively.
-
The data was generated by iSDA using machine learning, remote sensing, and over 100,000 soil samples.
-
The dataset is available from 2001 to 2017 under a CC-BY-4.0 license.
- Dataset Availability
- 2001-01-01T00:00:00Z–2017-01-01T00:00:00Z
- Dataset Producer
- iSDA
- Tags
Description
Depth to bedrock at 0-200 cm depth, predicted mean and standard deviation.
Due to the potential cropland mask that was used for generating the data, many areas of exposed rock (where depth to bedrock would be 0 cm) have been masked out and therefore appear as nodata values. The maximum depth of this layer is 200 cm, but this does not represent the maximum possible soil depth, therefore values of 200 should be interpreted as >= 200.
In areas of dense jungle (generally over central Africa), model accuracy is low and therefore artifacts such as banding (striping) might be seen.
Soil property predictions were made by Innovative Solutions for Decision Agriculture Ltd. (iSDA) at 30 m pixel size using machine learning coupled with remote sensing data and a training set of over 100,000 analyzed soil samples.
Further information can be found in the FAQ and technical information documentation. To submit an issue or request support, please visit the iSDAsoil site.
Bands
Bands
Pixel size: 30 meters (all bands)
| Name | Units | Min | Max | Pixel Size | Description |
|---|---|---|---|---|---|
mean_0_200 |
cm | 27 | 200 | 30 meters | Depth to bedrock, predicted mean at 0-200 cm depth |
stdev_0_200 |
cm | 9 | 254 | 30 meters | Depth to bedrock, standard deviation at 0-20 cm depth |
Terms of Use
Terms of Use
Citations
Hengl, T., Miller, M.A.E., Križan, J., et al. African soil properties and nutrients mapped at 30 m spatial resolution using two-scale ensemble machine learning. Sci Rep 11, 6130 (2021). doi:10.1038/s41598-021-85639-y
Explore with Earth Engine
Code Editor (JavaScript)
var mean_0_200 =
'<RasterSymbolizer>' +
 '<ColorMap type="ramp">' +
  '<ColorMapEntry color="#00204D" label="0-13" opacity="1" quantity="13"/>' +
  '<ColorMapEntry color="#002D6C" label="13-26" opacity="1" quantity="26"/>' +
  '<ColorMapEntry color="#16396D" label="26-39" opacity="1" quantity="39"/>' +
  '<ColorMapEntry color="#36476B" label="39-52" opacity="1" quantity="52"/>' +
  '<ColorMapEntry color="#4B546C" label="52-65" opacity="1" quantity="65"/>' +
  '<ColorMapEntry color="#5C616E" label="65-78" opacity="1" quantity="78"/>' +
  '<ColorMapEntry color="#6C6E72" label="78-91" opacity="1" quantity="91"/>' +
  '<ColorMapEntry color="#7C7B78" label="91-104" opacity="1" quantity="104"/>' +
  '<ColorMapEntry color="#8E8A79" label="104-117" opacity="1" quantity="117"/>' +
  '<ColorMapEntry color="#A09877" label="117-130" opacity="1" quantity="130"/>' +
  '<ColorMapEntry color="#B3A772" label="130-143" opacity="1" quantity="143"/>' +
  '<ColorMapEntry color="#C6B66B" label="143-156" opacity="1" quantity="156"/>' +
  '<ColorMapEntry color="#DBC761" label="156-169" opacity="1" quantity="169"/>' +
  '<ColorMapEntry color="#F0D852" label="169-182" opacity="1" quantity="182"/>' +
  '<ColorMapEntry color="#FFEA46" label="182-200" opacity="1" quantity="195"/>' +
 '</ColorMap>' +
 '<ContrastEnhancement/>' +
'</RasterSymbolizer>';

var stdev_0_200 =
'<RasterSymbolizer>' +
 '<ColorMap type="ramp">' +
  '<ColorMapEntry color="#fde725" label="low" opacity="1" quantity="14"/>' +
  '<ColorMapEntry color="#5dc962" label=" " opacity="1" quantity="18"/>' +
  '<ColorMapEntry color="#20908d" label=" " opacity="1" quantity="21"/>' +
  '<ColorMapEntry color="#3a528b" label=" " opacity="1" quantity="22"/>' +
  '<ColorMapEntry color="#440154" label="high" opacity="1" quantity="25"/>' +
 '</ColorMap>' +
 '<ContrastEnhancement/>' +
'</RasterSymbolizer>';

var raw = ee.Image("ISDASOIL/Africa/v1/bedrock_depth");
Map.addLayer(
    raw.select(0).sldStyle(mean_0_200), {},
    "Bedrock depth, mean visualization, 0-200 cm");
Map.addLayer(
    raw.select(1).sldStyle(stdev_0_200), {},
    "Bedrock depth, stdev visualization, 0-200 cm");

var visualization = {min: 27, max: 200};

Map.setCenter(25, -3, 2);

Map.addLayer(raw.select(0), visualization, "Bedrock depth, mean, 0-200 cm");