
Store locators are an often required component of any commercial website that wants to encourage users to visit bricks and mortar stores. In this codelab you'll build a website that serves location data, and scales automatically, thanks to the power of Google App Engine. We show you how to expose an easily navigable visualization of the NYC subway using Google Maps JavaScript API.
What you'll build
In this codelab, you'll build a visualization for the NYC Subway Station dataset that is:
|
|
What you'll learn
- How to use Google Cloud services like Google Cloud Shell and Google App Engine
- How to serve GIS data on the web in an effortlessly scalable fashion
- How to style a Google map in your app
What you'll need
- Basic knowledge of HTML, CSS, JavaScript, Go, and Chrome DevTools
- An ES6 capable web browser, such as recent versions of Chrome, Firefox, Safari, or Edge.
This codelab focuses on the Google Maps JavaScript API. Non-relevant concepts and code blocks are glossed over and are provided for you to simply copy and paste.
Environment setup
If you don't already have a Google Account (Gmail or Google Apps), you must create one.
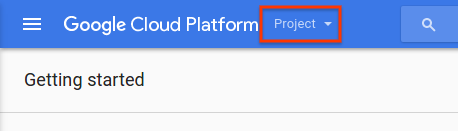
Sign in to Google Cloud Platform console (console.cloud.google.com) and create a new project. At the top of your screen, there is a Project drop down menu:
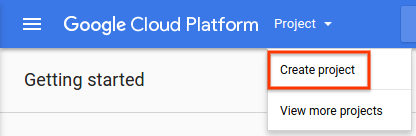
Once you click on this project drop down menu, you will get a menu item that allows you to create a new project:
Select a name for your project on the resulting form:
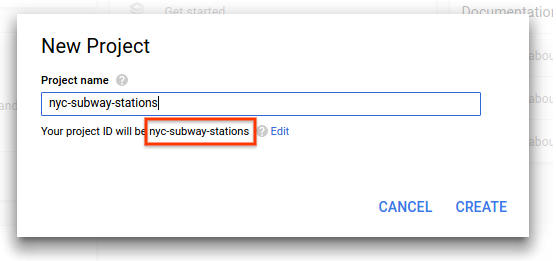
Remember your Project ID, as you'll use it later. The project ID is a unique name across all Google Cloud projects. The name above has already been taken and will not work for you. Insert your own project ID wherever you see YOUR_PROJECT_ID in this codelab.
Google Cloud Shell
While Google Cloud can be operated remotely from your laptop, in this codelab you'll use Cloud Shell, a command line environment running in the Cloud. Cloud Shell provides an automatically provisioned Linux virtual machine which is loaded with all the development tools you need (gcloud, go, and more). It offers a persistent 5GB home directory, and runs on the Google Cloud, greatly enhancing network performance and authentication.
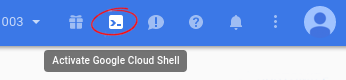
To activate Cloud Shell, from the Cloud platform console click the button on the top right-hand side (it should only take a few moments to provision and connect to the environment):
Clicking on the above button will open a new shell in the lower part of your browser, after possibly showing an introductory interstitial:
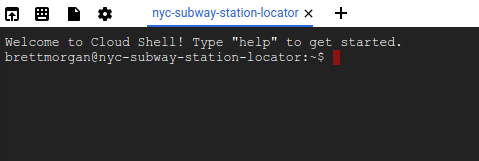
Once connected to the Cloud Shell, you should see that you are already authenticated and that the project is already set to your YOUR_PROJECT_ID:
gcloud auth list
gcloud config list project
If for some reason the project is not set, run the following command:
gcloud config set project <YOUR_PROJECT_ID>
Starting developing with Hello World
In your Cloud Shell instance, you'll start by creating a Go App Engine app that will serve as the basis for the rest of the codelab.
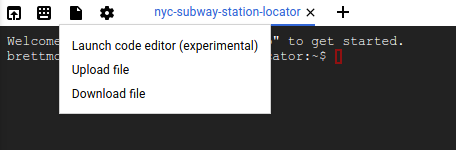
In the toolbar of the Cloud Shell, click on the file icon to open a menu, and then select Launch code editor to open a code editor in a new tab. This web based code editor allows you to easily edit files in the Cloud Shell instance.
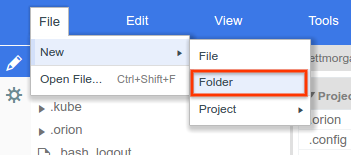
Create a new nyc-subway directory for your application in the code editor, by opening the File menu, and selecting New > Folder.
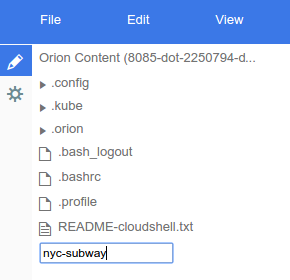
Name the new folder nyc-subway:
Next you'll create a small Go App Engine app to make sure everything's working. Hello World!
Create a file in the nyc-subway directory named app.yaml. Put the following content in the app.yaml file:
app.yaml
runtime: go
api_version: go1

handlers:
- url: /.*
  script: _go_app
This configuration file configures your App Engine app to use the Go standard runtime. For background information on the meaning of the configuration items in this file, see the Google App Engine Go Standard Environment Documentation.
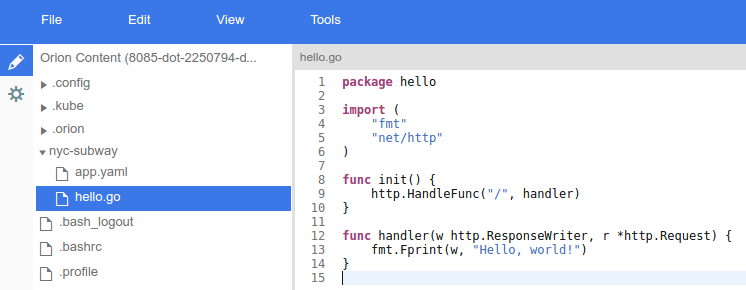
Next, create a hello.go file alongside the app.yaml file:
hello.go
package hello

import (
    "fmt"
    "net/http"
)

func init() {
    http.HandleFunc("/", handler)
}

func handler(w http.ResponseWriter, r *http.Request) {
        // Writes Hello, World! to the user's web browser via `w`
        fmt.Fprint(w, "Hello, world!")
}
It is worth pausing a moment here to understand what this code does, at least at a high level. You have defined a package hello that registers a handler function for HTTP requests matching the path "/" in the init function, which is called by the Go App Engine runtime at startup.
The handler function, handily called handler, simply writes out the text string "Hello, world!". This text will be relayed back to your browser, where you'll be able to read it. In future steps you'll make handlers that respond with GeoJSON data instead of simple hard coded strings.
After carrying out these steps, you should now have an editor that looks like this:
To test this application, you can run the App Engine development server inside the Cloud Shell instance. Go back to the Cloud Shell command line, and type the following:
cd nyc-subway && goapp serve
You will see some lines of log output showing you that you are indeed running the development server on the Cloud Shell instance, with the hello world web app listening on localhost port 8080. You can open a web browser tab on this app by selecting the Preview on port 8080 menu item from the Cloud Shell toolbar.
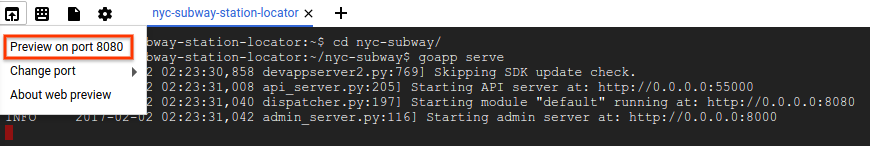
Clicking on this menu item will open a new tab in your web browser with the content of the HTML served from the App Engine development server. In the next step you'll add the NYC Subway data to this app, and start visualizing it.
GeoJSON, the lingua franca of the GIS world
The previous step mentioned that you'll make handlers in your Go code that render GeoJSON data to the web browser. But what is GeoJSON?
In the Geographic Information System (GIS) world, we need to be able to communicate knowledge about geographic entities between computer systems. Maps are great for humans to read, but computers typically prefer their data in more easily digested formats.
GeoJSON is a format for encoding geographic data structures, like the Subway Stations in NYC. GeoJSON has been standardized in an Internet Engineering Task Force standard called RFC7946. GeoJSON is defined in terms of JSON, JavaScript Object Notation, which itself was standardised in ECMA-404, by the same organization that standardized JavaScript, Ecma International.
The important thing is that GeoJSON is a widely supported wire format for communicating geographic knowledge. This codelab uses GeoJSON in the following ways:
- Use Go packages to parse the NYC data into an internal GIS specific data structure that you'll use to filter requested data.
- Serialize the requested data for transit between the web server and web browser.
- Use a JavaScript library to convert the response into markers and polylines on a map.
This will save you a significant amount of typing in code, because you don't need to write parsers and generators to convert the on-the-wire datastream into in-memory representations.
Reviewing the data
NYC Open Data makes the wealth of public data generated by various New York City agencies and other City organizations available for public use. In this codelab, you'll visualize the Subway Station and Subway Line data sets.
You'll visualize the data with markers on the map, rendered using Google Maps JavaScript API's Data layer.
Start by downloading the GeoJSON data from the NYC Open Data website into your app. In your Cloud Shell instance's command line window, shut down the server by typing [CTRL] + [C]. Then make a data directory inside the nyc-subway directory, cd to that directory:
mkdir data && cd data
Now use curl to retrieve subway stations:
curl "https://data.cityofnewyork.us/api/geospatial/arq3-7z49?method=export&format=GeoJSON" -o subway-stations.geojson
And again, for the subway lines:
curl "https://data.cityofnewyork.us/api/geospatial/3qz8-muuu?method=export&format=GeoJSON" -o subway-lines.geojson
Finally, pop back out of the data directory:
cd ..
Next, update the app.yaml file to reflect a more complex App Engine application.
app.yaml
runtime: go
api_version: go1

handlers:
- url: /
  static_files: static/index.html
  upload: static/index.html
- url: /(.*\.(js|html|css))$
  static_files: static/\1
  upload: static/.*\.(js|html|css)$
- url: /.*
  script: _go_app
This app.yaml configuration directs requests for /, /*.js, /*.css and /*.html to a set of static files. This means that the static HTML component of your app will be served directly by App Engine file serving infrastructure, and not your Go app. This reduces server load, and increases serving speed.
Now, back in the text editor, create a directory called static under the main directory of the app (this means creating the directory nyc-subway/static), and add the following three files into this new directory.
index.html
<html>
  <head>
    <title>NYC Subway Stations</title>
    <link rel="stylesheet" type="text/css" href="style.css">
  </head>
  <body>
    <div id="map" class="map"></div>

    <script src="app.js"></script>
    <!-- TODO: Replace YOUR_API_KEY in the following line -->
    <script async defer src="https://maps.googleapis.com/maps/api/js?key=YOUR_API_KEY&callback=initMap">
    </script>
  </body>
</html>
The index.html is the file initially served when the browser requests the root of the web application. This file sets up a <div> to contain the map, loads some CSS to style the map, pulls in a JavaScript file that will configure the map, and finally loads the Google Maps JavaScript API.
There is one quick diversion you need to make here, to replace the YOUR_API_KEY in the above HTML source with an actual Google Maps API key. Follow these steps to get an API key:
- Go to the Google API Console. (Use this link, because it has some smarts to enable the correct APIs for you.)
- Select the project you created earlier in this code lab.
- Click Continue to enable the API and any related services.
- On the Credentials page, get an API key by clicking on ‘Public data‘ and then clicking ‘Next‘. Don't worry about adding restrictions to this API key for the purposes of this codelab.
- Copy the API key and put in the above HTML file. You'll also need this API key in the next step of this tutorial.
The script resource will now look similar to this once you replace YOUR_API_KEY :
<script async defer
    src="https://maps.googleapis.com/maps/api/js?key=AIza12345678ABC_DEFGHIJ&callback=initMap">
style.css
.map {
    height: 100%;
}

html, body {
    height: 100%;
    margin: 0;
    padding: 0;
}
Create a new file static/style.css. This is a CSS style file that makes the map take up the whole page, without any margin or padding.
app.js
// Eslint configuration for editor.
/* globals google */
/* eslint-env browser */
/* eslint quotes: ["warn", "single"]*/

function initMap() {
  const map = new google.maps.Map(document.querySelector('#map'), {
    zoom: 11,
    center: {
      // New York City
      lat: 40.7305,
      lng: -73.9091
    }
  });
  map.data.loadGeoJson('/data/subway-stations');
  map.data.loadGeoJson('/data/subway-lines');
}
Create a new file static/app.js. This is a JavaScript file that configures your map to be centered on New York City, at zoom level 11. It then loads both the Subway Stations and Subway Lines GeoJSON data that you retrieved earlier in this step.
The eagle eyed amongst you may have noticed a disconnect - you have the GeoJSON data inside your application folder, but it isn't exposed in the app.yaml file. You're going to serve the GeoJSON data from the Go app, so you can do some smart things with the data in future steps.
Next is to update the Go source code. Rename the hello.go file from the previous step to nycsubway.go to better reflect what you're doing in this app. (Menu: Edit -> rename)
nycsubway.go
package nycsubway

import (
        "io/ioutil"
        "log"
        "net/http"
        "path/filepath"
)

// GeoJSON is a cache of the NYC Subway Station and Line data.
var GeoJSON = make(map[string][]byte)

// cacheGeoJSON loads files under data into `GeoJSON`.
func cacheGeoJSON() {
        filenames, err := filepath.Glob("data/*")
        if err != nil {
                log.Fatal(err)
        }
        for _, f := range filenames {
                name := filepath.Base(f)
                dat, err := ioutil.ReadFile(f)
                if err != nil {
                        log.Fatal(err)
                }
                GeoJSON[name] = dat
        }
}

// init is called from the App Engine runtime to initialize the app.
func init() {
        cacheGeoJSON()
        http.HandleFunc("/data/subway-stations", subwayStationsHandler)
        http.HandleFunc("/data/subway-lines", subwayLinesHandler)
}

func subwayStationsHandler(w http.ResponseWriter, r *http.Request) {
        w.Header().Set("Content-type", "application/json")
        w.Write(GeoJSON["subway-stations.geojson"])
}

func subwayLinesHandler(w http.ResponseWriter, r *http.Request) {
        w.Header().Set("Content-type", "application/json")
        w.Write(GeoJSON["subway-lines.geojson"])
}
This code does a couple of things. On startup it loads all the files under data/ into memory, then it configures itself to serve requests for files under /data/. This is the missing link mentioned previously. In future steps you'll do more intelligent things with the GeoJSON data than just serving it wholesale.
Now you're ready to re-run the web application locally. It's also a good idea to use the go fmt command on a regular basis, to correct any formatting mistakes that crept into your code. Change to your nyc-subway directory, then run the following:
go fmt nycsubway.go && goapp serve
Open up the web preview again, and you should see a view like the following.
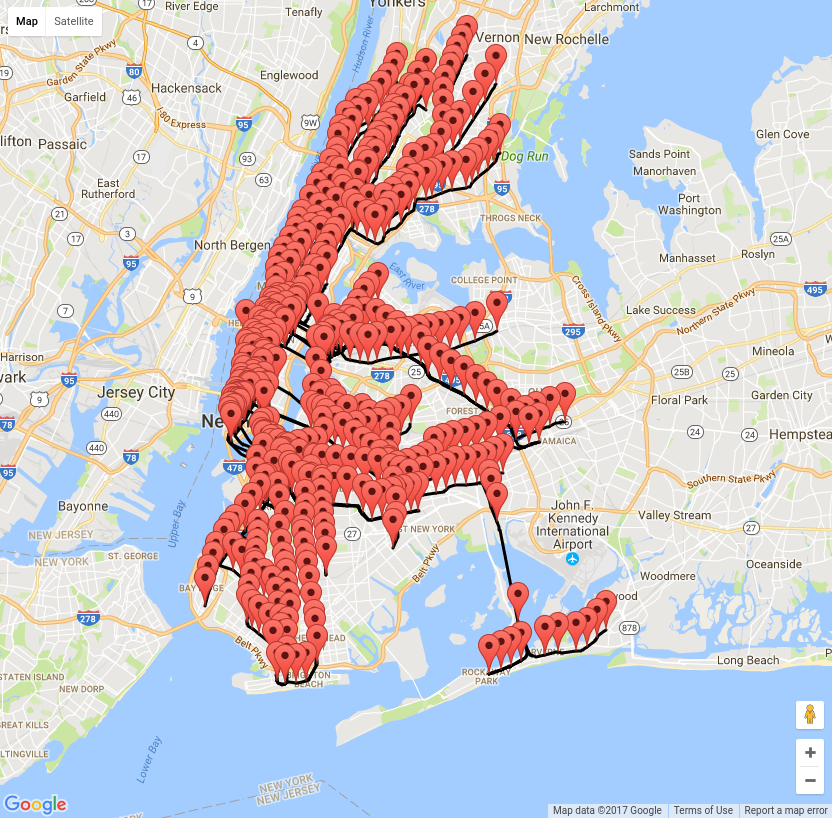
So what have you accomplished this far? You have a Go server serving content to a browser that contains all of the subway stations in NYC, along with the train lines. But it doesn't really look like a map of a subway, does it?
In the next step we will re-style this map to make it look like a subway map.
One of the most important requirements of a map is that it communicates effectively. It would be good if the subway lines don't compete with all the information on the base map tiles. In this step you'll use a map style to hide a lot of information on the map, and drop the colors to shades of gray. Then you'll add JavaScript code to style the subway lines based on the New York City Subway nomenclature.
Styling the map
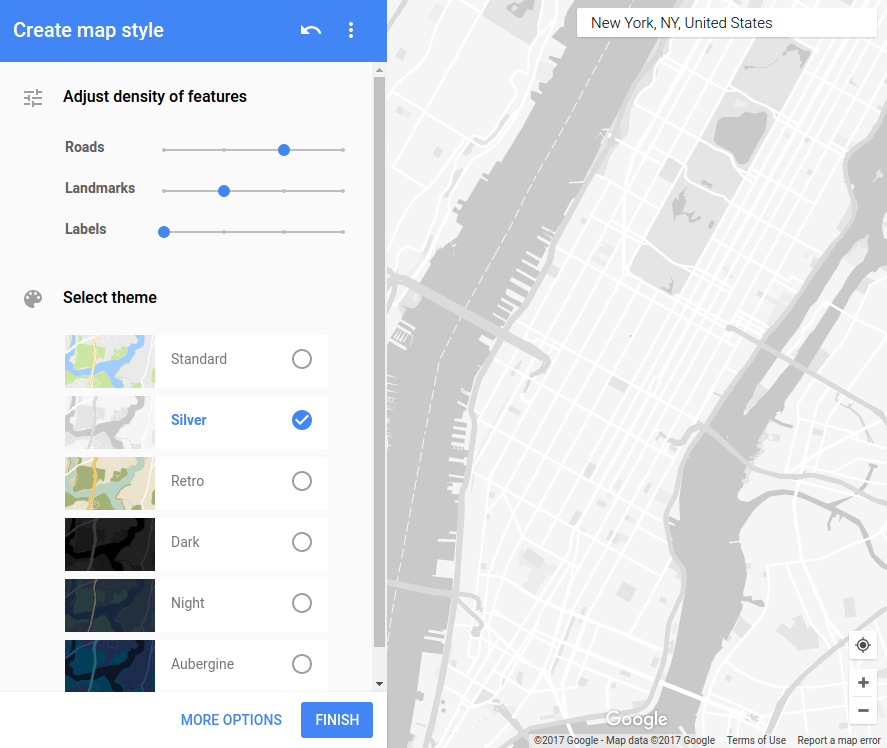
Open mapstyle.withgoogle.com and click the Create a Style button.
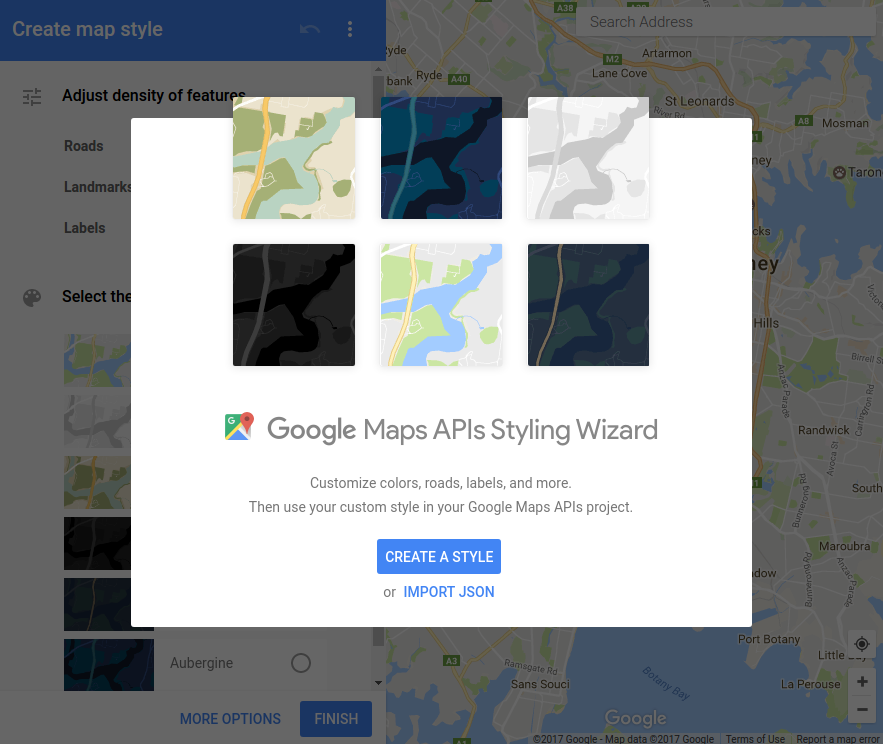
This puts you in a screen with a collection of map style attributes on the left, and an unstyled map on the right. The screenshot below shows a style that turns down the density of Landmarks and Labels, and uses the Silver theme to drop the amount of color on the base map. Please try different themes, or select the More Options button at the bottom of the screen and explore all the available styling capabilities.
When you are ready, click the Finish button.
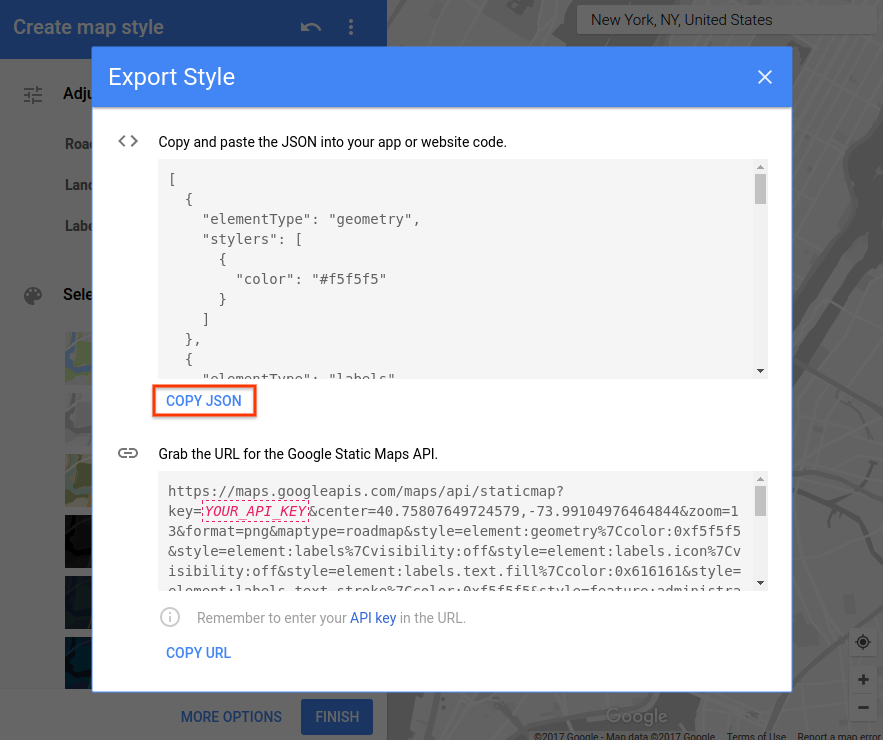
Next, extract the JSON description of the map style you have configured, so you can put the styling JSON into your code in the next step. Click the Copy JSON button.
Now, go back to the app.js file you created in the previous step. We are going to add a bunch of code to apply the map style you just designed to the map, along with some code to style the stations and the lines.
app.js
// Eslint configuration for editor.
/* globals google */
/* eslint-env browser */
/* eslint quotes: ["warn", "single"]*/

// Replace the following with the JSON from the Styling Wizard
const mapStyle = [
  {
    elementType: 'geometry',
    stylers: [
      {
        color: '#eceff1'
      }
    ]
  },
  {
    elementType: 'labels',
    stylers: [
      {
        visibility: 'off'
      }
    ]
  },
  {
    featureType: 'administrative',
    elementType: 'labels',
    stylers: [
      {
        visibility: 'off'
      }
    ]
  },
  {
    featureType: 'road',
    elementType: 'geometry',
    stylers: [
      {
        color: '#cfd8dc'
      }
    ]
  },
  {
    featureType: 'road',
    elementType: 'geometry.stroke',
    stylers: [
      {
        visibility: 'off'
      }
    ]
  },
  {
    featureType: 'road.local',
    stylers: [
      {
        visibility: 'off'
      }
    ]
  },
  {
    featureType: 'water',
    stylers: [
      {
        color: '#b0bec5'
      }
    ]
  }
];

// Colors from https://en.wikipedia.org/wiki/New_York_City_Subway_nomenclature#Colors_and_trunk_lines
const routeColors = {
  // IND Eighth Avenue Line
  A: '#2850ad',
  C: '#2850ad',
  E: '#2850ad',

  // IND Sixth Avenue Line
  B: '#ff6319',
  D: '#ff6319',
  F: '#ff6319',
  M: '#ff6319',

  // IND Crosstown Line
  G: '#6cbe45',

  // BMT Canarsie Line
  L: '#a7a9ac',

  // BMT Nassau Street Line
  J: '#996633',
  Z: '#996633',

  // BMT Broadway Line
  N: '#fccc0a',
  Q: '#fccc0a',
  R: '#fccc0a',
  W: '#fccc0a',

  // IRT Broadway – Seventh Avenue Line
  '1': '#ee352e',
  '2': '#ee352e',
  '3': '#ee352e',

  // IRT Lexington Avenue Line
  '4': '#00933c',
  '5': '#00933c',
  '6': '#00933c',

  // IRT Flushing Line
  '7': '#b933ad',

  // Shuttles
  S: '#808183'
};

// initMap is called from the Google Maps JS library after the library has initialised itself.
function initMap() {
  const map = new google.maps.Map(document.querySelector('#map'), {
    zoom: 12,
    center: {
      // New York City
      lat: 40.7305,
      lng: -73.9091
    },
    styles: mapStyle
  });
  const infowindow = new google.maps.InfoWindow();

  // Load GeoJSON data from the back end
  map.data.loadGeoJson('/data/subway-stations');
  map.data.loadGeoJson('/data/subway-lines');

  // Style the GeoJSON features (stations & lines)
  map.data.setStyle(feature => {
    const line = feature.getProperty('line');
    // Stations have line property, while lines do not.
    if (line) {
      // Icon path from: https://material.io/icons/#ic_train
      return {
        icon: {
          fillColor: '#00b0ff',
          strokeColor: '#3c8cb8',
          fillOpacity: 1.0,
          scale: 1.2,
          path: 'M12 2c-4 0-8 .5-8 4v9.5C4 17.43 5.57 19 7.5 19L6 20.5v.5h2.2' +
            '3l2-2H14l2 2h2v-.5L16.5 19c1.93 0 3.5-1.57 3.5-3.5V6c0-3.5-3.58-' +
            '4-8-4zM7.5 17c-.83 0-1.5-.67-1.5-1.5S6.67 14 7.5 14s1.5.67 1.5 1' +
            '.5S8.33 17 7.5 17zm3.5-7H6V6h5v4zm2 0V6h5v4h-5zm3.5 7c-.83 0-1.5' +
            '-.67-1.5-1.5s.67-1.5 1.5-1.5 1.5.67 1.5 1.5-.67 1.5-1.5 1.5z'
        }
      };
    }

    // if type is not a station, it's a subway line
    const routeSymbol = feature.getProperty('rt_symbol');

    return {
      strokeColor: routeColors[routeSymbol]
    };
  });

  map.data.addListener('click', ev => {
    const f = ev.feature;
    const stationName = f.getProperty('name');
    let line = f.getProperty('line');
    // Stations have line property, while lines do not.
    if (!line) {
      return;
    }
    if (line.includes('-')) {
      line += ' lines';
    } else {
      line += ' line';
    }
    infowindow.setContent(`<b>${stationName} Station</b><br/>Serves ${line}`);
    // Hat tip geocodezip: http://stackoverflow.com/questions/23814197
    infowindow.setPosition(f.getGeometry().get());
    infowindow.setOptions({
      pixelOffset: new google.maps.Size(0, -30)
    });
    infowindow.open(map);
  });
}
We have added a lot of code here. Let's have a look through and see what we have here.
The first constant we define is mapStyle. You should replace this block with the JSON content you built with mapstyle.withgoogle.com. This changes the style of the basemap tiles. The style we have in the above snippet is specifically designed to drop the map to the background of the user's attention, and allow the subway lines and stations to dominate.
The next constant we define is a hashmap named routeColors. This constant is used further down in the code to style the subway lines depending on the NYC Subway Nomenclature. Then we have the initMap function that the Google Maps JavaScript API calls to initialize the content of the map.
The first half dozen lines of this function should be familiar from the previous step. We initialize the map, and load the GeoJSON for both the stations and the lines. There are two additions here, the first is the addition of the styles attribute to the Google Maps constructor to link in the mapStyle, and the second is a constant definition for an InfoWindow.
An InfoWindow is a pop up window we display when someone clicks on a subway station. We use it in the click listener that we add to the Data layer. We have a block of javascript that is responsible for constructing a useful text description of the station a user click on, and opening the InfoWindow.
The last piece of new code is the style for the content of the Google Maps Data layer. This inline function is called by the Google Maps Data layer for each item in the data layer. It returns a javascript object that defines how it should be styled on screen. Please see Styling GeoJSON Data for information on how to use this capability.
If you now preview your app again in your web browser, you should see something like this:
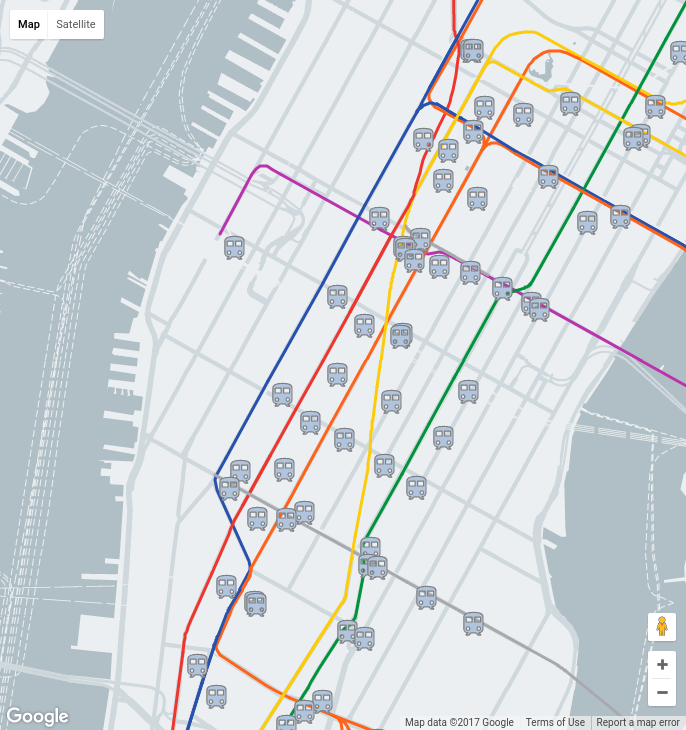
Please take a minute or five to play with this code, changing the style of the basemap as well as the train station icons. The best thing to do with code you don't understand is to break it and figure out how you broke it! In the next step we will look into reducing the amount of GeoJSON data the browser has to both download and parse.
In this step you'll add code to the Go back-end that will narrow the returned stations to just the visible area of the map. The upside of filtering is that we reduce the size of the data set sent to the user's browser, making our site more performant.
There's an API endpoint that the front end uses to get the stations, but currently the client does not supply the visible area that the user is viewing. So, first add the visible map area to the requested URL as parameters. We do this by delaying loading of the GeoJSON for subway stations until an idle callback fires. This means we have access to the map viewport.
app.js
// Eslint configuration for editor.
/* globals google */
/* eslint-env browser */
/* eslint quotes: ["warn", "single"]*/

// Map Style for the basemap tiles.
const mapStyle = [
  {
    elementType: 'geometry',
    stylers: [
      {
        color: '#eceff1'
      }
    ]
  },
  {
    elementType: 'labels',
    stylers: [
      {
        visibility: 'off'
      }
    ]
  },
  {
    featureType: 'administrative',
    elementType: 'labels',
    stylers: [
      {
        visibility: 'off'
      }
    ]
  },
  {
    featureType: 'road',
    elementType: 'geometry',
    stylers: [
      {
        color: '#cfd8dc'
      }
    ]
  },
  {
    featureType: 'road',
    elementType: 'geometry.stroke',
    stylers: [
      {
        visibility: 'off'
      }
    ]
  },
  {
    featureType: 'road.local',
    stylers: [
      {
        visibility: 'off'
      }
    ]
  },
  {
    featureType: 'water',
    stylers: [
      {
        color: '#b0bec5'
      }
    ]
  }
];

// Colors from https://en.wikipedia.org/wiki/New_York_City_Subway_nomenclature#Colors_and_trunk_lines
const routeColors = {
  // IND Eighth Avenue Line
  A: '#2850ad',
  C: '#2850ad',
  E: '#2850ad',

  // IND Sixth Avenue Line
  B: '#ff6319',
  D: '#ff6319',
  F: '#ff6319',
  M: '#ff6319',

  // IND Crosstown Line
  G: '#6cbe45',

  // BMT Canarsie Line
  L: '#a7a9ac',

  // BMT Nassau Street Line
  J: '#996633',
  Z: '#996633',

  // BMT Broadway Line
  N: '#fccc0a',
  Q: '#fccc0a',
  R: '#fccc0a',
  W: '#fccc0a',

  // IRT Broadway – Seventh Avenue Line
  '1': '#ee352e',
  '2': '#ee352e',
  '3': '#ee352e',

  // IRT Lexington Avenue Line
  '4': '#00933c',
  '5': '#00933c',
  '6': '#00933c',

  // IRT Flushing Line
  '7': '#b933ad',

  // Shuttles
  S: '#808183'
};

// initMap is called from the Google Maps JS library after the library has initialised itself.
function initMap() {
  const map = new google.maps.Map(document.querySelector('#map'), {
    zoom: 12,
    center: {
      // New York City
      lat: 40.7305,
      lng: -73.9091
    },
    styles: mapStyle
  });
  const infowindow = new google.maps.InfoWindow();
  let stationDataFeatures = [];

  // Load GeoJSON for subway lines. Stations are loaded in the idle callback.
  map.data.loadGeoJson('/data/subway-lines');

  // Style the GeoJSON features (stations & lines)
  map.data.setStyle(feature => {
    const line = feature.getProperty('line');
    // Stations have line property, while lines do not.
    if (line) {
      // Icon path from: https://material.io/icons/#ic_train
      return {
        icon: {
          fillColor: '#00b0ff',
          strokeColor: '#3c8cb8',
          fillOpacity: 1.0,
          scale: 1.2,
          path: 'M12 2c-4 0-8 .5-8 4v9.5C4 17.43 5.57 19 7.5 19L6 20.5v.5h2.2' +
            '3l2-2H14l2 2h2v-.5L16.5 19c1.93 0 3.5-1.57 3.5-3.5V6c0-3.5-3.58-' +
            '4-8-4zM7.5 17c-.83 0-1.5-.67-1.5-1.5S6.67 14 7.5 14s1.5.67 1.5 1' +
            '.5S8.33 17 7.5 17zm3.5-7H6V6h5v4zm2 0V6h5v4h-5zm3.5 7c-.83 0-1.5' +
            '-.67-1.5-1.5s.67-1.5 1.5-1.5 1.5.67 1.5 1.5-.67 1.5-1.5 1.5z'
        }
      };
    }

    // if type is not a station, it's a subway line
    const routeSymbol = feature.getProperty('rt_symbol');
    return {
      strokeColor: routeColors[routeSymbol]
    };
  });

  map.data.addListener('click', ev => {
    const f = ev.feature;
    const stationName = f.getProperty('name');
    let line = f.getProperty('line');
    // Stations have line property, while lines do not.
    if (!line) {
      return;
    }
    if (line.includes('-')) {
      line += ' lines';
    } else {
      line += ' line';
    }
    infowindow.setContent(`<b>${stationName} Station</b><br/>Serves ${line}`);
    // Hat tip geocodezip: http://stackoverflow.com/questions/23814197
    infowindow.setPosition(f.getGeometry().get());
    infowindow.setOptions({
      pixelOffset: new google.maps.Size(0, -30)
    });
    infowindow.open(map);
  });

  // The idle callback is called every time the map has finished
  // moving, zooming,  panning or animating. We use it to load
  // Geojson for the new viewport.
  google.maps.event.addListener(map, 'idle', () => {
    const sw = map.getBounds().getSouthWest();
    const ne = map.getBounds().getNorthEast();
    map.data.loadGeoJson(
      `/data/subway-stations?viewport=${sw.lat()},${sw.lng()}|${ne.lat()},${ne.lng()}`,
      null,
      features => {
        stationDataFeatures.forEach(dataFeature => {
          map.data.remove(dataFeature);
        });
        stationDataFeatures = features;
      }
    );
  });
}
This updated app.js introduces a couple of ES6 features to make the JavaScript easier to read. This will work fine in almost all current web browsers. You will need to transpile this JavaScript to ES5 before using this in a production web site, but for our purposes in this tutorial, ES6 is fine. We use ES6 style Template literals and Fat Arrow syntax to cut down on boilerplate code.
This code contains a couple of additions over the previous step. We have an idle callback that asks the map for viewport bounds, and adds these to the URL used to request subway station GeoJSON data. We will update the backend to utilise these parameters shortly. We have added state to allow us to drop station features once we have loaded the new stations.
Now we need to add the ability to filter the stations returned based on the viewport reported from the front end. We need to install a couple of Go packages for your server. Shut down the server with a [CTRL] + [c] in the Cloud Shell command line, then type the following commands:
go get github.com/paulmach/go.geojson
And:
go get github.com/dhconnelly/rtreego
These packages provide the following capabilities:
- Parse GeoJSON with github.com/paulmach/go.geojson
- Run viewbox bounded queries efficiently with github.com/dhconnelly/rtreego
Next, create a new go file responsible for parsing the content from the subway-stations.geojson file, storing the resultant stations in an R-tree data structure, and responding to the /subway-stations request. In the editor, create a new file alongside the nycsubway.go file named stations.go.
stations.go
package nycsubway

import (
        "encoding/json"
        "fmt"
        "log"
        "math"
        "net/http"
        "strconv"
        "strings"

        rtree "github.com/dhconnelly/rtreego"
        geojson "github.com/paulmach/go.geojson"
)

// Stations is an RTree housing the stations
var Stations = rtree.NewTree(2, 25, 50)

// Station is a wrapper for `*geojson.Feature` so that we can implement
// `rtree.Spatial` interface type.
type Station struct {
        feature *geojson.Feature
}

// Bounds implements `rtree.Spatial` so we can load
// stations into an `rtree.Rtree`.
func (s *Station) Bounds() *rtree.Rect {
        return rtree.Point{
                s.feature.Geometry.Point[0],
                s.feature.Geometry.Point[1],
        }.ToRect(1e-6)
}

// loadStations loads the geojson features from
// `subway-stations.geojson` into the `Stations` rtree.
func loadStations() {
        stationsGeojson := GeoJSON["subway-stations.geojson"]
        fc, err := geojson.UnmarshalFeatureCollection(stationsGeojson)
        if err != nil {
                // Note: this will take down the GAE instance by exiting this process.
                log.Fatal(err)
        }
        for _, f := range fc.Features {
                Stations.Insert(&Station{f})
        }
}

// subwayStationsHandler reads r for a "viewport" query parameter
// and writes a GeoJSON response of the features contained in
// that viewport into w.
func subwayStationsHandler(w http.ResponseWriter, r *http.Request) {
        w.Header().Set("Content-type", "application/json")
        vp := r.FormValue("viewport")
        rect, err := newRect(vp)
        if err != nil {
                str := fmt.Sprintf("Couldn't parse viewport: %s", err)
                http.Error(w, str, 400)
                return
        }
        s := Stations.SearchIntersect(rect)
        fc := geojson.NewFeatureCollection()
        for _, station := range s {
                fc.AddFeature(station.(*Station).feature)
        }
        err = json.NewEncoder(w).Encode(fc)
        if err != nil {
                str := fmt.Sprintf("Couldn't encode results: %s", err)
                http.Error(w, str, 500)
                return
        }
}

// newRect constructs a `*rtree.Rect` for a viewport.
func newRect(vp string) (*rtree.Rect, error) {
        ss := strings.Split(vp, "|")
        sw := strings.Split(ss[0], ",")
        swLat, err := strconv.ParseFloat(sw[0], 64)
        if err != nil {
                return nil, err
        }
        swLng, err := strconv.ParseFloat(sw[1], 64)
        if err != nil {
                return nil, err
        }
        ne := strings.Split(ss[1], ",")
        neLat, err := strconv.ParseFloat(ne[0], 64)
        if err != nil {
                return nil, err
        }
        neLng, err := strconv.ParseFloat(ne[1], 64)
        if err != nil {
                return nil, err
        }
        minLat := math.Min(swLat, neLat)
        minLng := math.Min(swLng, neLng)
        distLat := math.Max(swLat, neLat) - minLat
        distLng := math.Max(swLng, neLng) - minLng

        r, err := rtree.NewRect(
                rtree.Point{
                        minLng,
                        minLat,
                },
                []float64{
                        distLng,
                        distLat,
                })
        if err != nil {
                return nil, err
        }
        return r, nil
}
There is a fair amount going on in this file, so let's go through it in logical units. The package line and the import stanza place this file in the same package as declared in nycsubway.go, and import the required dependencies.
The stations variable declares an R-tree where you'll store all the stations for the NYC subway. An R-tree data structure is specifically designed for geographic queries like "Show me all the points within a specified bounding box." This is useful for finding stations within a viewport.
Next we define a Station structure. This is a way of being able to import the parsed GeoJSON data into the Stations R-tree. We wrap the *geojson.Feature and implement Bounds() as a function on *Station. This way, Station implements the rtree.Spatial interface, as required by rtree.Insert.
Then we define a loadStations() function, which is called when this module is initialized, which you'll see when you update nycsubway.go below. Finally, we define subwayStationsHandler() function, along with its newRect(string) helper function. While newRect looks long, it is merely converting the viewport parameter that we constructed above in app.js into a search query that the Stations R-tree can understand.
The subwayStationsHandler will be invoked when the front end makes a request to the /data/subway-stations endpoint. At the core, this function retrieves the viewport parameter, converts that to a search query using the previously mentioned newRect helper function, executes a query over the Stations R-tree, and converts the returned stations into JSON, which is then written out to the browser.
Make a few small changes to the nycsubway.go file, because the subwayStationsHandler function has moved to stations.go, and you need to add a call to loadStations() in the init() function.
nycsubway.go
package nycsubway

import (
        "io/ioutil"
        "log"
        "net/http"
        "path/filepath"
)

// GeoJSON is a cache of the NYC Subway Station and Line data.
var GeoJSON = make(map[string][]byte)

// cacheGeoJSON loads files under data into `GeoJSON`.
func cacheGeoJSON() {
        filenames, err := filepath.Glob("data/*")
        if err != nil {
                // Note: this will take down the GAE instance by exiting this process.
                log.Fatal(err)
        }
        for _, f := range filenames {
                name := filepath.Base(f)
                dat, err := ioutil.ReadFile(f)
                if err != nil {
                        log.Fatal(err)
                }
                GeoJSON[name] = dat
        }
}

// init is called from the App Engine runtime to initialize the app.
func init() {
        cacheGeoJSON()
        loadStations()
        http.HandleFunc("/data/subway-stations", subwayStationsHandler)
        http.HandleFunc("/data/subway-lines", subwayLinesHandler)
}

func subwayLinesHandler(w http.ResponseWriter, r *http.Request) {
        w.Header().Set("Content-type", "application/json")
        w.Write(GeoJSON["subway-lines.geojson"])
}
You should now be able to view the updated content in your web browser, after you restart the server.
go fmt *.go && goapp serve
As you zoom in and out, or pan the map, you'll notice that stations disappear and reappear in odd ways near the edge of the viewport. This is because in this version you've tightly cropped the returned stations to the current browser viewport. You can work around this by expanding the viewport used to query the Stations R-tree. We can also look at reducing the number of stations that are displayed when the map is first displayed, by clustering stations. This is the focus of the next step!
In this step you'll cluster the approximately four hundred stations in the NYC subway so that the user of the map isn't overwhelmed with stations when viewing the map. This requires changes to both the front end and the back end code. The front end change is required because points are no longer just stations. Each point can be either a station, or a cluster of stations. On the back end, you need to add code that groups the stations into clusters, and generates useful information for the info windows (pop ups) in a way that works for both clusters and individual stations.
In the app.js file, you need to make three major changes:
- Add the map's current zoom level to the
/data/subway-stationsAJAX request, for use by the clusterer implementation. - Add dynamic styling for the markers that will visually differentiate between subway stations and clusters of stations.
- Simplify the click handler's info window construction code, because the GeoJSON returned by the back-end is now responsible for populating content for the title and description.
app.js
// Eslint configuration for editor.
/* globals google */
/* eslint-env browser */
/* eslint quotes: ["warn", "single"]*/

// Map Style for the basemap tiles.
const mapStyle = [
  {
    elementType: 'geometry',
    stylers: [
      {
        color: '#eceff1'
      }
    ]
  },
  {
    elementType: 'labels',
    stylers: [
      {
        visibility: 'off'
      }
    ]
  },
  {
    featureType: 'administrative',
    elementType: 'labels',
    stylers: [
      {
        visibility: 'off'
      }
    ]
  },
  {
    featureType: 'road',
    elementType: 'geometry',
    stylers: [
      {
        color: '#cfd8dc'
      }
    ]
  },
  {
    featureType: 'road',
    elementType: 'geometry.stroke',
    stylers: [
      {
        visibility: 'off'
      }
    ]
  },
  {
    featureType: 'road.local',
    stylers: [
      {
        visibility: 'off'
      }
    ]
  },
  {
    featureType: 'water',
    stylers: [
      {
        color: '#b0bec5'
      }
    ]
  }
];

// Colors from https://en.wikipedia.org/wiki/New_York_City_Subway_nomenclature#Colors_and_trunk_lines
const routeColors = {
  // IND Eighth Avenue Line
  A: '#2850ad',
  C: '#2850ad',
  E: '#2850ad',

  // IND Sixth Avenue Line
  B: '#ff6319',
  D: '#ff6319',
  F: '#ff6319',
  M: '#ff6319',

  // IND Crosstown Line
  G: '#6cbe45',

  // BMT Canarsie Line
  L: '#a7a9ac',

  // BMT Nassau Street Line
  J: '#996633',
  Z: '#996633',

  // BMT Broadway Line
  N: '#fccc0a',
  Q: '#fccc0a',
  R: '#fccc0a',
  W: '#fccc0a',

  // IRT Broadway – Seventh Avenue Line
  '1': '#ee352e',
  '2': '#ee352e',
  '3': '#ee352e',

  // IRT Lexington Avenue Line
  '4': '#00933c',
  '5': '#00933c',
  '6': '#00933c',

  // IRT Flushing Line
  '7': '#b933ad',

  // Shuttles
  S: '#808183'
};

// initMap is called from the Google Maps JS library after the library has initialised itself.
function initMap() {
  const map = new google.maps.Map(document.querySelector('#map'), {
    zoom: 12,
    center: {
      // New York City
      lat: 40.7305,
      lng: -73.9091
    },
    styles: mapStyle
  });
  const infowindow = new google.maps.InfoWindow();
  let stationDataFeatures = [];

  // Load GeoJSON for subway lines. Stations are loaded in the idle callback.
  map.data.loadGeoJson('/data/subway-lines');

  // Style the GeoJSON features (stations & lines)
  map.data.setStyle(feature => {
    const type = feature.getProperty('type');
    if (type === 'cluster') {
      // Icon path from: https://material.io/icons/#ic_add_circle_outline
      return {
        icon: {
          fillColor: '#00b0ff',
          strokeColor: '#3c8cb8',
          fillOpacity: 1.0,
          scale: 1.2,
          path: 'M13 7h-2v4H7v2h4v4h2v-4h4v-2h-4V7zm-1-5C6.48 2 2 6.48 2 12s4' +
            '.48 10 10 10 10-4.48 10-10S17.52 2 12 2zm0 18c-4.41 0-8-3.59-8-8' +
            's3.59-8 8-8 8 3.59 8 8-3.59 8-8 8z'
        }
      };
    } else if (type === 'station') {
      // Icon path from: https://material.io/icons/#ic_train
      return {
        icon: {
          fillColor: '#00b0ff',
          strokeColor: '#3c8cb8',
          fillOpacity: 1.0,
          scale: 1.2,
          path: 'M12 2c-4 0-8 .5-8 4v9.5C4 17.43 5.57 19 7.5 19L6 20.5v.5h2.2' +
            '3l2-2H14l2 2h2v-.5L16.5 19c1.93 0 3.5-1.57 3.5-3.5V6c0-3.5-3.58-' +
            '4-8-4zM7.5 17c-.83 0-1.5-.67-1.5-1.5S6.67 14 7.5 14s1.5.67 1.5 1' +
            '.5S8.33 17 7.5 17zm3.5-7H6V6h5v4zm2 0V6h5v4h-5zm3.5 7c-.83 0-1.5' +
            '-.67-1.5-1.5s.67-1.5 1.5-1.5 1.5.67 1.5 1.5-.67 1.5-1.5 1.5z'
        }
      };
    }

    // if type is not a station or a cluster, it's a subway line
    const routeSymbol = feature.getProperty('rt_symbol');
    return {
      strokeColor: routeColors[routeSymbol]
    };
  });

  map.data.addListener('click', ev => {
    const f = ev.feature;
    const title = f.getProperty('title');
    const description = f.getProperty('description');

    if (!description) {
      return;
    }

    infowindow.setContent(`<b>${title}</b><br/> ${description}`);
    // Hat tip geocodezip: http://stackoverflow.com/questions/23814197
    infowindow.setPosition(f.getGeometry().get());
    infowindow.setOptions({
      pixelOffset: new google.maps.Size(0, -30)
    });
    infowindow.open(map);
  });

  // The idle callback is called every time the map has finished
  // moving, zooming,  panning or animating. We use it to load
  // Geojson for the new viewport.
  google.maps.event.addListener(map, 'idle', () => {
    const sw = map.getBounds().getSouthWest();
    const ne = map.getBounds().getNorthEast();
    const zm = map.getZoom();
    map.data.loadGeoJson(
      `/data/subway-stations?viewport=${sw.lat()},${sw.lng()}|${ne.lat()},${ne.lng()}&zoom=${zm}`,
      null,
      features => {
        stationDataFeatures.forEach(dataFeature => {
          map.data.remove(dataFeature);
        });
        stationDataFeatures = features;
      }
    );
  });
}
Next, modify the back end code. The nycsubway.go file is unchanged from the previous step, but you need to make two changes to stations.go before adding clusterer.go for our station clustering code.
- Call
clusterStationsto cluster the stations retrieved from the R-tree store. TheclusterStationsfunction relies on the new parameter zoom passed from the front end, to cluster appropriately for a given zoom level. - Increase the size of the R-tree query towards the end of
newRect, to prevent the odd behavior of markers mentioned at the end of the previous step.
stations.go
package nycsubway

import (
        "encoding/json"
        "fmt"
        "log"
        "math"
        "net/http"
        "strconv"
        "strings"

        rtree "github.com/dhconnelly/rtreego"
        geojson "github.com/paulmach/go.geojson"
)

// Stations is an RTree housing the stations
var Stations = rtree.NewTree(2, 25, 50)

// Station is a wrapper for `*geojson.Feature` so that we can implement
// `rtree.Spatial` interface type.
type Station struct {
        feature *geojson.Feature
}

// Bounds implements `rtree.Spatial` so we can load
// stations into an `rtree.Rtree`.
func (s *Station) Bounds() *rtree.Rect {
        return rtree.Point{
                s.feature.Geometry.Point[0],
                s.feature.Geometry.Point[1],
        }.ToRect(1e-6)
}

// loadStations loads the geojson features from
// `subway-stations.geojson` into the `Stations` rtree.
func loadStations() {
        stationsGeojson := GeoJSON["subway-stations.geojson"]
        fc, err := geojson.UnmarshalFeatureCollection(stationsGeojson)
        if err != nil {
                // Note: this will take down the GAE instance by exiting this process.
                log.Fatal(err)
        }
        for _, f := range fc.Features {
                Stations.Insert(&Station{f})
        }
}

// subwayStationsHandler reads r for a "viewport" query parameter
// and writes a GeoJSON response of the features contained in
// that viewport into w.
func subwayStationsHandler(w http.ResponseWriter, r *http.Request) {
        w.Header().Set("Content-type", "application/json")
        vp := r.FormValue("viewport")
        rect, err := newRect(vp)
        if err != nil {
                str := fmt.Sprintf("Couldn't parse viewport: %s", err)
                http.Error(w, str, 400)
                return
        }
        zm, err := strconv.ParseInt(r.FormValue("zoom"), 10, 0)
        if err != nil {
                str := fmt.Sprintf("Couldn't parse zoom: %s", err)
                http.Error(w, str, 400)
                return
        }
        s := Stations.SearchIntersect(rect)
        fc, err := clusterStations(s, int(zm))
        if err != nil {
                str := fmt.Sprintf("Couldn't cluster results: %s", err)
                http.Error(w, str, 500)
                return
        }
        err = json.NewEncoder(w).Encode(fc)
        if err != nil {
                str := fmt.Sprintf("Couldn't encode results: %s", err)
                http.Error(w, str, 500)
                return
        }
}

// newRect constructs a `*rtree.Rect` for a viewport.
func newRect(vp string) (*rtree.Rect, error) {
        ss := strings.Split(vp, "|")
        sw := strings.Split(ss[0], ",")
        swLat, err := strconv.ParseFloat(sw[0], 64)
        if err != nil {
                return nil, err
        }
        swLng, err := strconv.ParseFloat(sw[1], 64)
        if err != nil {
                return nil, err
        }
        ne := strings.Split(ss[1], ",")
        neLat, err := strconv.ParseFloat(ne[0], 64)
        if err != nil {
                return nil, err
        }
        neLng, err := strconv.ParseFloat(ne[1], 64)
        if err != nil {
                return nil, err
        }
        minLat := math.Min(swLat, neLat)
        minLng := math.Min(swLng, neLng)
        distLat := math.Max(swLat, neLat) - minLat
        distLng := math.Max(swLng, neLng) - minLng

        // Grow the rect to ameliorate issues with stations
        // disappearing on Zoom in, and being slow to appear
        // on Pan or Zoom out.
        r, err := rtree.NewRect(
                rtree.Point{
                        minLng - distLng/10,
                        minLat - distLat/10,
                },
                []float64{
                        distLng * 1.2,
                        distLat * 1.2,
                })
        if err != nil {
                return nil, err
        }
        return r, nil
}
Before getting to the new clusterer.go file, you need to install one more Go package. Stop the server in the Cloud Shell command line with a [CTRL] + [c], then type the following command on the Cloud Shell command line:
go get github.com/smira/go-point-clustering
Next, add the code for clustering the stations, by creating a clusterer.go file alongside the other two go files you have created so far. This code is reasonably complicated, as it does some mathematical calculations to figure out appropriate cluster sizes. The code is commented, but don't feel you have to understand exactly what is going on here. The art and science of projecting the map of the surface of an oblate spheroid onto a flat planar projection is covered in detail on Wikipedia.
clusterer.go
package nycsubway

import (
        "fmt"
        "math"

        rtree "github.com/dhconnelly/rtreego"
        geojson "github.com/paulmach/go.geojson"
        cluster "github.com/smira/go-point-clustering"
)

// The zoom level to stop clustering at
const minZoomLevelToShowUngroupedStations = 14

// Latitude of NYC, used to guestimate the size of a pixel at a specific
// zoom level.
const nycLatitude float64 = 40.7128

// Station marker image width.
const stationMarkerWidth float64 = 28

// EarthRadius is a rough estimate of earth's radius in km at latitude 0
// if earth was a perfect sphere.
const EarthRadius = 6378.137

// Point enables clustering over `Station`s.
func (s *Station) Point() cluster.Point {
        var p cluster.Point
        p[0] = s.feature.Geometry.Point[0]
        p[1] = s.feature.Geometry.Point[1]
        return p
}

func clusterStations(spatials []rtree.Spatial, zoom int) (*geojson.FeatureCollection, error) {
        var pl cluster.PointList

        for _, spatial := range spatials {
                station := spatial.(*Station)
                pl = append(pl, station.Point())
        }
        clusteringRadius, minClusterSize := getClusteringRadiusAndMinClusterSize(zoom)
        // The following operation groups stations determined to be nearby into elements of
        // "clusters". Some stations may end up not part of any cluster ("noise") - we
        // present these as individual stations on the map.
        clusters, noise := cluster.DBScan(pl, clusteringRadius, minClusterSize)
        fc := geojson.NewFeatureCollection()
        for _, id := range noise {
                f := spatials[id].(*Station).feature
                name, err := f.PropertyString("name")
                if err != nil {
                        return nil, err
                }
                notes, err := f.PropertyString("notes")
                if err != nil {
                        return nil, err
                }
                f.SetProperty("title", fmt.Sprintf("%v Station", name))
                f.SetProperty("description", notes)
                f.SetProperty("type", "station")
                fc.AddFeature(f)
        }
        for _, clstr := range clusters {
                ctr, _, _ := clstr.CentroidAndBounds(pl)
                f := geojson.NewPointFeature([]float64{ctr[0], ctr[1]})
                n := len(clstr.Points)
                f.SetProperty("title", fmt.Sprintf("Station Cluster #%v", clstr.C+1))
                f.SetProperty("description", fmt.Sprintf("Contains %v stations", n))
                f.SetProperty("type", "cluster")
                fc.AddFeature(f)
        }
        return fc, nil
}

func getClusteringRadiusAndMinClusterSize(zoom int) (float64, int) {
        // For highest zoom levels, consider stations 10 meters apart as
        // the same.  Allow for groups of size 2.
        if zoom >= minZoomLevelToShowUngroupedStations {
                return 0.01, 2
        }
        groundResolution := groundResolutionByLatAndZoom(nycLatitude, zoom)
        // Multiply ground resolution per pixel by the width (in pixels).. +
        // "manually adjust".
        clusteringRadius := groundResolution * stationMarkerWidth
        // Set min group size to 3
        return clusteringRadius, 3
}

// groundResolution indicates the distance in km on the ground that is
// represented by a single pixel in the map.
func groundResolutionByLatAndZoom(lat float64, zoom int) float64 {
        // number of pixels for the width of the (square) world map in web
        // mercator.  i.e. for zoom level 0, this would give 256 pixels.
        numPixels := math.Pow(2, float64(8+zoom))
        // We return earth's circumference (at given latitude) divided by
        // number of pixels for the map's width.  Note: EarthRadius is given in
        // km.
        return cos(lat) * 2 * math.Pi * EarthRadius / numPixels
}

// cos returns the cosine function (like math.cos) but accepts degrees as input.
func cos(degree float64) float64 {
        return math.Cos(degree * math.Pi / 180)
}
Notice the constants at the top of the file, after the usual package line and import stanza. The clusterer uses these constants in various ways.
minZoomLevelToShowUngroupedStationsconfigures the zoom level at which we effectively stop clustering.nycLatitudeandearthRadiusare used ingetClusteringRadiusAndMinClusterSizeand its helper functiongroundResolutionByLatAndZoomto approximate the real world size represented by a map pixel, in kilometers.stationMarkerWidthis used to figure out how large an area to cluster over.
The functions are defined next. We define a Point method over *Station so we can easily cluster stations in clusterStations. The main entry point for this file, clusterStations, is called from stations.go to cluster the stations found in the R-tree. The majority of the code in this function is at the tail end, where we iterate through the generated clusters and individual unclustered stations, labelled as noise. The calling convention of the clusterer package is a little obtuse, returned a list of integers acting as indexes into the original list of points handed in. From these two lists, clusters and noise, we generate a list of geojson.PointFeature that are rendered by the front end.
The three helper functions getClusteringRadiusAndMinClusterSize, groundResolutionByLatAndZoom and cos are taken, with only light edits, from the election-au-2016 project, an open source project hosted on GitHub that shows the back end that was used to drive ausvotes.withgoogle.com during the 2016 Australian Federal Election. These helper functions are used to configure the clustering algorithm, called in the middle of clusterStations.
Restart your server:
go fmt *.go && goapp serve
And take a look at your map again. Now we elide stations dynamically by clustering them, depending on zoom level.
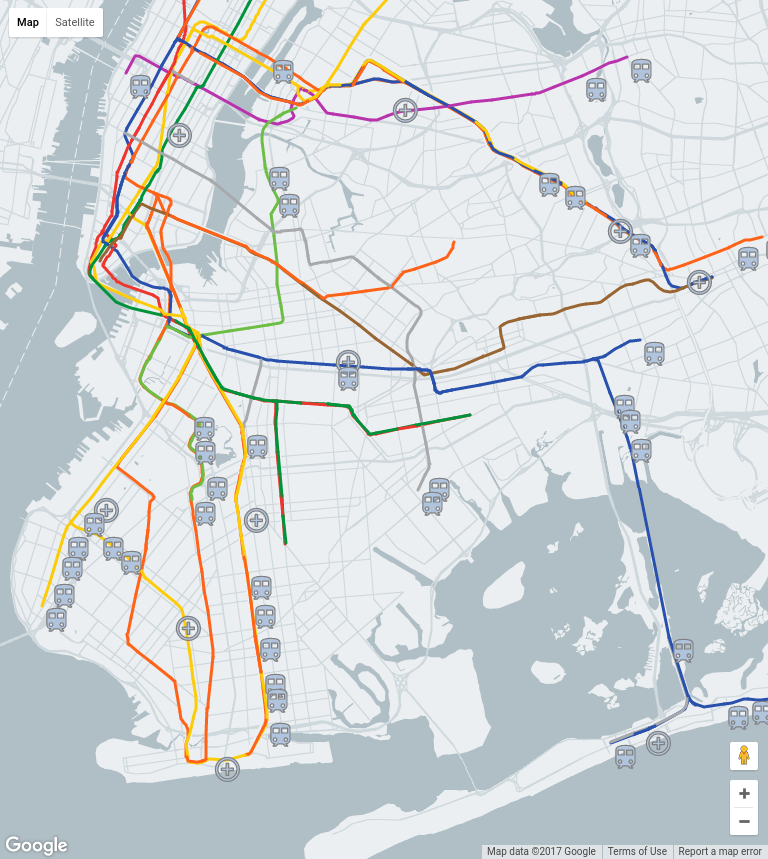
We now have a working map that clusters stations, and looks good. Wouldn't it be great to show it to your friends? In the next step we publish this application to Google App Engine infrastructure, so anyone can see your creation!
Now that you have built an web app that you are proud of, it's time to show it off to the world. You need to automatically scale the back end, based on the number of concurrent incoming requests. Thankfully, Google App Engine handles this effortlessly. All you need to do is deploy the app.
In the nyc-subway directory, type the following command: gcloud app deploy
When asked which region to create the App Engine app in, select us-central by typing ‘2'.
$ gcloud app deploy
You are creating an app for project [nyc-subway-station-locator].
WARNING: Creating an app for a project is irreversible.
Please choose a region for your application. After choosing a region,
you cannot change it. Which region would you like to choose?
 [1] europe-west   (supports standard)
 [2] us-central    (supports standard and flexible)
 [3] us-east1      (supports standard and flexible)
 [4] asia-northeast1 (supports standard and flexible)
 [5] cancel
Please enter your numeric choice:  2
Creating App Engine application in project [nyc-subway-station-locator] and region [us-central]....done.
You are about to deploy the following services:
 - nyc-subway-station-locator/default/20170202t141202 (from [/home/brettmorgan/nyc-subway/app.yaml])
     Deploying to URL: [https://nyc-subway-station-locator.appspot.com]
Do you want to continue (Y/n)?  y
Beginning deployment of service [default]...
File upload done.
Updating service [default]...done.
Deployed service [default] to [https://nyc-subway-station-locator.appspot.com]
You can read logs from the command line by running:
  $ gcloud app logs read -s default
To view your application in the web browser run:
  $ gcloud app browse
Open a new browser tab on the URL that the service was deployed to. In the above listing, the deployed URL is https://nyc-subway-station-locator.appspot.com, but yours will be different.
The easiest way to clean up all the resources created in this project is to shut down the Google Cloud Project that you created at the start of this tutorial:
- Open the Settings Page in the Google Cloud Platform Console
- Click Select a project.
- Select the project you created at the start of this tutorial.
- Click Delete Project.
- Enter the project ID and click Shut down.
If you enjoyed this codelab, but would like to dive into a more fully fleshed out sample, please have a look at our source code repository for the Australian Election 2016 at github.com/google/election-au-2016. This codelab was designed and implemented as a simplified version of the election-au-2016 codebase, and should serve as a good introduction to the techniques used to serve the location of election booths across the wide brown land.
If you completed this codelab as part of the Australia & New Zealand Campus Outreach, please click the following button:
Congratulations, you have successfully completed this codelab!