
1. Evaluation
Now that your Data Card is ready to publish, you need to complete the following follow-up actions to achieve your transparency efforts:
- Use evaluation methods to gain insight into how your Data Card performs with readers.
- Systematically track the usage and adoption of your Data Card efforts to ensure that it's aligned with your readers' interest.
This module offers some approaches to audit your completed Data Card for continued success well after you release it.
As mentioned in previous modules, the main goal of a Data Card reader is to make assessments about the dataset. Therefore, any evaluation of a dataset's Data Card should focus on whether the reader can successfully arrive at acceptable conclusions about the dataset.
Information in a Data Card must align with a reader's experience of using the dataset. This directly impacts the reader's beliefs about the reliability and credibility of the dataset and, subsequently, the reputation and trust in the dataset's authors or publishers.
Inversely, a reader's existing beliefs about your dataset, organization, and other datasets published by your organization can also influence how they engage with your Data Card regardless of how discoverable, usable, or well-constructed it is.
For example, readers with a positive experience of datasets previously published by an organization might implicitly place more trust in a new dataset published by the same authors. In this case, there's a chance that the reader might make intuitive leaps, and might not read the new Data Card closely enough to have the best possible understanding of the dataset and, specifically, how it differs from an older, similar dataset.
As such, the evaluation of a Data Card requires approaches that can assess whether readers can arrive at acceptable conclusions of the dataset within their contexts. These are different from evaluations of the dataset itself, which might not reveal much about the effectiveness of its accompanied Data Card. Instead, you have to evaluate your Data Card through something like a user study, which helps you understand whether your content is understood by different readers, or discover whether your readers still arrive at actionable insights while you iterate on your Data Card. Another approach is to measure the adoption and efficacy of your Data Card through user satisfaction, surveys, and analytics in the Data Card's implementation. In this sense, a Data Card can be a useful probe to drive and evaluate the success of your data set, and paint a clearer picture of your downstream stakeholder needs.
Requirements
There are a variety of stakeholders in a dataset's lifecycle, each with different levels of data fluency, domain expertise, and requirements.
A requirement is a statement that identifies a product or process operational, functional, design characteristic, or constraint that's unambiguous, testable, and necessary for product or process acceptability. The goals of your dataset, stakeholders in the dataset's lifecycle, and the implementation of your transparency efforts play a role in the establishment of the requirements and evaluation criteria of your Data Card. For example, multiple product managers, engineers, data scientists, AI designers, and IRB reviewers might use answers in a Data Card. In this case, a good evaluation process contains criteria that relates directly to the functional, operational, usability, and safety requirements for each of these roles.
Summary
Different evaluation methods yield different insights about the efficacy of a Data Card. You want to select evaluation methods that can be used throughout the transparency-documentation process from creation to launch and thereafter.
The four requirements introduced in this module—functional, operational, usability, and safety—along with the dimensions introduced in the second module—accountability, utility, quality, consequence of use, and risk/recommendations—are a good starting point to assess the overall performance of your Data Card from the direct perspective of readers.
2. Determine your requirements
- To determine your requirements, use the following table, which includes the requirements, what their evaluation criteria might be, and examples of ways to determine whether your Data Card fulfills that criteria with a reader and role in mind:
Requirement | Evaluation criteria | Example |
Functional | Does your Data Card enable readers to complete their tasks given their respective roles? | Consider a data engineer interested in integrating your dataset into their pipeline. Does your Data Card have the information required to successfully implement the infrastructure needed to use the dataset? |
Operational | Does your Data Card enable readers to identify the essential capabilities, performance measures, and other associated requirements and processes necessary to use the dataset effectively? | Consider a machine-learning (ML) model builder that wants to finetune a recommender system with your dataset. Does your Data Card have enough information to determine the constraints and performance needs that must be met? |
Usability | Can readers easily navigate and interact with your Data Card? Does the implementation of your Data Card meet basic usability heuristics and accessibility standards? | Consider a student researcher who wants to use your dataset, but has limited internet access. What kinds of challenges might embedding an interactive, exploratory visualization of your dataset in your Data Card create? What kinds of UI oversights might prevent a screen reader from translating the Data Card for a low-vision reader? |
Safety | Is the information provided in the Data Card useful for practitioners to assess any potential undesirable outcomes associated with your dataset in their domains? | Consider ML practitioners who work in a high-risk domain, such as healthcare. Does your Data Card describe the appropriate security, privacy, robustness, and compliance requirements that necessarily need to be disclosed to prevent poor patient outcomes? |
For more information, see Evaluate with Readers.
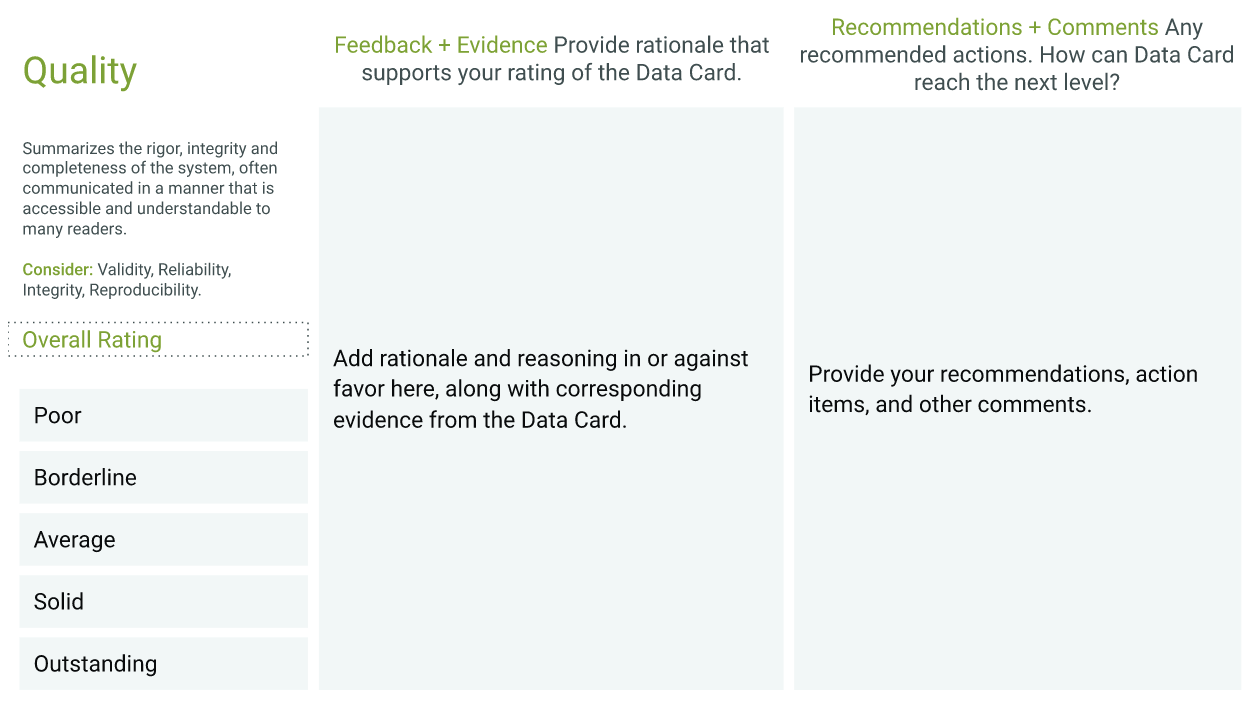
3. Determine your dimensions
- To determine your dimensions, invite a potential reader to assess your Data Card across the five dimensions and use the following form to assess how well your Data Card performs for each:
4. Telemetry at scale
For any form of transparency-oriented documentation to succeed, you must treat the documentation as a user-centric product. Systematically tracking the usage of your Data Card is necessary to inform long-term transparency strategies and broad initiatives that span cross-functional boundaries. While there is no one-size-fits-all approach to measure the success of transparency efforts, there are a variety of factors that you can consider when you set up your impact-tracking program, such as the maturity and goals of your transparency effort, the scale of the organization, or the datasets documented.
For example, you find that some forms of telemetry to measure the efficacy of Data Cards are easier to bake into implementations of interactive Data Cards rather than PDFs. On the other hand, measurement of the efficacy of your Data Card might require you to set up custom mechanisms that measure incomplete or abandoned Data Cards in your organization.
Measuring impact
Generally speaking, metrics for a Data Card template and their adoption can be broadly classified into seven categories: documentation hygiene, resilience and stability, understandability, supportability, conversion, engagement, and reach. However, these metrics aren't equal; rather, they need to be considered in your contexts. The following table lists, defines, and explains when and how to measure these seven categories for Data Cards and Data Card templates:
Category | Definition | When to measure | How to measure |
Documentation hygiene | The satisfaction with which a reader's experience using the dataset aligns with the expectations created by its Data Card.The accuracy with which a producer's experience describing the dataset aligns with the expectations set by the Data Card template. | Template: During completion or immediately after dataset producers complete Data Cards. | Template: Measures how well a Data Card template describes the datasets that it's intended for. For example, the rate of unanswered questions assesses the percentage of questions that are consistently unanswered for a class of datasets. |
Resilience and stability | A Data Card template's ability to withstand modifications or additions, especially if used in multiple domains or when a Data Card is read by diverse readers. | Template: During completion or immediately after producers have completed Data Cards. Particularly note revisions made post-launch | Template: Measures the diversity of datasets that a template captures without edits, most common edits, and the volume of questions that are incorrectly answered or are repurposed. For example, edit ratio is the ratio between the number of Data Cards created with a template and the amount of edits made in the template. |
Understandability | How well a producer can onboard and use a Data Card template, and how efficiently a new reader of a Data Card can onboard, habituate, and use information in a completed Data Card. | Template: When providing templates to dataset producers to complete with check-ins at milestones during the completion process. | Template: Measures producers' comprehension of the Data Card template and the difficulty of its sections. For example, formative studies proactively recruit readers to participate in surveys and cognitive walkthroughs for specific insights. |
Supportability | The capacity for providing support to sustain Data Cards and the amount of support provided. | Template: As soon as you set up a Data Cards effort in your organization, regardless of scale, and if it's ad-hoc. | Template: Measures additional time and expertise required to complete and publish a Data Card template. For example, office hours measure the attendance, dataset types, and questions received during office hours or support programs for dataset producers creating Data Cards. |
Conversion | Tracks the percentage of producers who complete and publish a Data Card from a template and the percentage of readers who make decisions about a dataset based on its Data Card. | Template: As soon as you set up a Data Cards effort in your organization, regardless of scale, and if it is ad-hoc. | Template: Measures rates of producer success with completing Data Card templates. For example, analytics track completion rate and time to release, and percentage of relevant sections in a Data Card template. |
Engagement | Tracks how actively involved your audience is with your content, such as your Data Card. | Template: After Data Card templates are established and circulated in your organization. | Template: Measures the level of involvement and commitment that dataset producers have in a Data Card program. For example:
Data Card: Measures the use of the Data Card and the generation of knowledge from it.
|
Reach | Tracks the total number of unique people who see your Data Card. This is an important precursor to additional metrics like engagement and conversion. | Template: After Data Card templates have been established and circulated in your organization. | Template: Measures the number of Data Cards that an organization can produce relative to the number of datasets that it has. |
For more information, see Telemetry at Scale.
Operationalizing these telemetry metrics might require varying levels of resources and support. For example, focus groups that unpack how producer-friendly a Data Card is require a considerably different set of resources compared to analytics that record Data Card completion rates. Similarly, measuring traffic to a Data Card requires relatively fewer resources than a series of post-launch interviews that unpack engagement levels. You can review these different categories with cross–functional decision makers in your organization to determine which should be used to track impact and how.
Summary
In the end, metrics that measure the impact of a Data Card are different from those that measure your progress toward completing your Data Card. The maturity of a dataset can change the way that you interpret Data Card metrics. Factor in the maturity and popularity of the dataset, and consider quantitative, qualitative, and anecdotal impact in unison.
5. Select your metrics
As mentioned, your context determines the metrics that you need to ensure that you fulfill your transparency goals.
To select your metrics, follow these steps:
- Diversify your goals. Establish team goals for your transparency efforts that not only evaluate your progress towards completing your Data Card, but its impact with respect to your readers after you have created and launched it.
- Define lead and lag metrics. For each lag metric that tells you when you reach a goal, establish lead metrics to track critical activities that contribute to the goal.
- Set a cadence for complementary, qualitative studies. As you set up the necessary infrastructure to measure Data Cards across your organization, create a plan to regularly run qualitative studies to verify results and calibrate quantitative metrics.
- Train individual data teams. Enable teams that produce datasets and Data Cards to interpret qualitative and quantitative metrics in unison within the context of their datasets and Data Cards.
6. Congratulations
Congratulations! You have everything needed to create a Data Card! Now you're ready to take a quiz to test your knowledge.