
Google Data Studio lets users build live, interactive dashboards with beautiful data visualizations, for free. Users can fetch their data from a variety of sources and create reports in Data Studio, with full editing and sharing capabilities. Here's an example Data Studio dashboard:
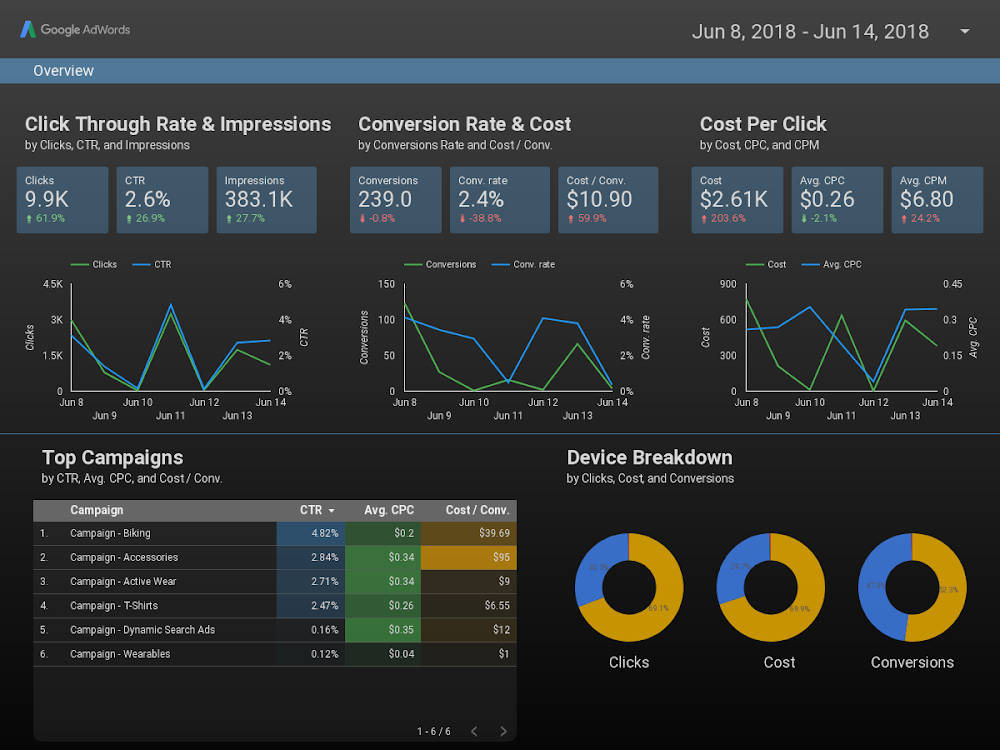
(Click here to view this example report in Data Studio)
Data Studio provides several built-in chart types, including line charts, bar chart, pie charts, and scatter plots. Community visualizations allow you to build and use your own custom JavaScript visualizations in Data Studio. Community visualizations are built by the Data Studio developer community - any developer can build one. You can also share your community visualizations with others so that they can use them with their own data.
What you'll learn
In this code lab, you'll learn:
- How a Google Data Studio community visualization works
- How to build a community visualization using the ds-component helper library
- How to integrate your community visualization into a Data Studio dashboard
What you'll need
To complete this code lab, you'll need:
- Access to the internet and a web browser
- A Google account
- Access to a Google Cloud Platform storage bucket
- Familiarity with Javascript
Why did you choose this codelab?
How do you plan to use this codelab/tutorial?
How would you rate your experience with Data Studio?
What best describes your background?
What JavaScript visualization libraries are you interested in?
Move to the next page to submit survey information.
Data Studio community visualizations allow you to create and use custom JavaScript visualizations that integrate into your dashboards.
In this codelab, you will create a bar chart community visualization that supports 1 dimension, 1 metric, and bar color style.
To create a community visualization, you need the following files in a Google Cloud Platform storage bucket, which you will create in a later step.
Filename | Filetype | Purpose |
manifest.json* | JSON | Provides metadata about the visualization and the location of the other resources. |
myViz.json | JSON | Provides data and style configuration options for the Property panel. |
myViz.js | JavaScript | Provides the JavaScript code required for displaying the visualization. |
myViz.css (optional) | CSS | Provides styling for the visualization. |
*The manifest is the only file that has a required name. The other files can be named differently, as long as their name/location is specified in your manifest file.
In this section, you'll add the code required to handle data, style changes, and visualization rendering into your JavaScript file.
Write the visualization source
Step 1: Download the dscc.min.js file from the Data Studio Community Component Library and copy it to your working directory.
Step 2: Copy the following code into a text editor and save it as myVizSource.js in your local working directory.
myVizSource.js
function drawViz(data) {

  // set margins + canvas size
  const margin = { top: 10, bottom: 50, right: 10, left: 10 };
  const height = dscc.getHeight() - margin.top - margin.bottom;
  const width = dscc.getWidth() - margin.left - margin.right;

  // remove the svg if it already exists
  if (document.querySelector("svg")) {
    let oldSvg = document.querySelector("svg");
    oldSvg.parentNode.removeChild(oldSvg);
  }

  const svg = document.createElementNS("http://www.w3.org/2000/svg", "svg");
  svg.setAttribute("height", `${height}px`);
  svg.setAttribute("width", `${width}px`);

  const rect = document.createElementNS("http://www.w3.org/2000/svg", "rect");
  rect.setAttribute('width', `${width/2}px`);
  rect.setAttribute('height', `${height/2}px`);
  rect.style.fill =  'blue';

  svg.append(rect);

  document.body.appendChild(svg);
}
// subscribe to data and style changes
dscc.subscribeToData(drawViz, { transform: dscc.objectTransform });
Prepare the final JavaScript file
Step 3: Combine all JavaScript required into a single file by copying the contents of the visualization helper library (dscc.min.js) and your myVizSource.js file into a new file named myViz.js. Run the following commands to concatenate the files. Repeat this step each time you update your visualization code.
Linux/Mac OS concatenation script
cat dscc.min.js > myViz.js
echo >> myViz.js
cat myVizSource.js >> myViz.js
Windows script
del myViz.js
type nul > myViz.js
type dscc.min.js >> myViz.js
echo.>> myViz.js
type myVizSource.js >> myViz.js
The CSS file defines the styling for your visualization. Copy the following code and save it as myViz.css.
myViz.css
#myVizTitle {
  color: black;
  font-size: 24px;
  text-align: center;
  margin: 0 auto;
}
The visualization config json file defines the data and style attributes supported and required by your visualization. This visualization you'll build in this codelab supports one dimension and one metric, and requires one style element to select a color. Learn more about dimensions and metrics.
Copy the following code and save it as myViz.json.To learn more about the properties you can configure, visit the config reference documentation.
myViz.json
{
  "data": [
    {
      "id": "concepts",
      "label": "Concepts",
      "elements": [
        {
          "id": "barDimension",
          "label": "Dimension",
          "type": "DIMENSION",
          "options": {
            "min": 1,
            "max": 1
          }
        },
        {
          "id": "barMetric",
          "label": "Metric",
          "type": "METRIC",
          "options": {
            "min": 1,
            "max": 1
          }
        }
      ]
    }
  ],
  "style": [
    {
      "id": "color",
      "label": "Colors",
      "elements": [
        {
          "type": "FONT_COLOR",
          "id": "barColor",
          "label": "Bar Color",
          "defaultValue": "black"
        }
      ]
    }
  ]
}
Step 1: Create a Google Cloud Platform (GCP) Project
Step 2: Create a GCP bucket. The recommended storage class is Regional. Visit Cloud Storage Pricing for details on free tiers. It is unlikely your visualization storage will incur any costs for the Regional storage class.
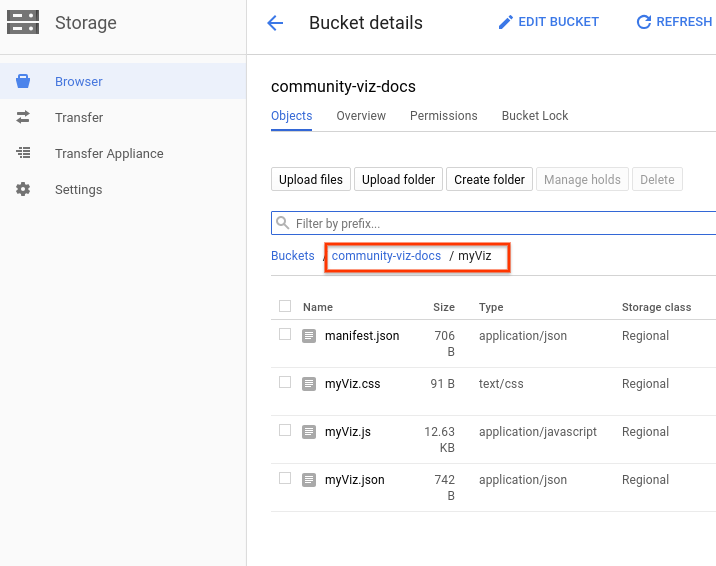
Step 3: Take note of your bucket name/path, beginning with the section after Buckets/ . Data Studio calls this the "component ID", and it will be used to identify and deploy.
The manifest file provides information about your visualization location and resources. It must be named "manifest.json", and it must be located in the bucket created in the previous step (the same one used for your component ID).
Copy the following code into a text editor and save it as manifest.json.
To learn more about the manifest, visit the manifest reference documentation.
manifest.json
{
  "name": "Community Visualization",
  "logoUrl": "https://raw.githubusercontent.com/googledatastudio/community-visualizations/master/docs/codelab/img/bar_chart.png",
  "organization": "Data Studio Codelab",
  "supportUrl": "https://url",
  "packageUrl": "https://url",
  "privacyPolicyUrl": "https://url",
  "description": "Community Visualization Codelab",
  "devMode": true,
  "components": [{
    "id": "barChart",
    "name": "Bar Chart",
    "iconUrl": "https://raw.githubusercontent.com/googledatastudio/community-visualizations/master/docs/codelab/img/bar_chart.png",
    "description": "Bar chart written in d3.js",
    "resource": {
      "js": "MY_GOOGLE_CLOUD_STORAGE_BUCKET/myViz.js",
      "config": "MY_GOOGLE_CLOUD_STORAGE_BUCKET/myViz.json",
      "css": "MY_GOOGLE_CLOUD_STORAGE_BUCKET/myViz.css"
    }
  }]
}
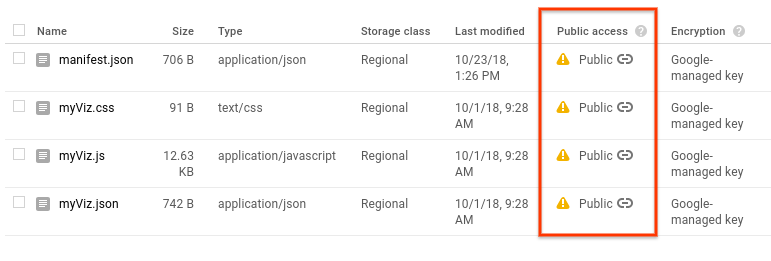
- Upload the
manifest.json,myViz.js,myViz.json, andmyViz.cssfiles to the Google Cloud Storage bucket using the web interface or the gsutil command-line tool. Repeat this each time you update your visualization.
gsutil upload commands
gsutil cp -a public-read manifest.json gs://MY_GOOGLE_CLOUD_STORAGE_BUCKET
gsutil cp -a public-read myViz.* gs://MY_GOOGLE_CLOUD_STORAGE_BUCKET
Step 1: Copy the URL for the Community Visualization sample data set.
Step 2: Visit Data Studio and click Blank under Start a new report.
Step 3: On the bottom right, click CREATE NEW DATA SOURCE.

Step 4: Select the Google Sheets connector.
Step 5: In the URL field, enter the URL of the Google Sheet from step 1 above.
Step 6: In the top-right of the page, click CONNECT
Step 7: On the data source header, click on Community visualizations access, select ON, and click Save.
Step 7: Click ADD TO REPORT in the box that appears to add the Data Source to your report.
Step 6: In the toolbar, click the community visualization button  . This opens a drop-down.

Step 7: Paste your bucket name prefixed by gs:// (for example: gs://community-viz-docs/myViz) into the text input for "Manifest Path", add barChart under "Component ID," and click "ADD". 
Your visualization will automatically be drawn on your canvas. The property panel on the right-hand side should reflect the elements in your myViz.json file.
The visualization allows for one Dimension and one Metric.
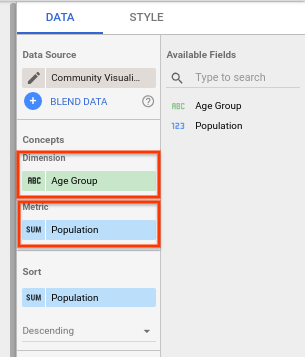
One Style Element was specified - rendering a Font Color selector labelled "Bar Color." In the next step, you'll use this selector to affect the visualization.

In this section, you will use the color selector style element to update your visualization.
Step 1: Replace the code in your myVizSource.js file with the code below.
myVizSource.js
function drawViz(data) {

  // set margins + canvas size
  const margin = { top: 10, bottom: 50, right: 10, left: 10 };
  const height = dscc.getHeight() - margin.top - margin.bottom;
  const width = dscc.getWidth() - margin.left - margin.right;

  // remove the svg if it already exists
  if (document.querySelector("svg")) {
    let oldSvg = document.querySelector("svg");
    oldSvg.parentNode.removeChild(oldSvg);
  }

  const svg = document.createElementNS("http://www.w3.org/2000/svg", "svg");
  svg.setAttribute("height", `${height}px`);
  svg.setAttribute("width", `${width}px`);

  const fillColor =  data.style.barColor.value
  ? data.style.barColor.value.color
  : data.style.barColor.defaultValue;

  const rect = document.createElementNS("http://www.w3.org/2000/svg", "rect");
  rect.setAttribute('width', `${width/2}px`);
  rect.setAttribute('height', `${height/2}px`);
  rect.style.fill =  fillColor;
  svg.append(rect);

  document.body.appendChild(svg);
}
// subscribe to data and style changes
dscc.subscribeToData(drawViz, { transform: dscc.objectTransform });
Step 2: Create the combined JavaScript file, then re-upload your visualization files to Google Cloud Storage.
Step 3: Refresh the Data Studio report where you tested your community visualization.
You should be able to change the color of the rectangle using the selector in the style menu.
In this section, you will update your visualization to draw a bar chart using the data from the Community Visualization sample data set. Note: Data Studio returns a max of 2,500 rows of data to the visualization.
Step 1: Replace the code in your myVizSource.js file with the code below.
myVizSource.js
function drawViz(data) {
  let rowData = data.tables.DEFAULT;

  // set margins + canvas size
  const margin = { top: 10, bottom: 50, right: 10, left: 10 };
  const padding = { top: 15, bottom: 15 };
  const height = dscc.getHeight() - margin.top - margin.bottom;
  const width = dscc.getWidth() - margin.left - margin.right;

  // remove the svg if it already exists
  if (document.querySelector("svg")) {
    let oldSvg = document.querySelector("svg");
    oldSvg.parentNode.removeChild(oldSvg);
  }

  const svg = document.createElementNS("http://www.w3.org/2000/svg", "svg");
  svg.setAttribute("height", `${height}px`);
  svg.setAttribute("width", `${width}px`);

  const fillColor =  data.style.barColor.value
  ? data.style.barColor.value.color
  : data.style.barColor.defaultValue;

  const maxBarHeight = height - padding.top - padding.bottom;
  const barWidth = width / (rowData.length * 2);

  // obtain the maximum bar metric value for scaling purposes
  let largestMetric = 0;

  rowData.forEach(function(row) {
    largestMetric = Math.max(largestMetric, row["barMetric"][0]);
  });

  rowData.forEach(function(row, i) {
    // 'barDimension' and 'barMetric' come from the id defined in myViz.json
    // 'dimId' is Data Studio's unique field ID, used for the filter interaction
    const barData = {
      dim: row["barDimension"][0],
      met: row["barMetric"][0],
      dimId: data.fields["barDimension"][0].id
    };

    // calculates the height of the bar using the row value, maximum bar
    // height, and the maximum metric value calculated earlier
    let barHeight = Math.round((barData["met"] * maxBarHeight) / largestMetric);

    // normalizes the x coordinate of the bar based on the width of the convas
    // and the width of the bar
    let barX = (width / rowData.length) * i + barWidth / 2;

    // create the "bar"
    let rect = document.createElementNS("http://www.w3.org/2000/svg", "rect");
    rect.setAttribute("x", barX);
    rect.setAttribute("y", maxBarHeight - barHeight);
    rect.setAttribute("width", barWidth);
    rect.setAttribute("height", barHeight);
    rect.setAttribute("data", JSON.stringify(barData));
    rect.style.fill = fillColor;
    svg.appendChild(rect);

    // add text labels
    let text = document.createElementNS("http://www.w3.org/2000/svg", "text");
    let textX = barX + barWidth / 2;
    text.setAttribute("x", textX);
    text.setAttribute("text-anchor", "middle");
    let textY = maxBarHeight + padding.top;
    text.setAttribute("y", textY);
    text.setAttribute("fill", fillColor)
    text.innerHTML = barData["dim"];

    svg.appendChild(text);
  });

  document.body.appendChild(svg);
}

// subscribe to data and style changes
dscc.subscribeToData(drawViz, { transform: dscc.objectTransform });
Step 2: Create the combined JavaScript file, then re-upload your visualization files to Google Cloud Storage.
Step 3: Refresh the Data Studio report where you tested your community visualization. You should have a bar chart with labels generated from the data in the Google Sheet. To change the color of the bars, change the color selected in the Style "Bar Color" selector.
In this section, you will update your visualization to draw a bar chart using the data from the Community Visualization sample data set.
Step 1: Replace the code in your myVizSource.js file with the code below.
myVizSource.js
// create a title element
var titleElement = document.createElement('div');
titleElement.id = 'myVizTitle';
document.body.appendChild(titleElement);

function drawViz(data) {
  let rowData = data.tables.DEFAULT;

  // set margins + canvas size
  const margin = { top: 10, bottom: 50, right: 10, left: 10 };
  const padding = { top: 15, bottom: 15 };
  const height = dscc.getHeight() - margin.top - margin.bottom;
  const width = dscc.getWidth() - margin.left - margin.right;

  const fillColor =  data.style.barColor.value
  ? data.style.barColor.value.color
  : data.style.barColor.defaultValue;

  // remove the svg if it already exists
  if (document.querySelector("svg")) {
    let oldSvg = document.querySelector("svg");
    oldSvg.parentNode.removeChild(oldSvg);
  }

  const svg = document.createElementNS("http://www.w3.org/2000/svg", "svg");
  svg.setAttribute("height", `${height}px`);
  svg.setAttribute("width", `${width}px`);

  const maxBarHeight = height - padding.top - padding.bottom;
  const barWidth = width / (rowData.length * 2);

  // obtain the maximum bar metric value for scaling purposes
  let largestMetric = 0;

  rowData.forEach(function (row) {
    largestMetric = Math.max(largestMetric, row["barMetric"][0]);
  });

  rowData.forEach(function (row, i) {
    // 'barDimension' and 'barMetric' come from the id defined in myViz.json
    // 'dimId' is Data Studio's unique field ID, used for the filter interaction
    const barData = {
      dim: row["barDimension"][0],
      met: row["barMetric"][0],
      dimId: data.fields["barDimension"][0].id
    };

    // calculates the height of the bar using the row value, maximum bar
    // height, and the maximum metric value calculated earlier
    let barHeight = Math.round((barData["met"] * maxBarHeight) / largestMetric);

    // normalizes the x coordinate of the bar based on the width of the convas
    // and the width of the bar
    let barX = (width / rowData.length) * i + barWidth / 2;

    // create the "bar"
    let rect = document.createElementNS("http://www.w3.org/2000/svg", "rect");
    rect.setAttribute("x", barX);
    rect.setAttribute("y", maxBarHeight - barHeight);
    rect.setAttribute("width", barWidth);
    rect.setAttribute("height", barHeight);
    rect.setAttribute("data", JSON.stringify(barData));
    // use style selector from Data Studio
    rect.style.fill = fillColor;
    svg.appendChild(rect);

    // add text labels
    let text = document.createElementNS("http://www.w3.org/2000/svg", "text");
    let textX = barX + barWidth / 2;
    text.setAttribute("x", textX);
    text.setAttribute("text-anchor", "middle");
    let textY = maxBarHeight + padding.top;
    text.setAttribute("y", textY);
    text.setAttribute("fill", fillColor)
    text.innerHTML = barData["dim"];

    svg.appendChild(text);
  });

  document.body.appendChild(svg);

  // Get the human-readable name of the metric and dimension

  var metricName = data.fields['barMetric'][0].name;
  var dimensionName = data.fields['barDimension'][0].name;

  titleElement.innerText = metricName + ' by ' + dimensionName;

}

dscc.subscribeToData(drawViz, { transform: dscc.objectTransform });
Step 2: Create the combined JavaScript file, then re-upload your visualization files to Google Cloud Storage.
Step 3: Refresh the Data Studio report where you tested your community visualization. You should have a bar chart with a title generated from the data and styled using your myViz.css file..

Congratulations - you've created a community visualization in Data Studio! This brings you to the end of this codelab. Now, let's see what next steps you can take.
Extend your visualization
- Add interactions to your visualization
- Learn to develop a visualization locally
- Learn more about available style elements and add additional styling to your visualization.
Do more with community visualizations
- Review the references for the dscc helper library, manifest, and configuration file.
- Submit your visualization to our Community Visualization Showcase.
- Build a community connector for Data Studio.
Additional resources
Below are various resources you can access to help you dig deeper into the material covered in this codelab.
Resource Type | User Features | Developer Features |
Documentation | ||
News & Updates | Sign up in Data Studio > User Settings | |
Ask Questions | ||
Videos | Coming Soon! | |
Examples |