
While client app and frontend web developers commonly use tools like the Android Studio CPU Profiler or the profiling tools included in Chrome to improve their code's performance, equivalent techniques haven't been nearly as accessible or well adopted by those who work on backend services. Stackdriver Profiler brings these same capabilities to service developers, regardless of whether their code is running on the Google Cloud Platform or elsewhere.
The tool gathers CPU usage and memory-allocation information from your production applications. It attributes that information to the application's source code, helping you identify the parts of the application consuming the most resources, and otherwise illuminating the performance characteristics of the code. Low overhead of the collection techniques employed by the tool makes it suitable for continuous use in production environments.
In this codelab, you will learn how to set up Stackdriver Profiler for a Go program and will get familiar with what kind of insights about application performance the tool can present.
What you'll learn
- How to configure a Go program for profiling with Stackdriver Profiler.
- How to collect, view and analyze the performance data with Stackdriver Profiler.
What you'll need
- A Google Cloud Platform project
- A browser, such Chrome or Firefox
- Familiarity with standard Linux text editors such as Vim, EMACs or Nano
How will you use use this tutorial?
How would you rate your experience with Google Cloud Platform?
Self-paced environment setup
If you don't already have a Google Account (Gmail or Google Apps), you must create one. Sign-in to Google Cloud Platform console (console.cloud.google.com) and create a new project:


Remember the project ID, a unique name across all Google Cloud projects (the name above has already been taken and will not work for you, sorry!). It will be referred to later in this codelab as PROJECT_ID.
Next, you'll need to enable billing in the Cloud Console in order to use Google Cloud resources.
Running through this codelab shouldn't cost you more than a few dollars, but it could be more if you decide to use more resources or if you leave them running (see "cleanup" section at the end of this document).
New users of Google Cloud Platform are eligible for a $300 free trial.
Google Cloud Shell
While Google Cloud can be operated remotely from your laptop, to make the setup simpler in this codelab we will be using Google Cloud Shell, a command line environment running in the Cloud.
Activate Google Cloud Shell
From the GCP Console click the Cloud Shell icon on the top right toolbar:

Then click "Start Cloud Shell":

It should only take a few moments to provision and connect to the environment:

This virtual machine is loaded with all the development tools you'll need. It offers a persistent 5GB home directory, and runs on the Google Cloud, greatly enhancing network performance and authentication. Much, if not all, of your work in this lab can be done with simply a browser or your Google Chromebook.
Once connected to Cloud Shell, you should see that you are already authenticated and that the project is already set to your PROJECT_ID.
Run the following command in Cloud Shell to confirm that you are authenticated:
gcloud auth list
Command output
Credentialed accounts:
 - <myaccount>@<mydomain>.com (active)
gcloud config list project
Command output
[core]
project = <PROJECT_ID>
If it is not, you can set it with this command:
gcloud config set project <PROJECT_ID>
Command output
Updated property [core/project].
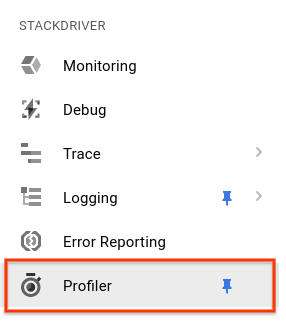
In Cloud Console, navigate to the Profiler UI by clicking on "Profiler" in the left navigation bar:
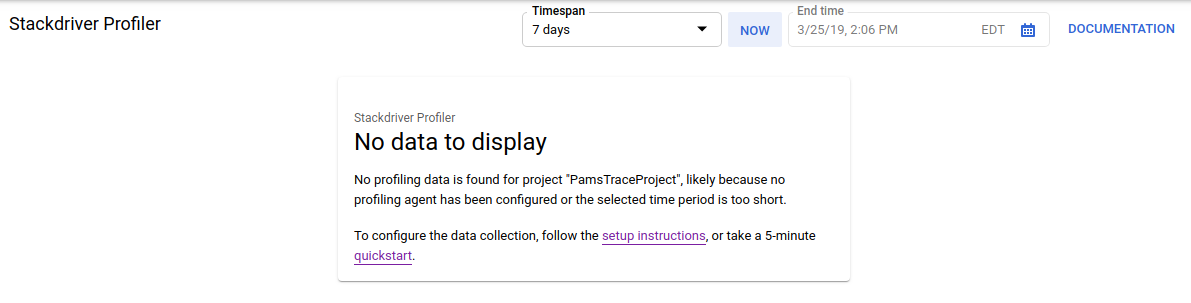
Alternatively you can use the Cloud Console search bar to navigate to the Profiler UI: just type "Stackdriver Profiler" and select the found item. Either way, you should see the Profiler UI with the "No data to display" message like below. The project is new, so it doesn't have any profiling data collected yet.
It's now time to get something profiled!
We'll use a simple synthetic Go application available on Github. In the Cloud Shell terminal that you still have open (and while the "No data to display" message still shown in the Profiler UI), run the following command:
$ go get -u github.com/GoogleCloudPlatform/golang-samples/profiler/...
Then switch to the application directory:
$ cd ~/gopath/src/github.com/GoogleCloudPlatform/golang-samples/profiler/hotapp
The directory contains the "main.go" file, which is a synthetic app that has the profiling agent enabled:
main.go
...
import (
        ...
        "cloud.google.com/go/profiler"
)
...
func main() {
        err := profiler.Start(profiler.Config{
                Service:        "hotapp-service",
                DebugLogging:   true,
                MutexProfiling: true,
        })
        if err != nil {
                log.Fatalf("failed to start the profiler: %v", err)
        }
        ...
}
The profiling agent collects CPU, heap and thread profiles by default. The code here enables the collection of mutex (also known as "contention") profiles.
Now, run the program:
$ go run main.go
As the program runs, the profiling agent will periodically collect profiles of the five configured types. The collection is randomized over time (with average rate of one profile per minute for each of the types), so it may take up to three minutes to get each of the types collected. The program tells you when it creates a profile. The messages are enabled by the DebugLogging flag in the configuration above; otherwise, the agent runs silently:
$ go run main.go
2018/03/28 15:10:24 profiler has started
2018/03/28 15:10:57 successfully created profile THREADS
2018/03/28 15:10:57 start uploading profile
2018/03/28 15:11:19 successfully created profile CONTENTION
2018/03/28 15:11:30 start uploading profile
2018/03/28 15:11:40 successfully created profile CPU
2018/03/28 15:11:51 start uploading profile
2018/03/28 15:11:53 successfully created profile CONTENTION
2018/03/28 15:12:03 start uploading profile
2018/03/28 15:12:04 successfully created profile HEAP
2018/03/28 15:12:04 start uploading profile
2018/03/28 15:12:04 successfully created profile THREADS
2018/03/28 15:12:04 start uploading profile
2018/03/28 15:12:25 successfully created profile HEAP
2018/03/28 15:12:25 start uploading profile
2018/03/28 15:12:37 successfully created profile CPU
...
The UI will update itself shortly after first of the profiles is collected. It won't auto-update after that, so to see the new data, you'll need to refresh the Profiler UI manually. To do that, click the Now button in the time interval picker twice:

After the UI refreshes, you will see something like this:
The profile type selector shows the five profile types available:

Let's now review each of the profile types and some important UI capabilities, and then conduct some experiments. At this stage, you no longer need the Cloud Shell terminal, so you can exit it by pressing CTRL-C and typing "exit".
Now that we've collected some data, let's look at it more closely. We are using a synthetic app (the source is available on Github) that simulates behaviors typical of different kinds of performance issues in production.
CPU-intensive Code
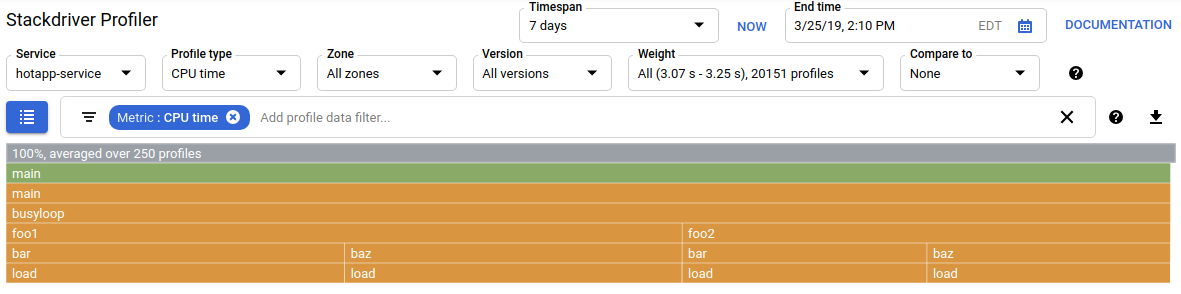
Select the CPU profile type. After the UI loads it, you'll see in the flame graph the four leaf blocks for load function, which collectively account for all the CPU consumption:
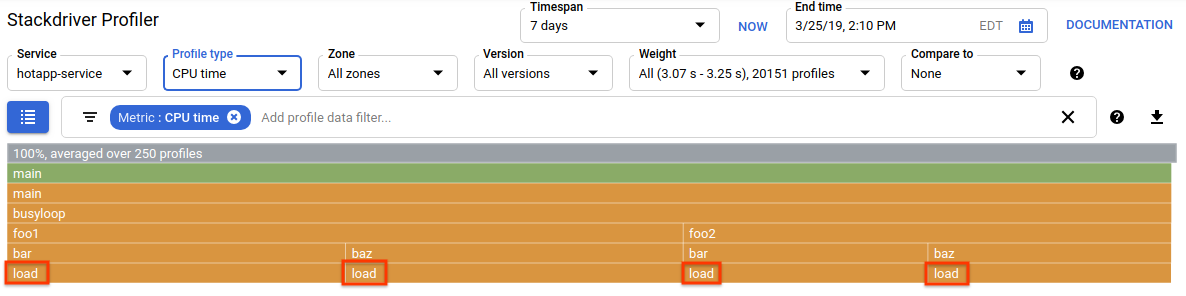
This function is specifically written to consume a lot of CPU cycles by running a tight loop:
main.go
func load() {
        for i := 0; i < (1 << 20); i++ {
        }
}
The function is called indirectly from busyloop() via four call paths: busyloop → {foo1, foo2} → {bar, baz} → load. The width of a function box represents the relative cost of the specific call path. In this case all four paths have about the same cost. In a real program, you want to focus on optimizing call paths that matter the most in terms of performance. The flame graph, which visually emphasizes the more expensive paths with larger boxes, makes these paths easy to identify.
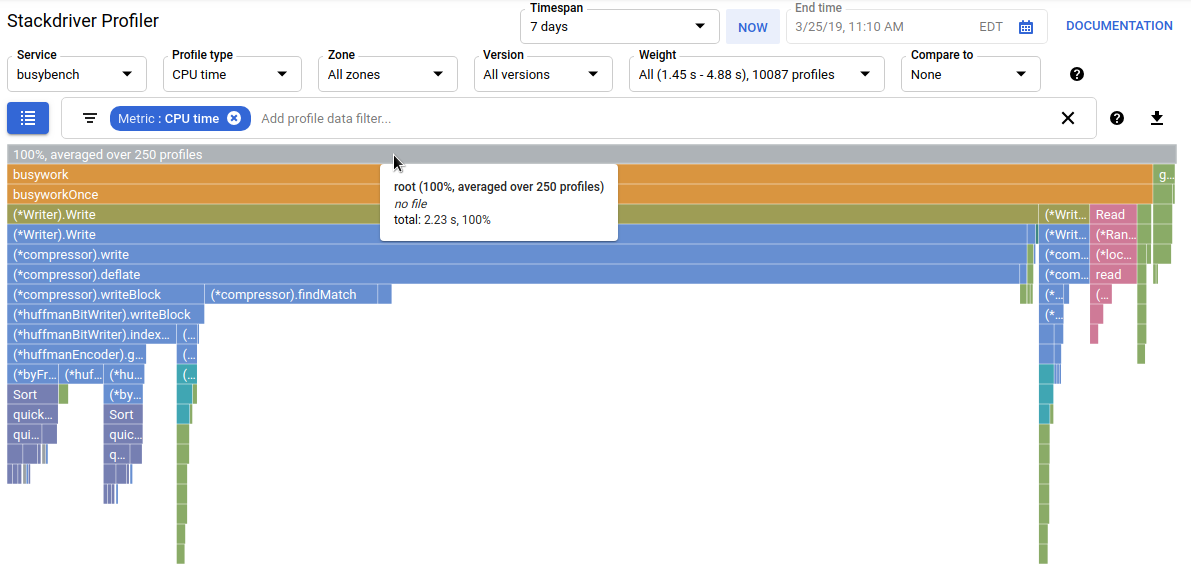
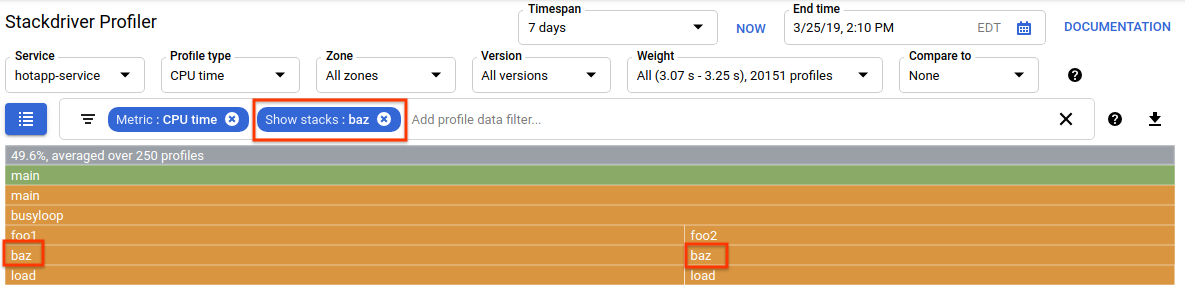
You can use the profile data filter to further refine the display. For example, try adding a "Show stacks" filter specifying "baz" as the filter string. You should see something like the screenshot below, where only two of the four call paths to load() are displayed. These two paths are the only ones that go through a function with the string "baz" in its name. Such filtering is useful when you want to focus on a subpart of a bigger program (for example, because you only own part of it).
Memory-intensive Code
Now switch to "Heap" profile type. Make sure to remove any filters you created in previous experiments. You should now see a flame graph where allocImpl, called by alloc, is displayed as the main consumer of memory in the app:
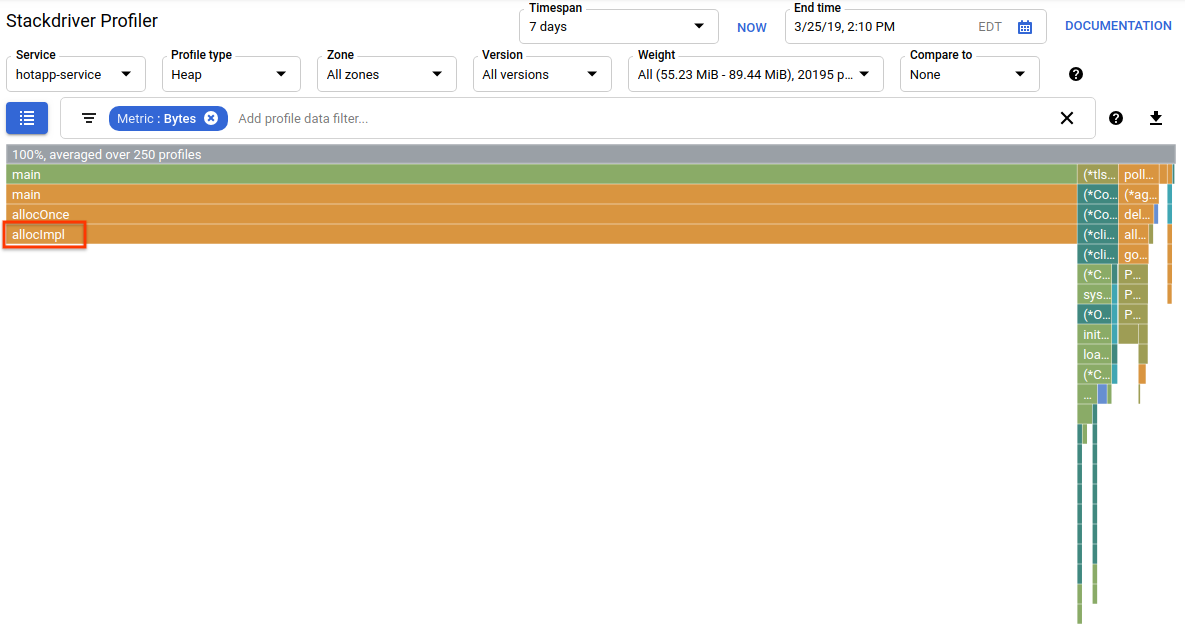
The summary table above the flame graph indicates that the total amount of used memory in the app is on average ~57.4 MiB, most of it is allocated by allocImpl function. This is not surprising, given the implementation of this function:
main.go
func allocImpl() {
        // Allocate 64 MiB in 64 KiB chunks
        for i := 0; i < 64*16; i++ {
                mem = append(mem, make([]byte, 64*1024))
        }
}
The function executes once, allocating 64 MiB in smaller chunks, then storing pointers to those chunks in a global variable to protect them from being garbage collected. Note that the amount of memory shown as used by profiler is slightly different from 64 MiB: the Go heap profiler is a statistical tool, so the measurements are low-overhead but not byte-accurate. Don't be surprised when seeing a ~10% difference like this.
IO-intensive Code
If you choose "Threads" in the profile type selector, the display will switch to a flame graph where most of the width is taken by wait and waitImpl functions:
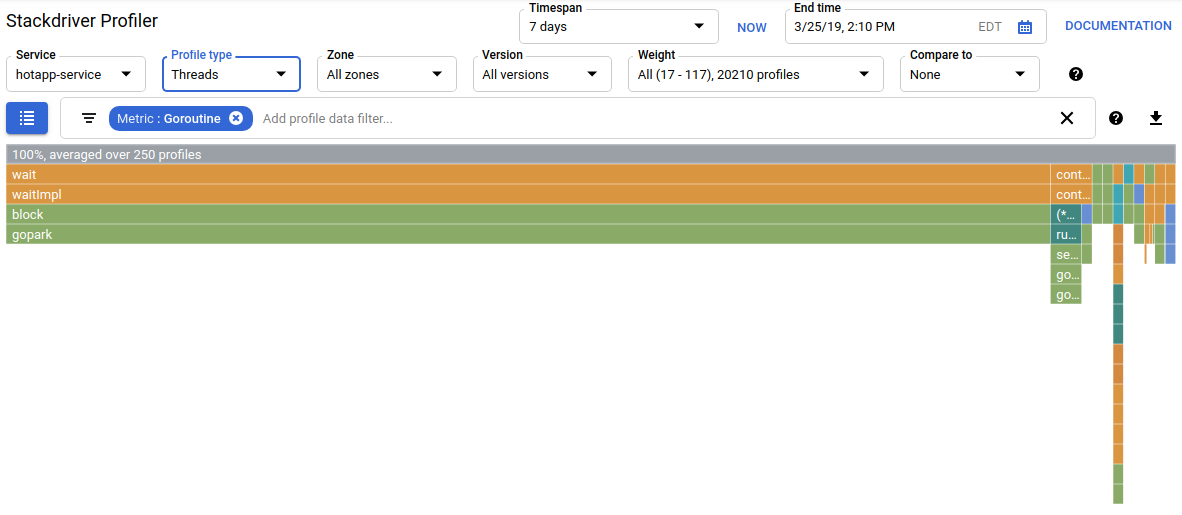
In the summary above flame graph, you can see that there are 100 goroutines that grow their call stack from the wait function. This is exactly right, given that the code that initiates these waits looks like this:
main.go
func main() {
        ...
        // Simulate some waiting goroutines.
        for i := 0; i < 100; i++ {
                go wait()
        }
This profile type is useful for understanding whether the program spends any unexpected time in waits (like I/O). Such call stacks would not be typically sampled by the CPU profiler, as they don't consume any significant portion of the CPU time. You'll often want to use "Hide stacks" filters with Threads profiles - for example, to hide all stacks ending with a call to gopark, since those are often idle goroutines and less interesting than ones that wait on I/O.
The threads profile type can also help identify points in program where threads are waiting for a mutex owned by another part of the program for a long period, but the following profile type is more useful for that.
Contention-intensive Code
The Contention profile type identifies the most "wanted" locks in the program. This profile type is available for Go programs but must be explicitly enabled by specifying "MutexProfiling: true" in the agent configuration code. The collection works by recording (under the "Contentions" metric) the number of times when a specific lock, when being unlocked by a goroutine A, had another goroutine B waiting for the lock to be unlocked. It also records (under the "Delay" metric) the time the blocked goroutine waited for the lock. In this example, there is a single contention stack and the total wait time for the lock was 11.03 seconds:

The code that generates this profile consists of 4 goroutines fighting over a mutex:
main.go
func contention(d time.Duration) {
        contentionImpl(d)
}

func contentionImpl(d time.Duration) {
        for {
                mu.Lock()
                time.Sleep(d)
                mu.Unlock()
        }
}
...
func main() {
        ...
        for i := 0; i < 4; i++ {
                go contention(time.Duration(i) * 50 * time.Millisecond)
        }
}
In this lab, you learned how a Go program can be configured for use with Stackdriver Profiler. You also learned how to collect, view and analyze the performance data with this tool. You can now apply your new skill to the real services you run on Google Cloud Platform.
You learned how to configure and use Stackdriver Profiler!
Learn More
- Stackdriver Profiler: https://cloud.google.com/profiler/
- Go runtime/pprof package that Stackdriver Profiler uses: https://golang.org/pkg/runtime/pprof/
License
This work is licensed under a Creative Commons Attribution 2.0 Generic License.