
In this codelab, you'll learn how to get started using Stackdriver to monitor and review performance metrics and logs for Google Cloud Platform services and VMs.
In this codelab you will
- Familiarize yourself with the Stackdriver homepage.
- Understand dashboards and charts.
- Create an uptime check.
- Create a simple alert policy.
- Work with alert incidents.
- Navigate the Logs Viewer.
What is your experience with Stackdriver?
Self-paced environment setup
If you don't already have a Google Account (Gmail or Google Apps), you must create one.
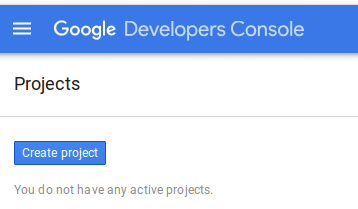
Sign-in to Google Cloud Platform console (console.developers.google.com) and create a new project:
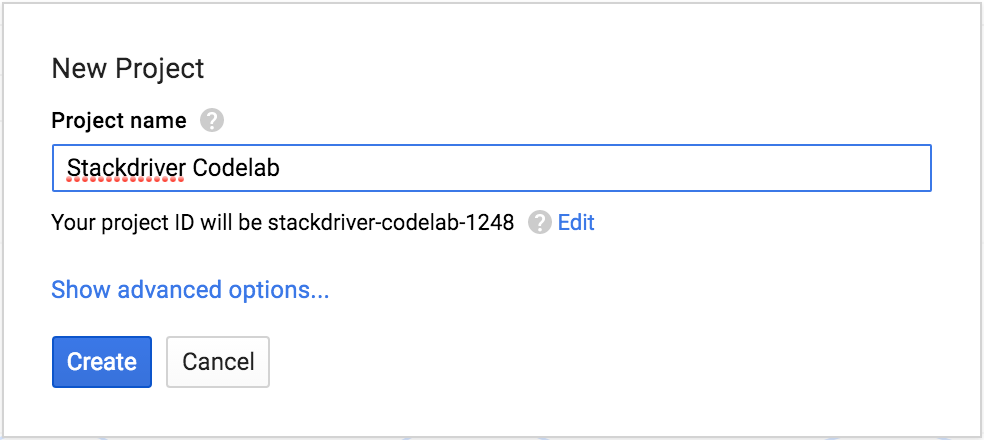
Remember the project ID, a unique name across all Google Cloud projects. It will be referred to later in this codelab as PROJECT_ID.
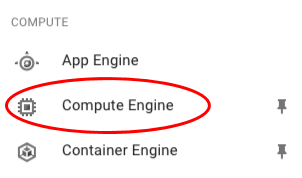
Very Important - Visit the Compute Engine page in order to kick off enabling the Compute Engine API:
And then: Compute → Compute Engine → VM Instances
The first time you do this, you will see a screen with a message "Compute Engine is getting ready. This may take a minute or more". You can continue logging into the Google Cloud Shell below, but you can not create VMs until this operation completes.
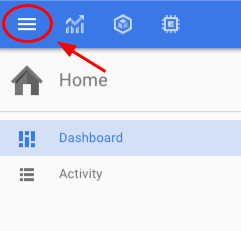
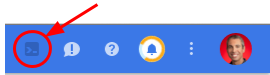
You will do most of the work from the Google Cloud Shell, a command line environment running in the Cloud. This Debian-based virtual machine is loaded with all the development tools you'll need and offers a persistent 5GB home directory. Open the Google Cloud Shell by clicking on the icon on the top right of the screen:
Finally, using Cloud Shell, set the default zone and project configuration:
$ gcloud config set compute/zone us-central1-b
$ gcloud config set compute/region us-central
You can pick and choose different zones too. Learn more about zones in Regions & Zones documentation.
In this section, you'll create Compute Engine instances running nginx+ using Cloud Launcher. We'll need these instances to demonstrate monitoring and alerting. You can create a Compute Engine instance from the graphical console or from the command line. This lab will walk you through the command lines.
Now let's start.
Use gcloud to set your project ID:
$ gcloud config set project PROJECT_ID
Next, make sure to copy & paste this as is:
$ for i in {1..3}; do \
gcloud compute instances create "nginx-plus-$i" \
--machine-type "n1-standard-1" \
--metadata  "google-cloud-marketplace-solution-key=nginx-public:nginx-plus" \
--maintenance-policy "MIGRATE" --scopes default="https://www.googleapis.com/auth/cloud-platform" \
--tags "http-server","google-cloud-marketplace" \
--image "https://www.googleapis.com/compute/v1/projects/nginx-public/global/images/nginx-plus-ubuntu1404-v20150916-final" \
--boot-disk-size "10" --boot-disk-type "pd-standard" \
--boot-disk-device-name "nginx-plus-$i"; done
You will see warning messages about disk size, and then the following output as each VM is created:
NAME         ZONE          MACHINE_TYPE  PREEMPTIBLE INTERNAL_IP EXTERNAL_IP     STATUS
nginx-plus-1 us-central1-b n1-standard-2                X.X.X.X  X.X.X.X      RUNNING
...
Note down the EXTERNAL_IP - that's important later on.
These operations might take a few minutes to complete.
By default, Google Cloud Platform only allows few port accesses. Since we'll be accessing Nginx soon - let's enable port 80 in the firewall configuration:
$ gcloud compute firewall-rules create allow-80 --allow tcp:80 --target-tags "http-server"
Created [...].
NAME     NETWORK SRC_RANGES RULES  SRC_TAGS TARGET_TAGS
allow-80 default 0.0.0.0/0  tcp:80 http-server
This will create a firewall rule named allow-80 that has the following default values:
- The list of IP address blocks that are allowed to make inbound connections (
--source-ranges) are set to0.0.0.0/0(Everywhere). - The list of instance tags indicating the set of instances on the network which may accept inbound connections is set to none which means the firewall rule is applicable to all instances.
Run gcloud compute firewall-rules create --help to see all the defaults.
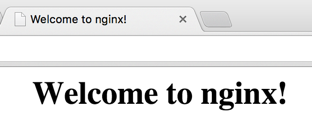
After the first instance is created, you can test whether nginx is running and accessible by navigating to http://EXTERNAL_IP/ where EXTERNAL_IP is the public IP of nginx-plus-1 and you should be able to see the Nginx page:
You can also see your running instances by typing:
$ gcloud compute instances list
Google Stackdriver is a powerful monitoring solution that integrates various tools to facilitate monitoring and analyzing your cloud powered applications. You can use Stackdriver to view performance metrics, set and receive alerts, add your own custom dashboards and metrics, view logs and traces, setup integrated dashboards - all from a central place.
The next steps will take you through enabling Stackdriver and working with the console.
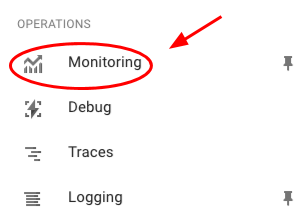
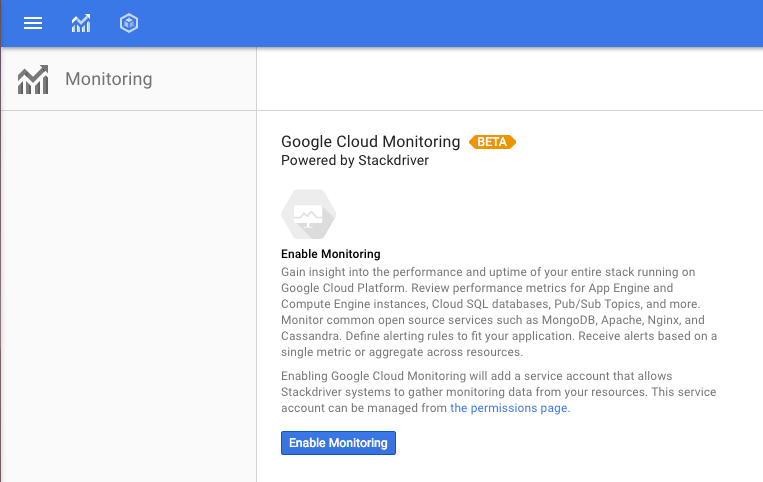
By default, Google Stackdriver is currently in Beta and is not enabled for new projects. To enable it, go to the left navbar and click on "Monitoring" (you might have to scroll down to find it)
In the next screen, click "Enable Monitoring" and wait a minute to have it enabled.
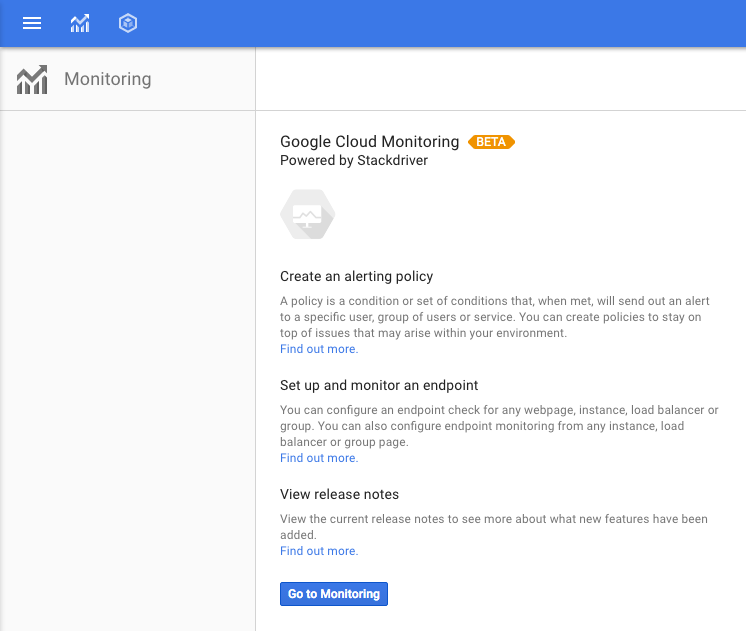
Once it's enabled, content will change and you will see the text below. Click "Go to Monitoring" to start exploring! You will need to login with Google and then be taken to the Stackdriver console for your project - this is where you will perform and analyze monitoring-related tasks.
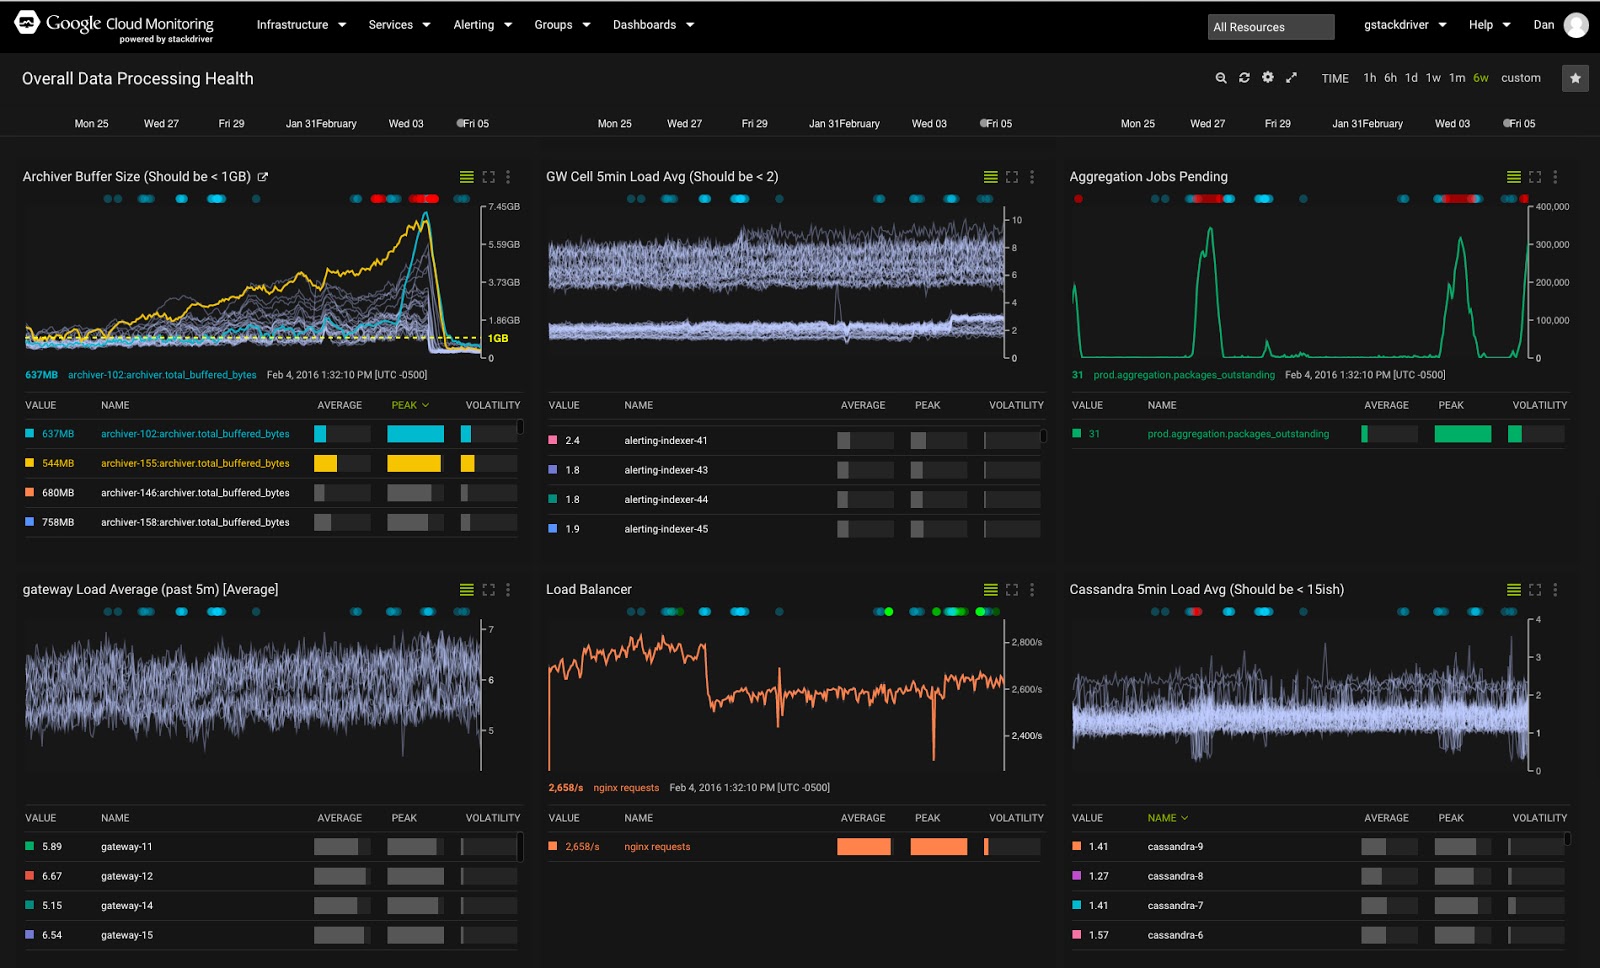
Let's familiarize ourselves with the homepage.
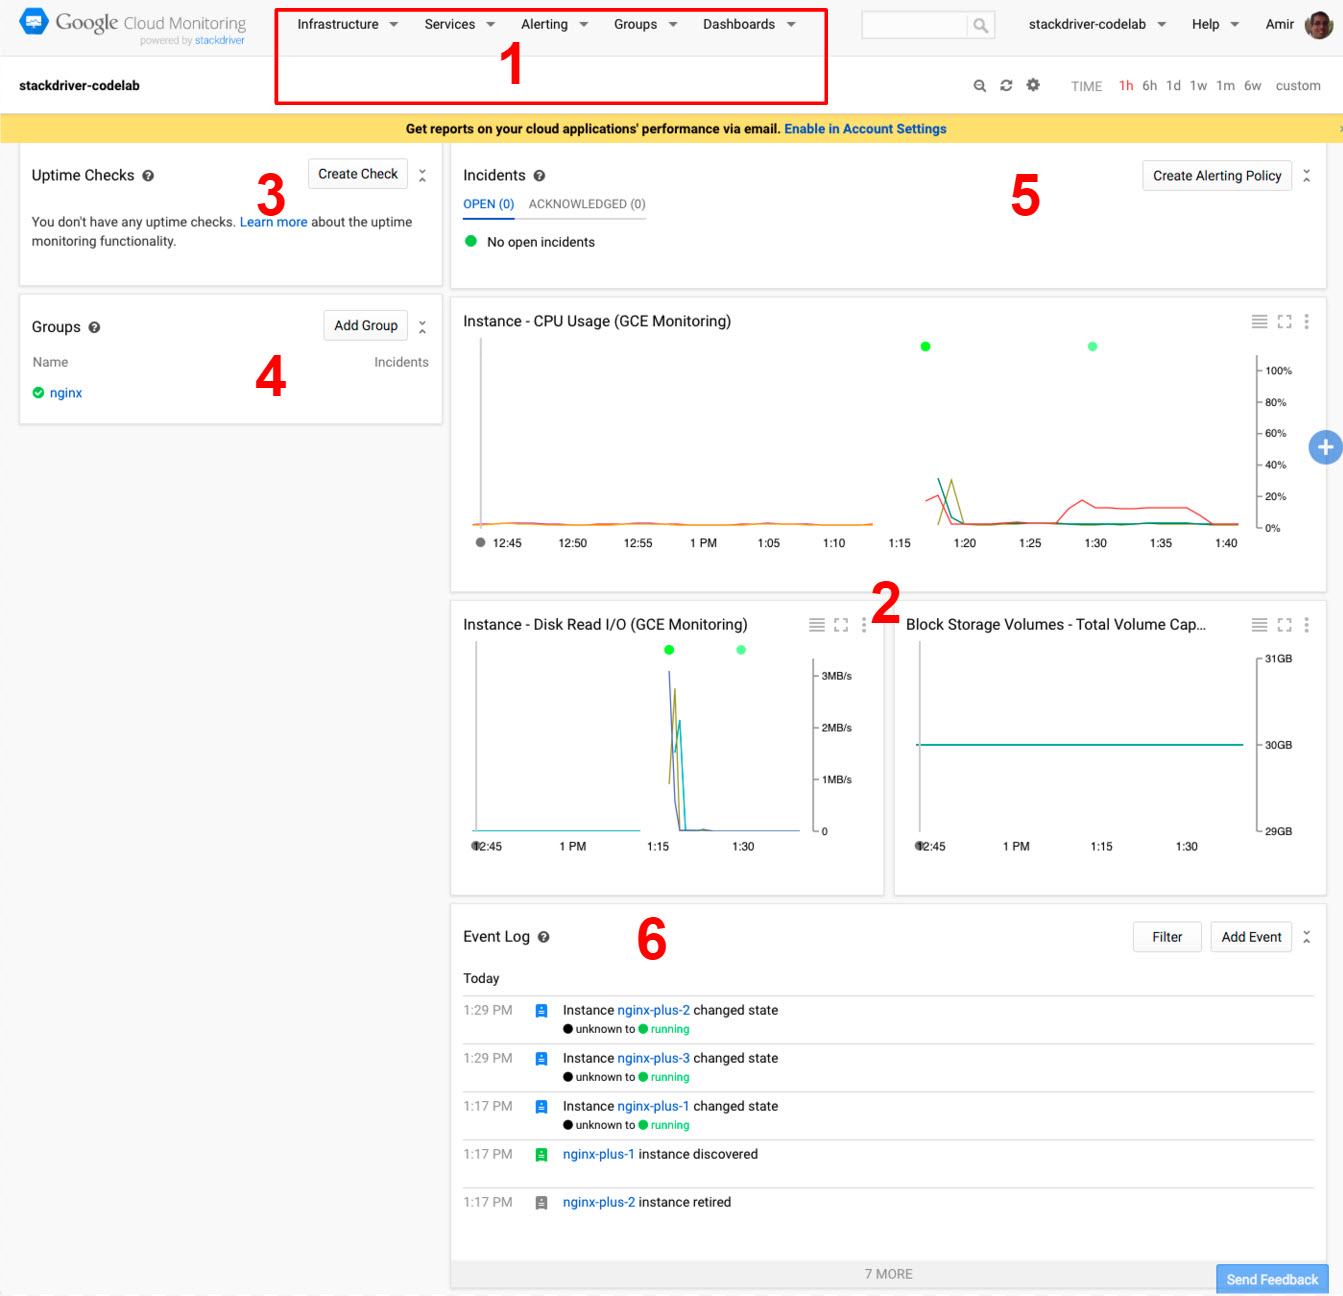
- The top menu: use to select different views / contexts, and access all available Stackdriver actions.
- Dashboards: these are dashboards of metrics and events being monitored. Initially these are pre-defined system dashboards based on the resources in your project, but you can also compose your own custom dashboards.
- Uptime checks: these periodically check user-facing resources for availability, and enable alerting when these become unavailable.
- Groups list: groups are used to group together resources that share properties and characteristics so that they can be handled as a group or cluster for tasks such as monitoring and alerting. These can be auto-discovered as well as user-defined.
- Incidents pane: the incidents pane tracks alerting incidents. You won't see anything here until you define alerting policies.
- The Event Log: lists events that are related to your monitored resources, for example instance changes, incident events, etc.
Before we examine the charts, you'll notice that most lines have flattened after the initial instance initialization. Let's see if we can "un-flatten" some of them by generating some load on one of the instances.
To SSH into the instance from the Cloud Shell command line:
$ gcloud compute ssh nginx-plus-1
...
Do you want to continue (Y/n)? Y
...
Generating public/private rsa key pair.
Enter passphrase (empty for no passphrase): [Hit Enter]
Enter same passphrase again: [Hit Enter]
...

yourusername@nginx-plus-1:~$
That's it! pretty easy. (In production, make sure you enter a passphrase :) Also, note that you may not be prompted to add a passphrase.
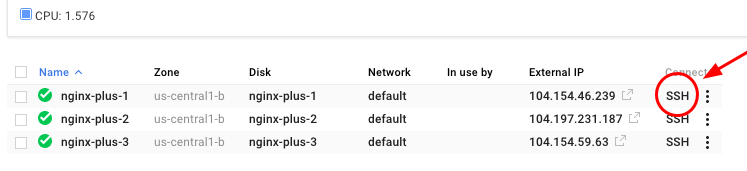
Alternatively, you can also SSH into the instance directly from the console, by navigating to Compute Engine > VM Instances, and clicking on SSH.
In the SSH window, type:
yourusername@nginx-plus-1:~$ sudo apt-get install rand
yourusername@nginx-plus-1:~$ for i in {1..10}; do dd if=/dev/zero of=/dev/null count=$(rand -M 80)M; sleep 60; done &
Now instance nginx-plus-1 CPU is being loaded. We can go back to the Stackdriver dashboard tab and start exploring, but before we go back to the Stackdriver dashboards page, let's take the opportunity to install the Cloud Logging agent.
Fetch and install the script:
yourusername@nginx-plus-1:~$ curl -sS https://dl.google.com/cloudagents/add-logging-agent-repo.sh | sudo bash /dev/stdin --also-install
Note that when installing in production, make sure to check the SHA-256 hash. You can get more information on the installation process here.
Now it's time to go back to the Google Stackdriver console.
Take the time to familiarize yourself with navigating and using dashboards and charts. Use the mouse to hover over chart lines and see what happens. Change time duration for charts (controls are at the upper right corner). You can always go back to the "homepage" view by clicking the Stackdriver logo at the upper left corner of the console.
Let's look at the CPU utilization chart:
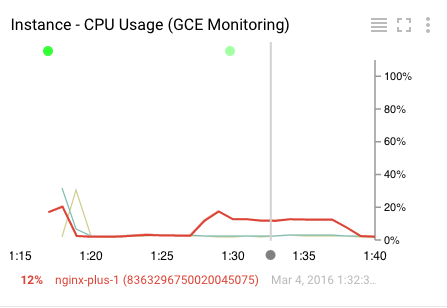
Some elements in the chart are:
- The highlighted line is the currently selected metric (a chart can display multiple metrics).
- The gray horizontal line represents the point in time that the mouse hover is pointing to.
- At the bottom is the name of the resource, along with the value at the point in time selected.
- At the top of the chart are colored dots representing events that are detailed in the Event Log. You can click on these to get a list of events. Note: you might not be seeing any if you don't have any events yet.
- At the top right of the chart are three controls (from left to right):
- Toggle hide/show a list of metrics below the chart
- Toggle fullscreen mode
- Menu with various goodies (you MUST try X-ray mode once you have a very verbose chart!). Note the "View Logs" option - we'll get to that later.
Uptime checks let you quickly verify the health of any web page, instance, or group of resources. Each configured check is regularly contacted from a variety of locations around the world. Uptime checks can be used as conditions in alerting policy definitions.
You can display your checks and their status by selecting Alerting > Uptime Checks on the top menu. You'll also find Uptime Checks sections on the Google Stackdriver dashboard and on pages devoted to specific resources. For uptime checks that cover a group of resources, you can expand the check to show the status of the individual members of the group.
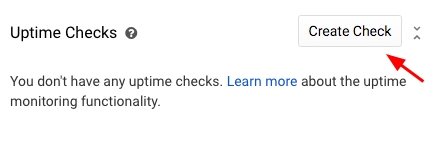
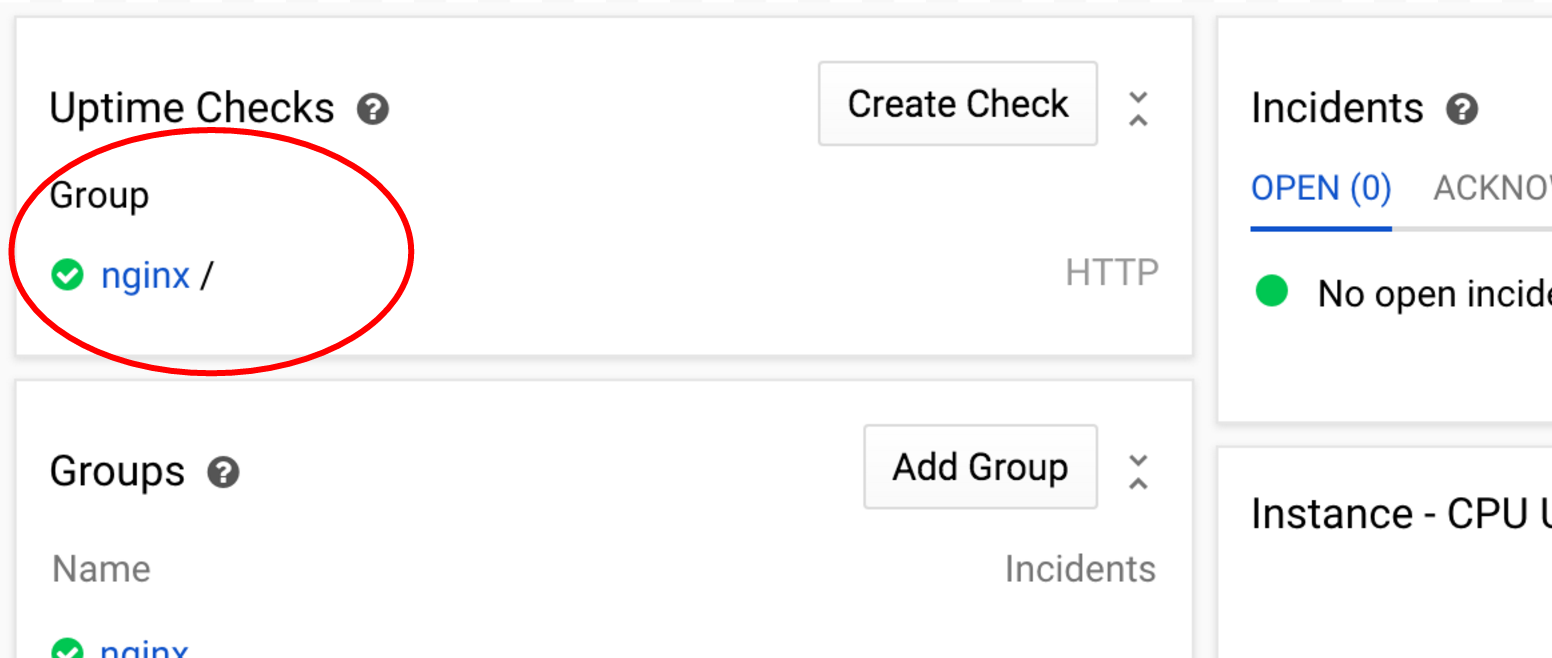
Let's create an uptime check. Find the uptime checks widget in the Stackdriver homescreen:
A new popup will appear. We can configure uptime checks for a single resource or group of resources, utilize custom headers and payloads, add authentication and other options. For now, we'll just use a default http check that will check the auto-created nginx group every 1 minute.
Use the screenshot below to fill out the different options:
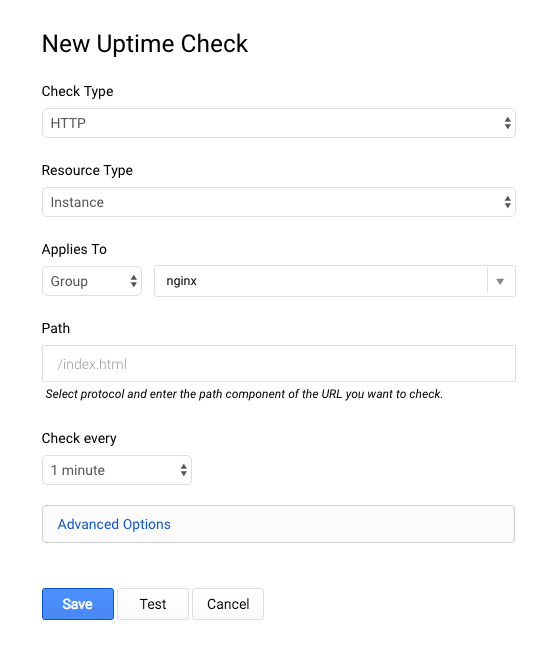
Click on "Test" button to make sure your endpoints are reachable (you should get 3 green okays), and click on Save. Note: if you don't get okays back, you can still progress with the lab as it might just be a test-check timing issue.
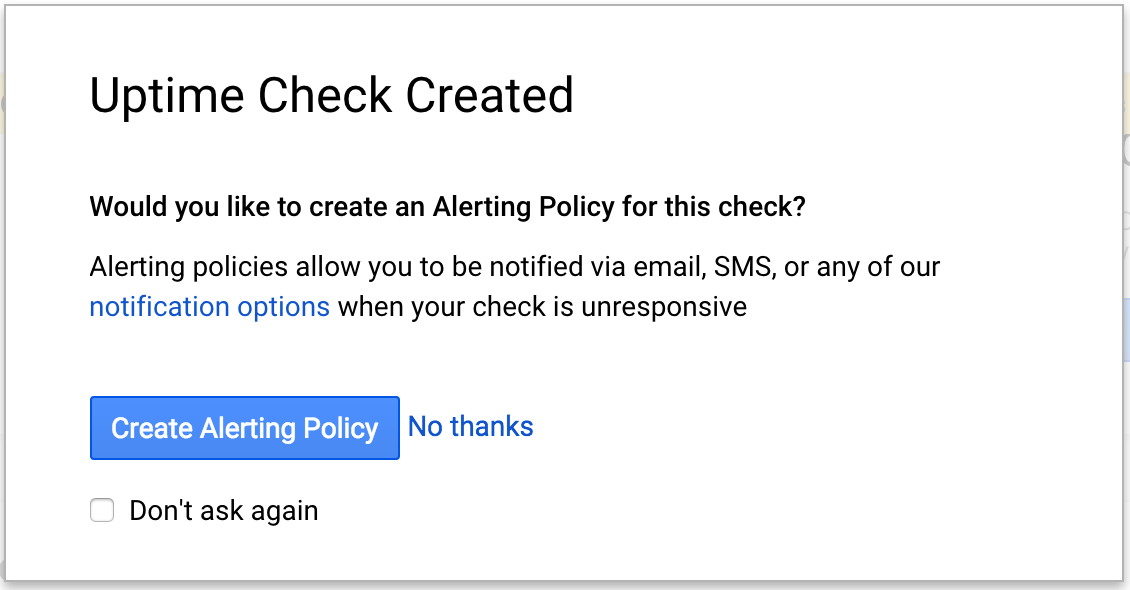
Next you'll get an "Uptime Check Created" box and be asked if you want to create an alerting policy for this check. Let's do that in the next section - don't click anything yet.
You can set up alerting policies to define conditions that determine whether or not your cloud services and platforms are operating normally. Cloud Monitoring provides many different kinds of metrics and health checks that you can use in the policies.
When an alerting policy's conditions are violated, an incident is created and displayed on the Stackdriver console in the Incident section. Responders can acknowledge receipt of the notification and can close the incident when it has been taken care of.
Click "Create Alerting Policy" and let's move on to configuring the policy.
Now you should be seeing this screen:
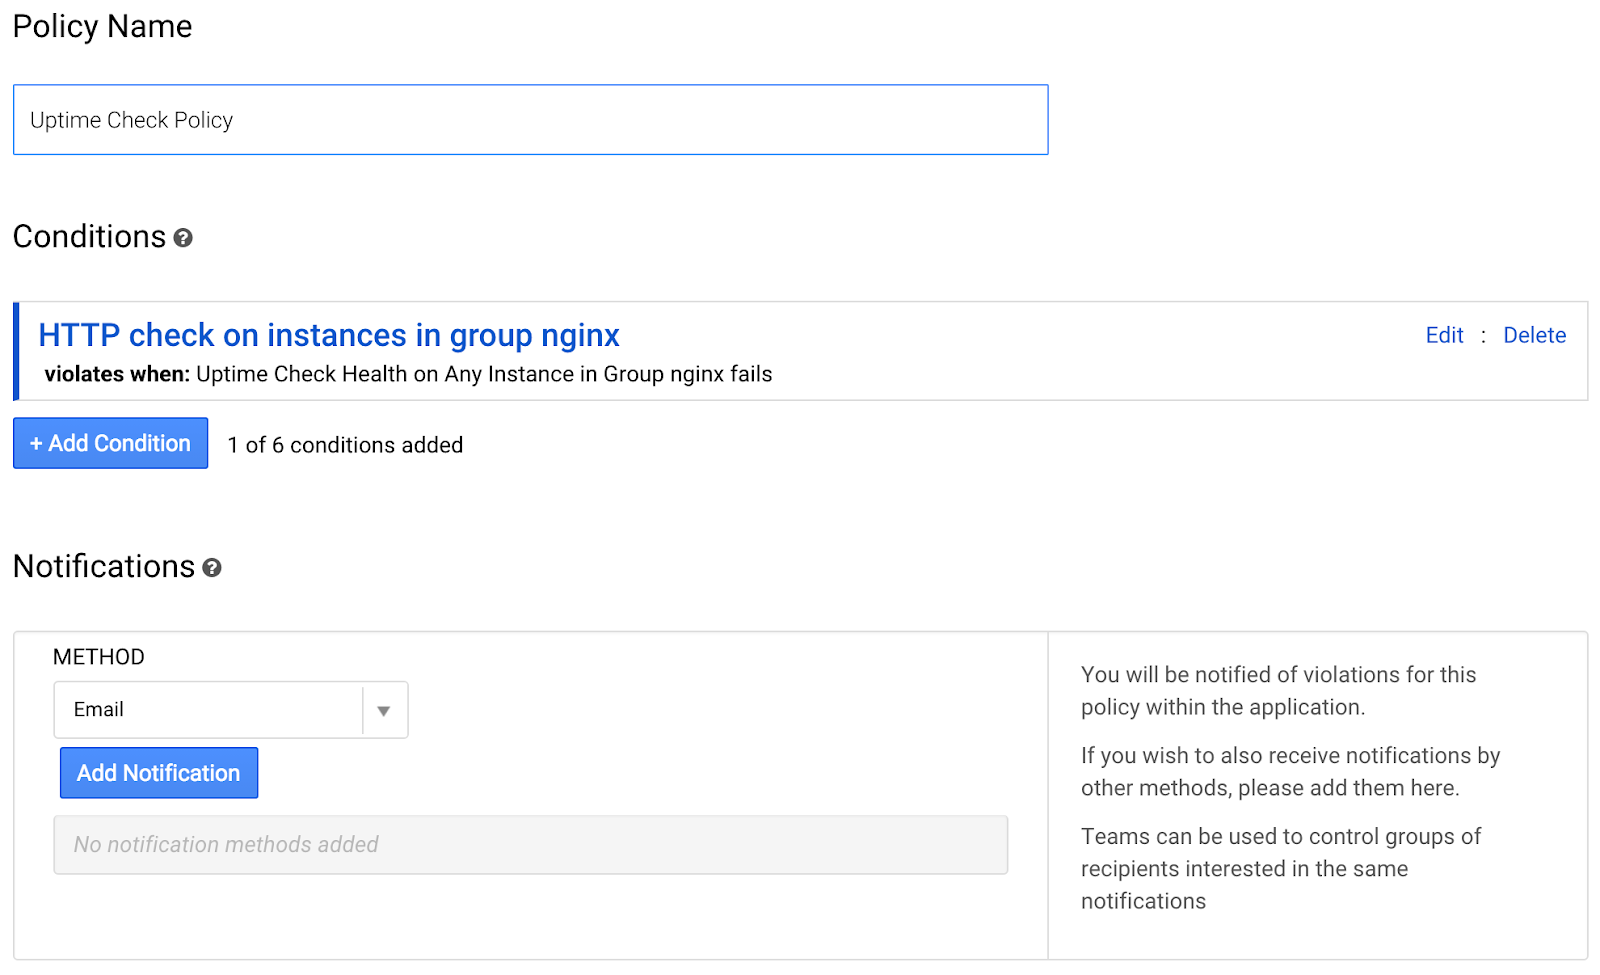
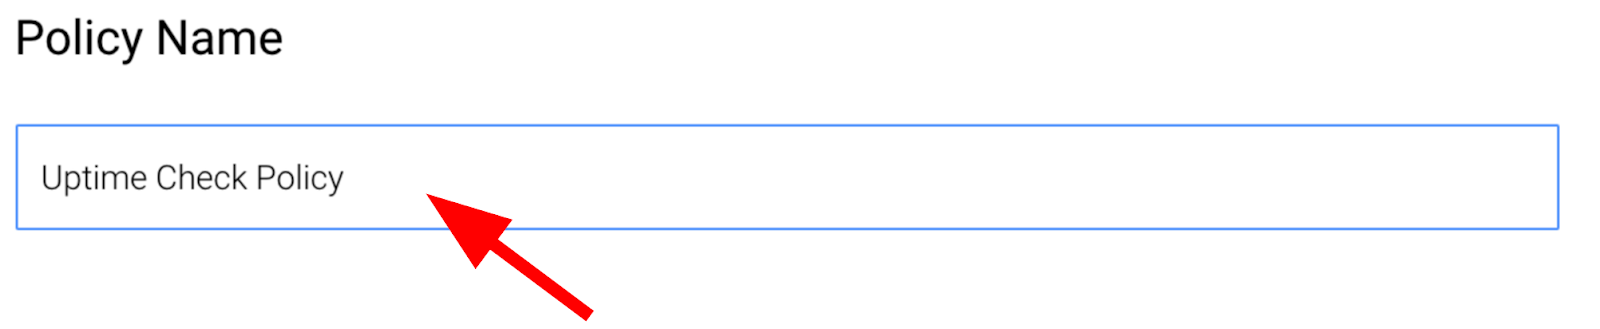
Enter a name for the policy: "Uptime Check for nginx group"
Now in the notification method section, click on "Add Notification"
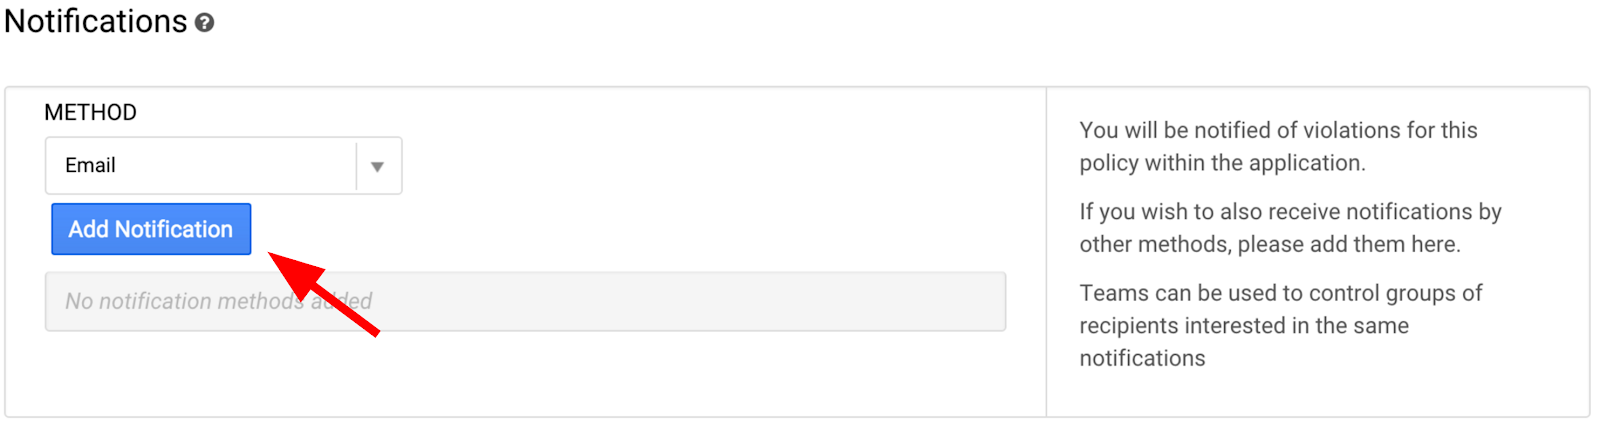
Enter the email address associated with your Google Cloud Account. Scroll to the bottom of the screen and click on "Save Policy".
Go back to the Stackdriver homepage (by clicking the logo in the upper left corner).
Now you should see the uptime check you've created in the uptime checks section of the dashboard. For now status should be green.
Scroll down to the Event Log and you should see the event that an alerting policy was created.
Now, let's create some trouble :)
Let's see what happens when we stop the Ngnix service.
SSH again into the instance from the Cloud Shell command line:
$ gcloud compute ssh nginx-plus-1
And type:
yourusername@nginx-plus-1:~$ sudo service nginx stop
Now the uptime check that we've created should fail. As a result, an incident will be created and an alert notification email will be sent to the address you've entered above. It will take a minute for the condition to be detected (remember the duration of 1 minute when setting the uptime check?), so let's go and examine the nginx group page.
There are several ways to navigate to a specific resource group's dashboard:
- You can click on the group's name in the homepage. This switches to a dashboard built specifically for monitoring the group's resources. You can also customize this dashboard.
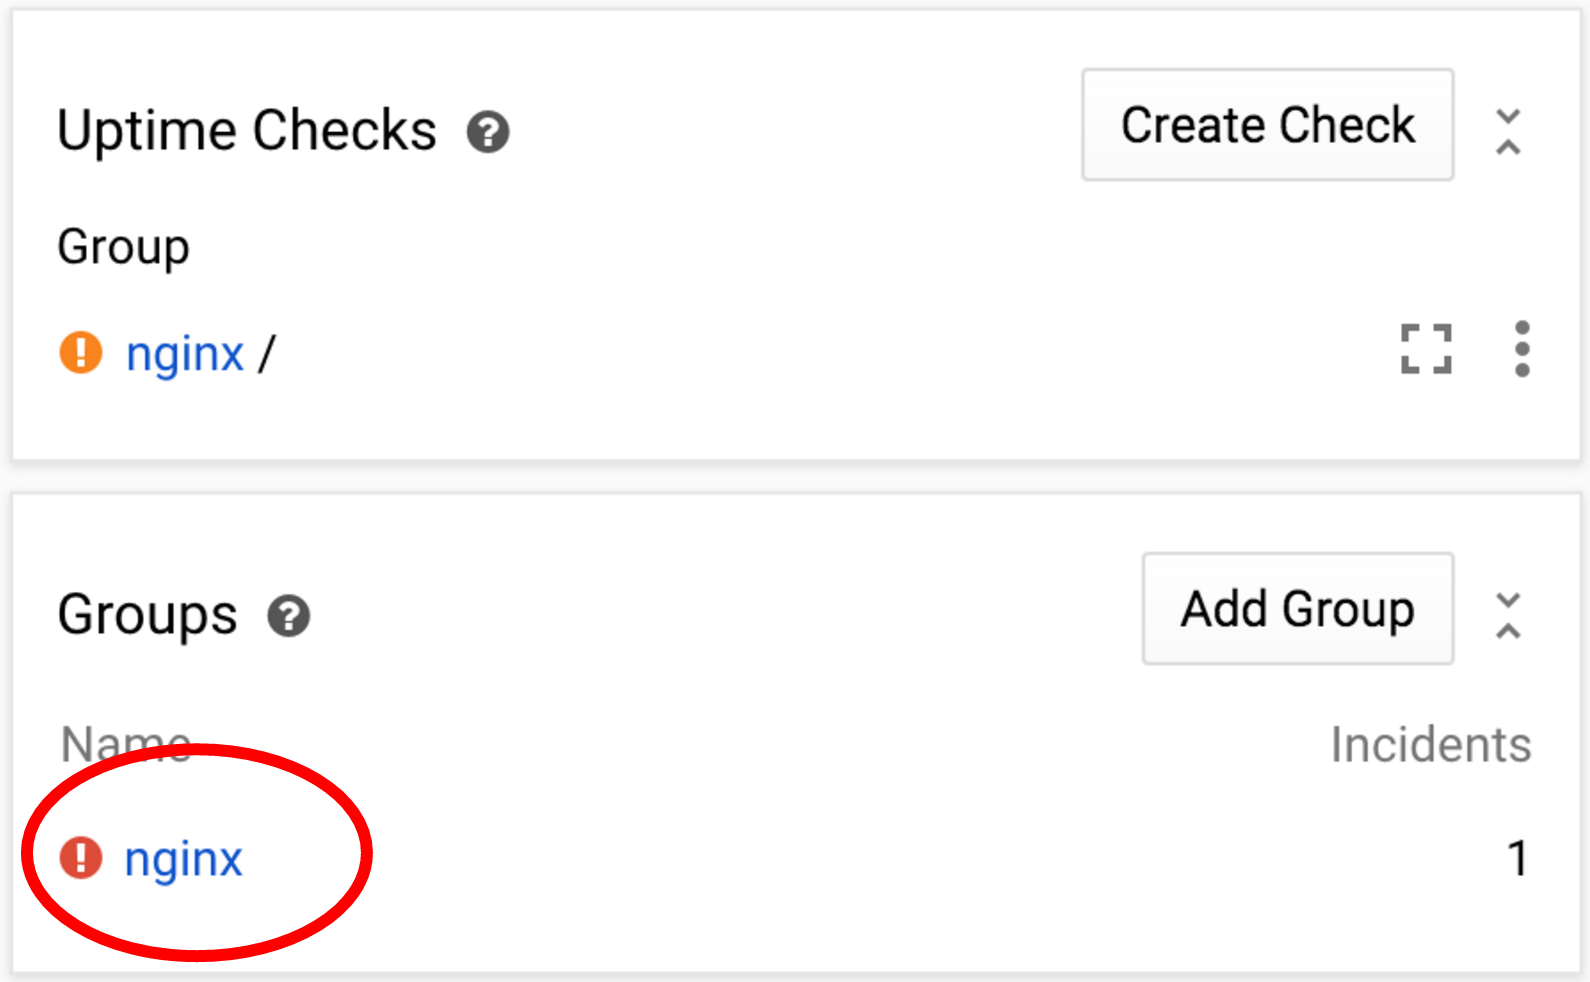
- From the top level menu, select Groups and then find your specific group.
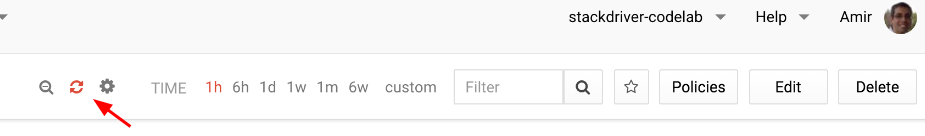
Now, click on the auto-refresh button to make sure dashboards are refreshed automatically. The icon will turn red.
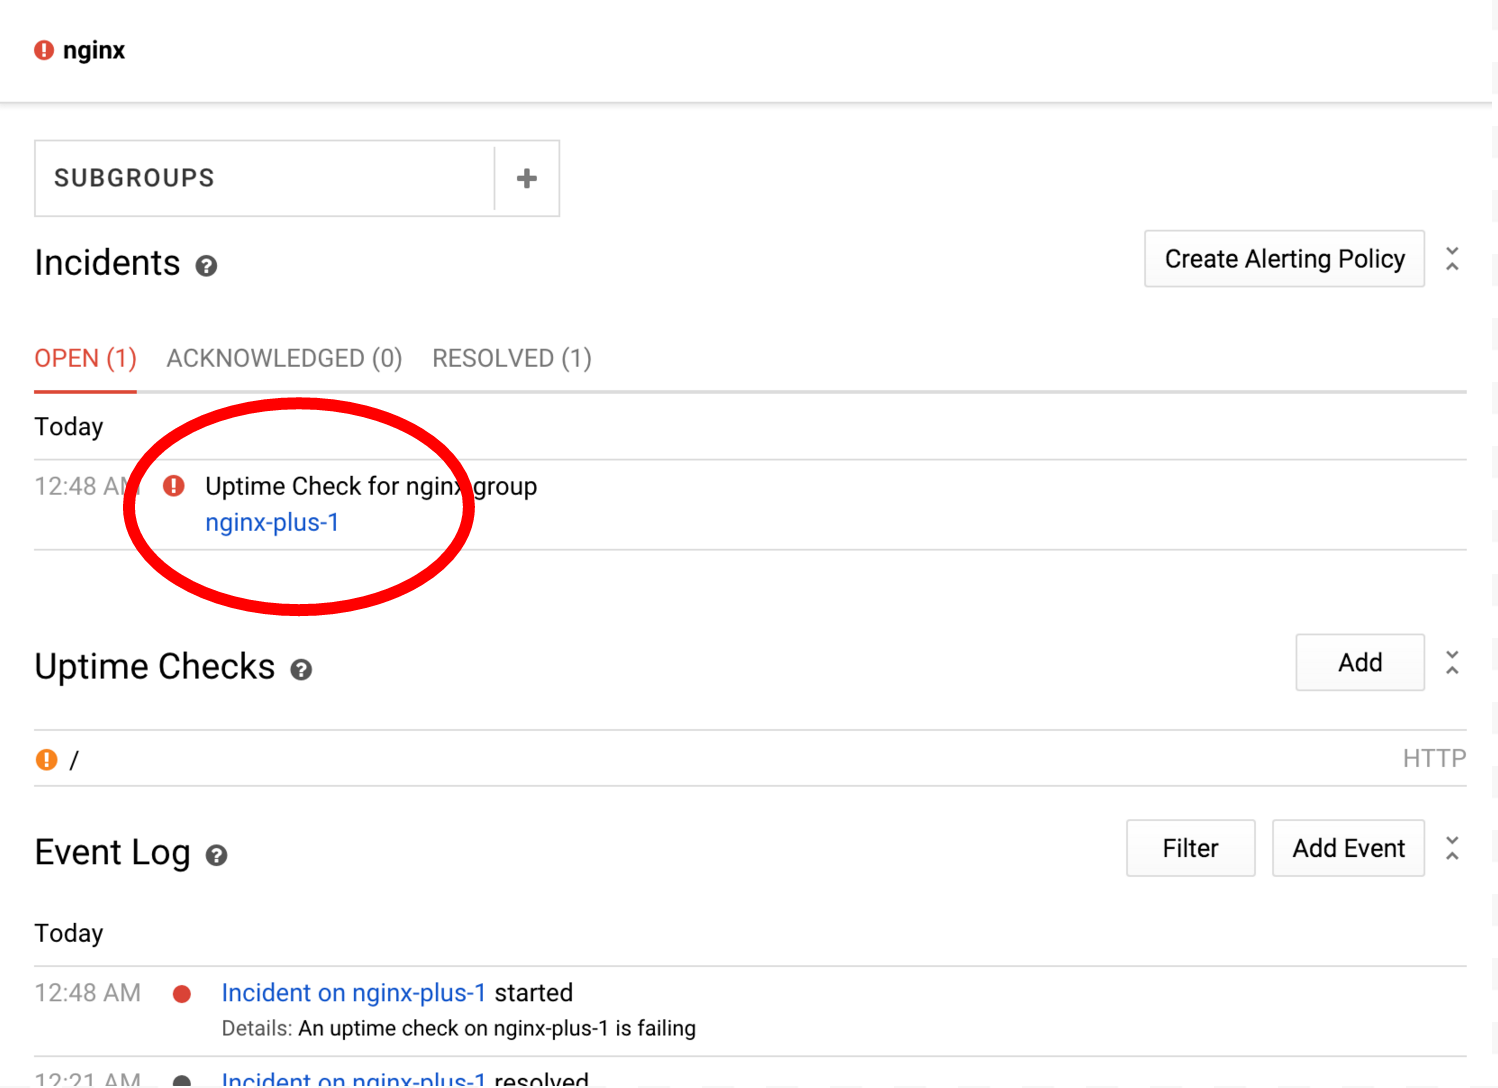
You're now looking at a dashboard that is specific to the auto-created nginx group. On the right hand side there are graphs of several key metrics pertaining to the group. In other words these graphs show metrics that relate to all resources in the nginx group (our 3 nginx+ VMs that we created earlier).
On the left side you see various information relating to the group:
- Incident status
- Uptime checks
- Event log
- A list of resources (instances, volumes, etc)
Note that these only relate to the group, and so the event log only lists events for the group.
You can click on different resources or sub-groups to transition to their own specific dashboards. For example, clicking on nginx-plus-1 will take you to a dashboard that consists only of metrics and checks relating to that instance. Try it now:
Stackdriver incidents are opened when a set of alerting conditions meets a certain criteria. In our case, we've set an alert for the nginx uptime check, which is currently failing on nginx-plus-1. Incidents help you track current conditions, as well as collaborate with other team members when working on issues.
Let's acknowledge the incident, letting other team members know we're investigating things:
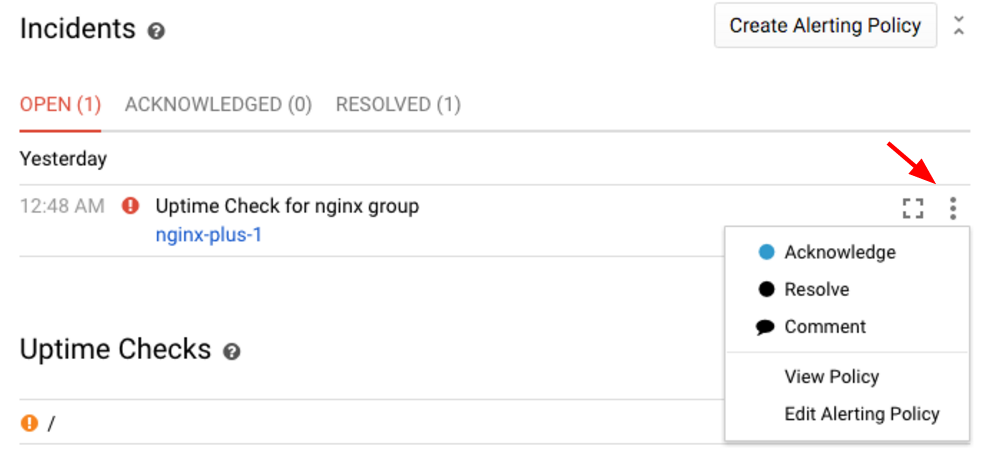
Note that this changes the state of the incident from Open to Acknowledged. The situation is still on-going (the alerting policy conditions are still violated), but you're signaling team members that you're on it. This will also be recorded in the event log.
Incidents can be manually resolved, or they can be auto-resolved. To see the latter, ssh into nginx-plus-1 and fix the problem:
yourusername@nginx-plus-1:~$ sudo service nginx start
Now the incident will be auto-resolved once the uptime check goes back to normal. You can also resolve it yourself by selecting the resolve menu item.
Cloud Logging is a logging-as-a-service solution that offers a convenient, central place to view and query logs from multiple sources. You can also use logs to export them to other destinations (Google Cloud Storage, Google BigQuery, or Google Cloud Pub/Sub).
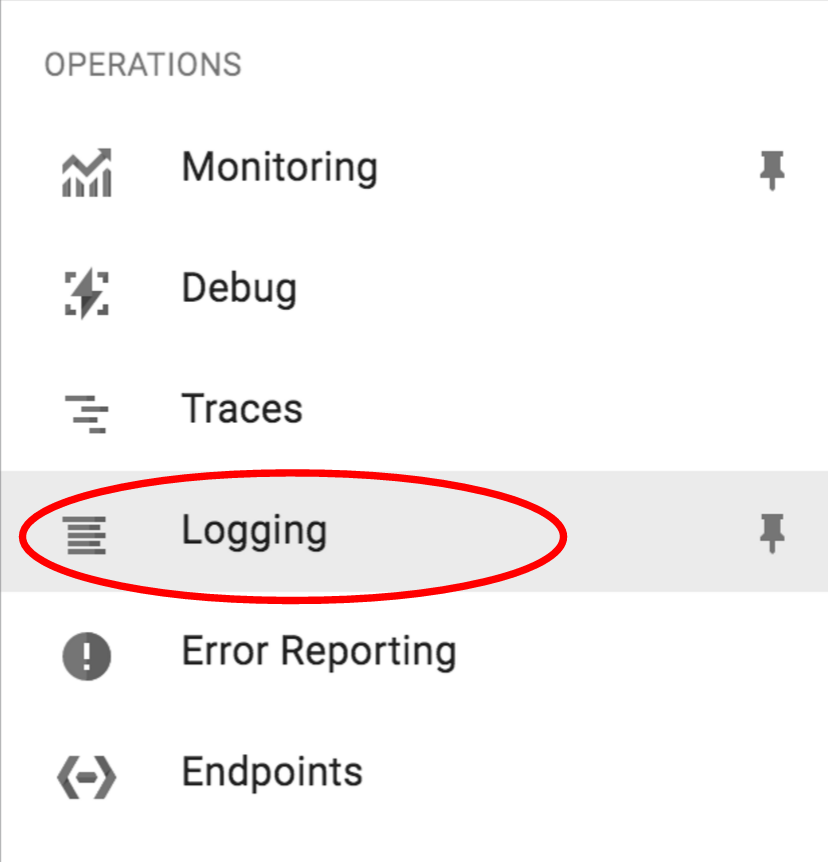
To access the Cloud Logs Viewer, choose it from the Cloud Console left hand menu:
You will be taken to the logs viewer, where you can user predefined queries or create and save your own custom queries, get a live stream of logs coming from multiple resources across your cloud deployment, create metrics from logs, export and much more.
There are some handy controls to quickly filter down to the relevant information:
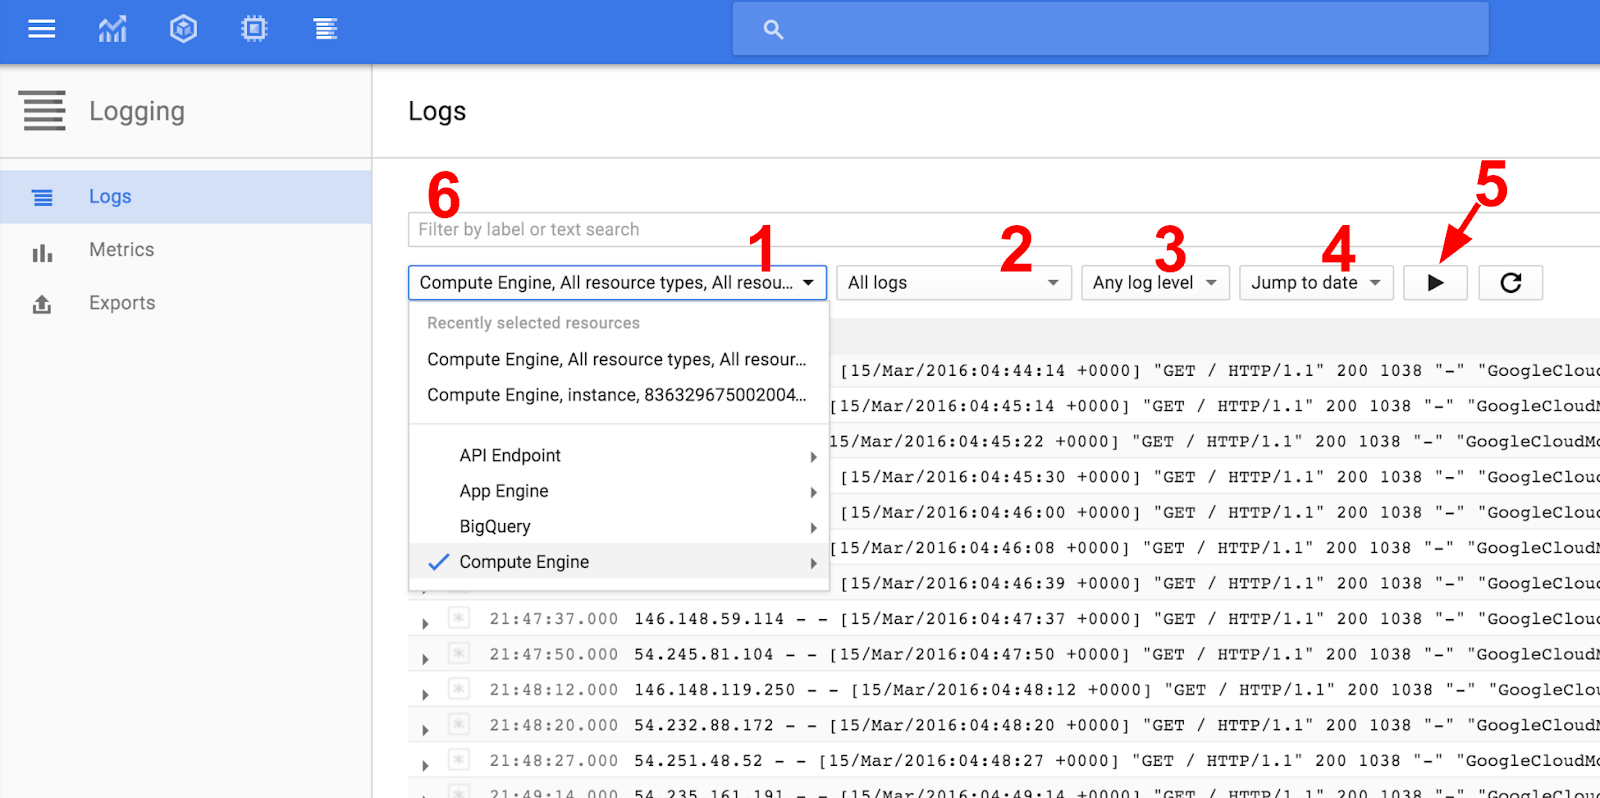
- Filter by resource types
- Filter to specific log types of the resources selected
- Filter specific log levels
- Filter to specific date(s) in order to examine past issues
- Toggle continuous streaming
- A search box for text, label, or regular expression search
Now let's practice narrowing down to specific logs.
From the resource type selector (1 in the screenshot) select Compute Engine -> All resource types
Next from the log-type selector (2 in the screenshot) select nginx-access to view all access logs
Now, toggle continuous streaming on (5) to watch logs as they come in. If you don't see any new logs, try entering the external IP address for one of the nginx-plus VMs in your browser.
While this codelab doesn't focus deeply on logs, feel free to explore later before cleaning up. You can find more info on navigating the viewer here. If you'd like broader information on what you can utilize Cloud Logging for, here is the top-level directory for the relevant documentation.
Let's release the compute resources created during the code lab. Run the following commands in the Cloud Shell:
$ for i in {1..3}; do \
gcloud -q --user-output-enabled=false compute instances delete nginx-plus-$i ; done
Next, go to the Google Stackdriver console ("Monitoring" from the Cloud Console left pane menu) and remove the uptime check and alerting policies we've created. You can do that from the top level menu items Alerting -> Policies overview and Alerting -> Uptime checks.
You are now ready to monitor your cloud-powered applications.
What we've covered
- Familiarizing yourself with the Stackdriver homepage.
- Understanding dashboards and charts.
- Creating an uptime check.
- Creating a simple alert policy.
- Working with alert incidents.
- Navigating the Logs Viewer.
Next Steps
- Try creating a custom dashboards.
- Explore the different options when creating an alerting policy.
- Explore the different options available when using Cloud Logging.
Learn More
- Learn more about using the monitoring API.
- Use custom metrics.
Give us your feedback
- Please take a moment to complete our very short survey