
This tutorial takes you through a tour of Google Stackdriver, which allows you to do the following with your Google Cloud Platform applications:
- Take a Debug Snapshot in your applications running on App Engine, Compute Engine and Container Engine.
- View Application Logs.
- Setup Metrics, Monitor them and get alerts.
- Trace your API calls and get a breakdown on response times and potential bottlenecks in your code.
- Add log points to a running application, without the need to deploy your app. This is a truly unique (and hopefully useful) feature.
In this tutorial, we are going to do the following from scratch:
- Create a Google Cloud Platform Project (App Engine specifically)
- Setup Google Cloud Platform Project Source Repository
- Utilize the standard Guestbook Python Application source available from Github
- Deploy the code
- See how we can get Debug snapshots of the running application
- Look at Logging and Application Call Traces
- Add logpoints to current running application. This feature was initially covered in this blog post : Add Application Logs to an application with no restarts
Let's get started.
This content was initially created by Romin Irani and posted here.
Self-paced environment setup
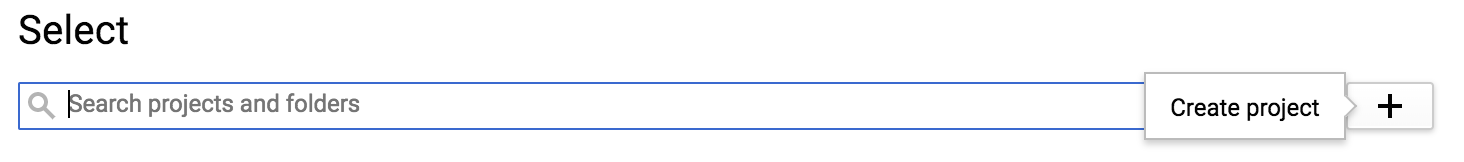
If you don't already have a Google Account (Gmail or Google Apps), you must create one. Sign-in to Google Cloud Platform console (console.cloud.google.com) and create a new project:

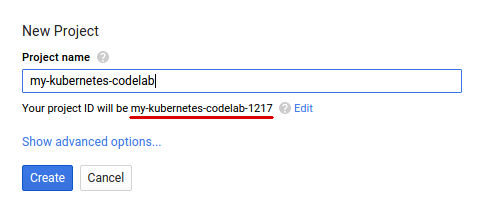
Remember the project ID, a unique name across all Google Cloud projects (the name above has already been taken and will not work for you, sorry!). It will be referred to later in this codelab as PROJECT_ID.
Next, you'll need to enable billing in the Cloud Console in order to use Google Cloud resources.
Running through this codelab shouldn't cost you more than a few dollars, but it could be more if you decide to use more resources or if you leave them running (see "cleanup" section at the end of this document).
New users of Google Cloud Platform are eligible for a $300 free trial.
Google Cloud Shell
In this codelab we will be using Google Cloud Shell, a command line environment running in the Cloud.
This Debian-based virtual machine is loaded with all the development tools you'll need. It offers a persistent 5GB home directory, and runs on the Google Cloud, greatly enhancing network performance and authentication. This means that all you will need for this codelab is a browser (yes, it works on a Chromebook).
To activate Google Cloud Shell, from the developer console simply click the button on the top right-hand side (it should only take a few moments to provision and connect to the environment):

Then accept the terms of service and click the "Start Cloud Shell" link:


Once connected to the cloud shell, you should see that you are already authenticated and that the project is already set to your PROJECT_ID :
gcloud auth list
Command output
Credentialed accounts:
 - <myaccount>@<mydomain>.com (active)
gcloud config list project
Command output
[core]
project = <PROJECT_ID>
If for some reason the project is not set, simply issue the following command :
gcloud config set project <PROJECT_ID>
Looking for your PROJECT_ID? Check out what ID you used in the setup steps or look it up in the console dashboard:

IMPORTANT: Finally, set the default zone and project configuration:
gcloud config set compute/zone us-central1-f
You can choose a variety of different zones. Learn more in the Regions & Zones documentation.
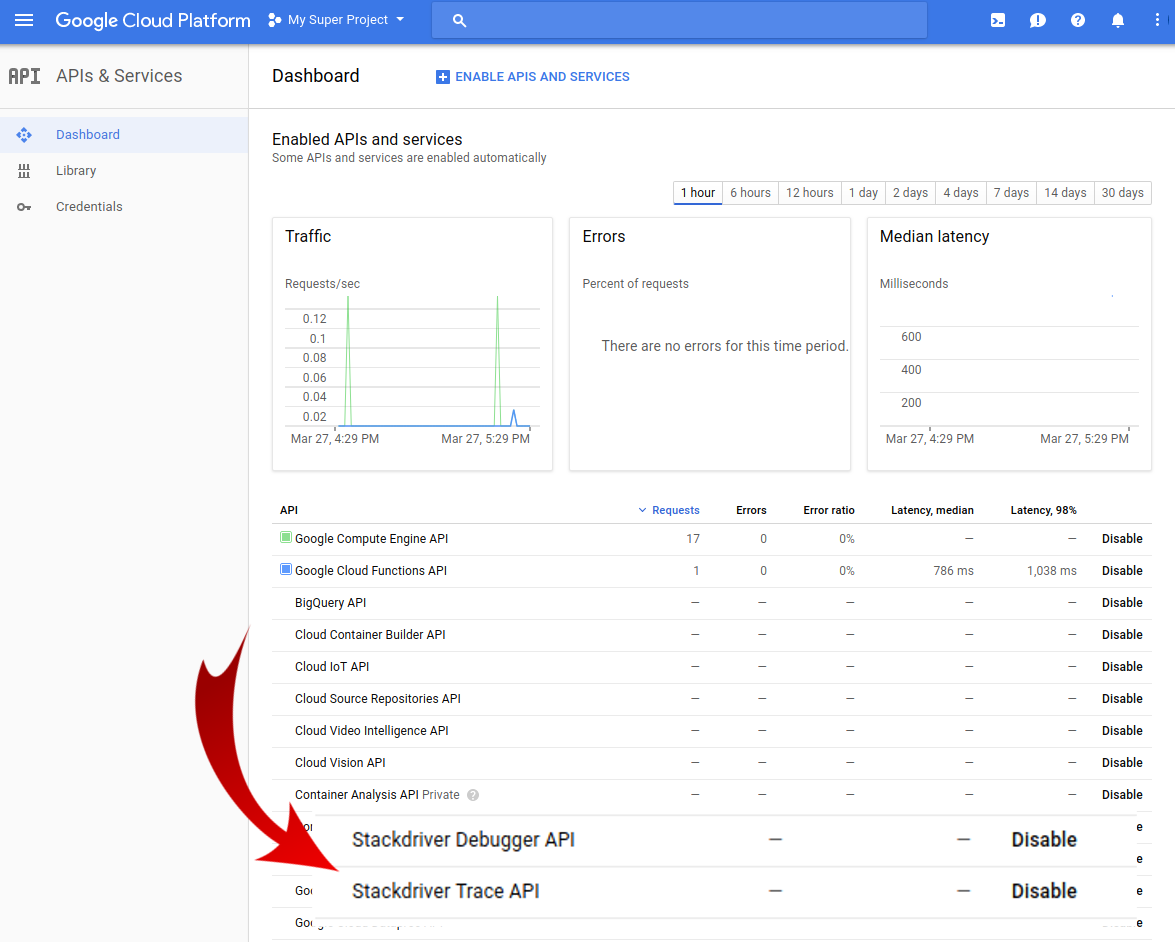
Check out the enabled StackDriver APIs
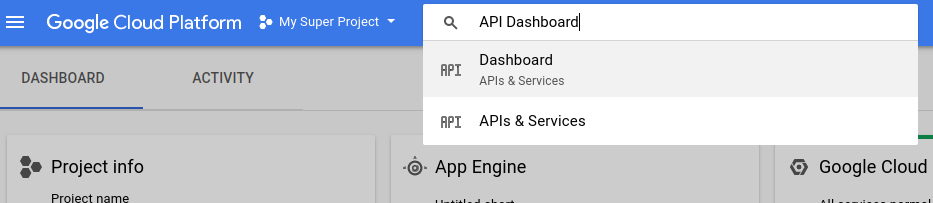
Let's take a look at the APIs that have been enabled for your project. Use the search bar to find the API Dashboard as shown below.
Observe the specific APIs that have been enabled for your project :
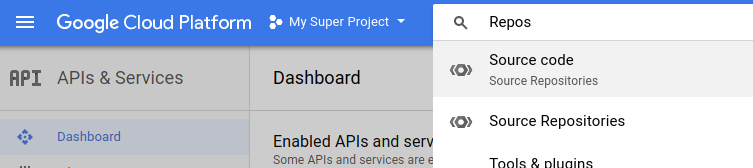
Every Google Cloud Platform projects offers private Git hosting but we first we need to create a default repository to work with. Navigate to the Source Repositories using the console search box :
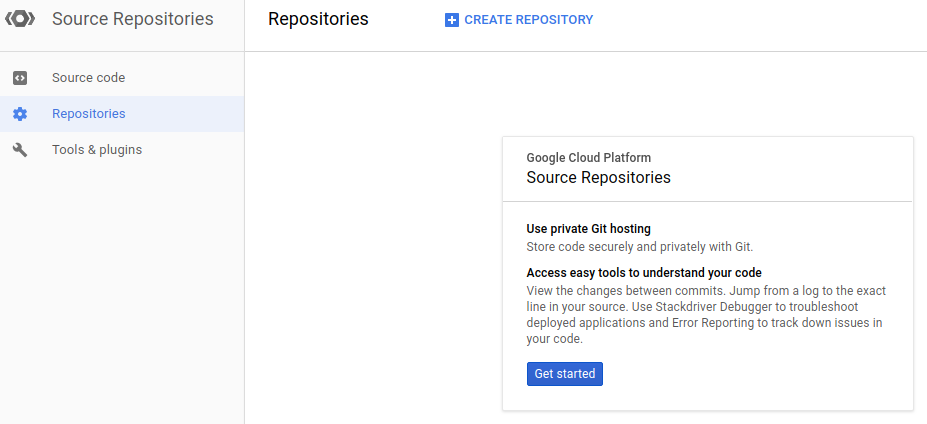
Click "CREATE REPOSITORY" to create a new code repository called "default" :


Using Cloud Shell, we are going to now clone this directory into our Google Cloud Shell instance. To do that, let us first create a directory in our Google Cloud Shell instance and navigate to that as shown below (sample output):
mkdir stackdriver-democd stackdriver-demo/Now, we can clone the default repository here via the gcloud command as shown below:
gcloud source repos clone default
This is the console output you should see :
Cloning into '/home/gcp123_student/default'...
warning: You appear to have cloned an empty repository.
Project [qwiklabs-gcp-1234abc1234] repository [default] was cloned to [/home/gcp123_student/default].
Great! Let us take a moment to dig a bit deeper into the git remotes that have been set up. This is not necessarily but just something so that you understand better what has happened behind the scenes.
Go the the default directory created and fire the git remote -v command as shown below
cd defaultgit remote -vThis is the console output you should see something similar to this:
origin https://source.developers.google.com/p/qwiklabs-gcp-1234abc1234/r/default (fetch)
origin https://source.developers.google.com/p/qwiklabs-gcp-1234abc1234/r/default (push)
You can see that this points correctly to the Git Repository that is associated with our GCP Project.
Pull the Guestbook application from Github
The application that we are going to use is a standard App Engine application named Guestbook and is available at the official Google Cloud Platform Github repository. This application is also part of the official documentation for getting started. The Github project is available at : https://github.com/GoogleCloudPlatform/appengine-guestbook-python
We are now going to pull this code into our Cloud Shell instance. The command and its output is shown here :
git pull https://github.com/GoogleCloudPlatform/appengine-guestbook-python
This is the console output you should see :
remote: Counting objects: 485, done.
remote: Total 485 (delta 0), reused 0 (delta 0), pack-reused 485
Receiving objects: 100% (485/485), 436.42 KiB | 163.00 KiB/s, done.
Resolving deltas: 100% (195/195), done.
From https://github.com/GoogleCloudPlatform/appengine-guestbook-python
* branch HEAD -> FETCH_HEAD
We have all the code now present locally in our Google Cloud Shell instance. You can see the various files that have been pulled from the Github project.
Push current code using Cloud Shell to the Project Git Repository
Now let's push this code into the GCP Project Git repository, so that we can set breakpoints, logpoints and more for our code. Note that this is not a mandatory step since you can integrate directly with Github, your local machine and other ways for linking up your source code.
But for our purpose here, we will push this code into the GCP Project Git Repository. This is done via the standard git push command as shown below:
git push origin master
This is the console output you should see :
Counting objects: 485, done.
Compressing objects: 100% (280/280), done.
Writing objects: 100% (485/485), 436.42 KiB | 0 bytes/s, done.
Total 485 (delta 195), reused 485 (delta 195)
remote: Storing objects: 100% (485/485), done.
remote: Processing commits: 100% (152/152), done.
To https://source.developers.google.com/p/qwiklabs-gcp-1234abc1234/r/default
* [new branch] master -> master
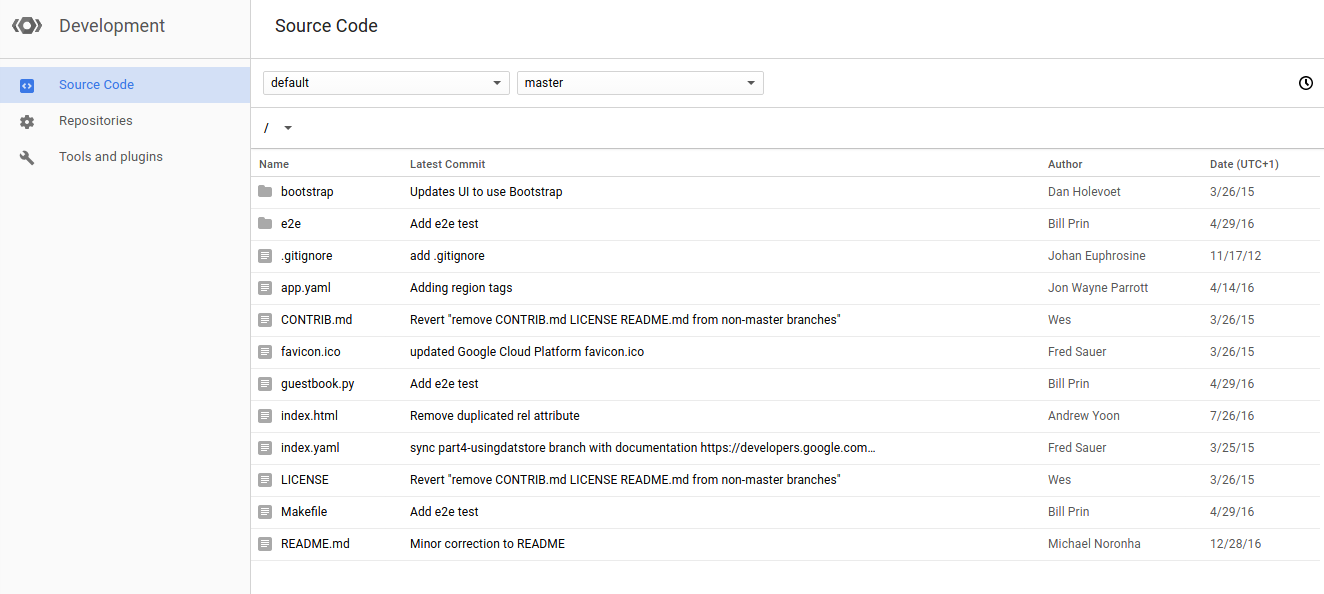
Now, go back to your GCP Cloud Console and specifically to the Development section. Click on Source Code and for the default repository, you should be able to see all the project files. The sample output is shown below:
We are all set now to deploy our Guestbook App Engine application. To deploy the app, ensure that you are in Google Cloud Shell and in the default directory as we have been all along. Use the gcloud app deploy command as shown below:
gcloud app deploy --version 1
When asked to choose a region, select [1] us-east1.
This is the console output you should see :
You are about to deploy the following services:
— qwiklabs-gcp-1234abc1234/default/1 (from [/home/gcp123-student/default/app.yaml])
Deployed URL: [https://qwiklabs-gcp-1234abc1234.appspot.com]
Do you want to continue (Y/n)? Y
Beginning deployment of service [default]...
File upload done.
Updating service [default]...done.
Deployed service [default] to https://qwiklabs-gcp-1234abc1234.appspot.com]
Note that we provided a version parameter to the app deploy command. We gave it a value of "1".
Since the Guestbook application uses Google Cloud Datastore for persistence, we need to update the Datastore indexes. The indexes are specified in the index.yaml file and we simply use the gcloud datastore create-indexes command as shown below:
gcloud datastore create-indexes index.yaml
This is the console output you should see :
You are about to update the following configurations:
— qwiklabs-gcp-1234abc1234/index From: [/home/gcp123_student/default/index.yaml]
Do you want to continue (Y/n)? Y
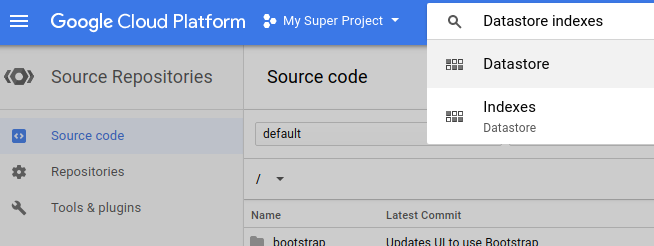
The Datastore indexes may take a while to update. To check on the status, search for "Datastore indexes" and click on Indexes. While the indexes are getting built, you will see a Status with a value of "Indexing" as shown below:

We can check if our App with Version 1 is deployed and available by going to Compute → App Engine and then clicking on Versions as shown below:
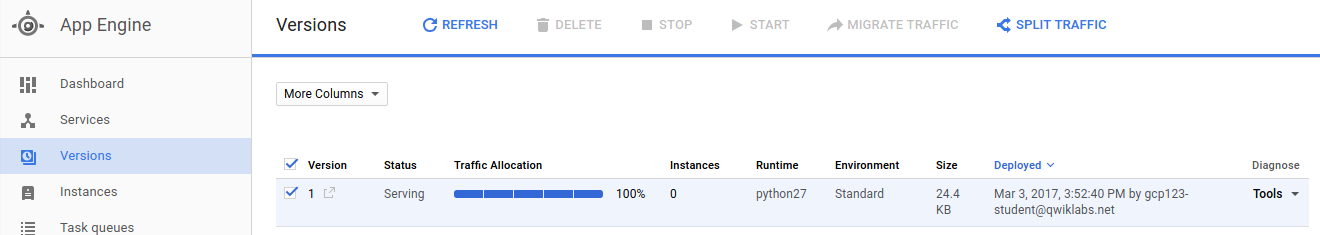
Everything should now look good now and you can take a look at your project by going to https://<PROJECT_ID>.appspot.com. Again, it may take a few short minutes for the datastore indexes to be ready, so if the application gives you an error (for instance: Internal Server Error), try again a few minutes later.
Let's now use application by logging in and creating a few guestbook entries as shown below:
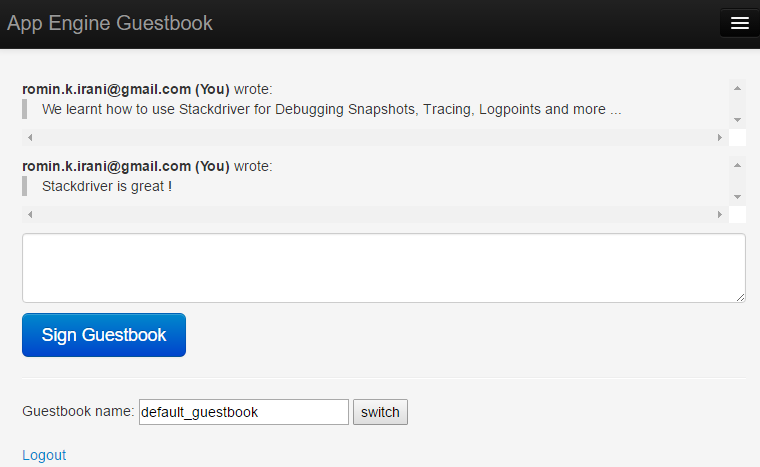
Great! We are all set now to dive into the Stackdriver features.
Let us first look at how we can take snapshots of our running application. The Snapshots are useful if you wish to debug a particular piece of code, inspect the variables and more. All this happens while your application is still being served. This is very helpful in case you are getting reports of an issue with your application and you want to try to debug and see what is going on with your app, inspect a bunch of variables, conditionally take the snapshot and more.
Let's do that now for the Guestbook application. We are going to ask for a snapshot if anyone requests the home page and specifically we want it where it retrieves the list of greetings that are currently there in the Datastore.
The code for this is present in the guestbook.py file. And specifically, we are interested to start inspecting the code at runtime once it has retrieved the list of greetings from the datastore. This is done on Line #72. So we can just put a breakpoint on Line 74, so that we know that #72 would have got executed.
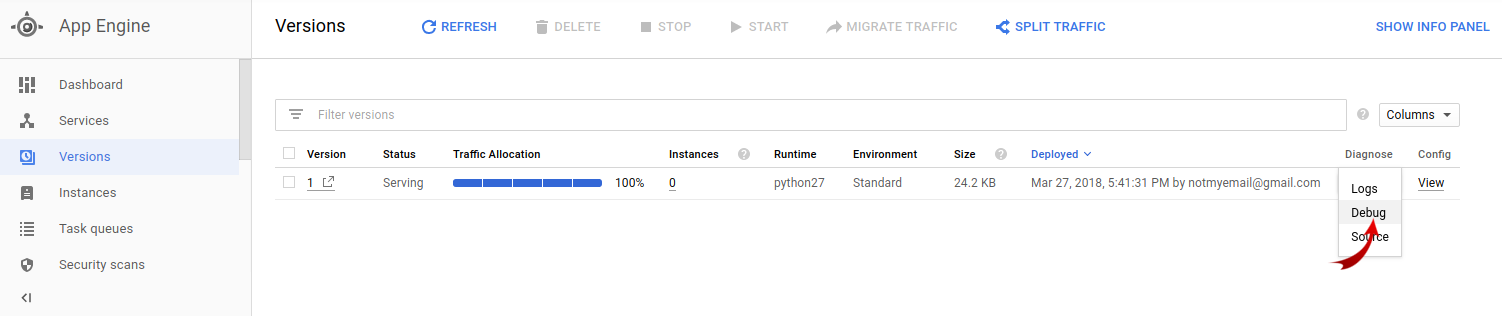
To do that, either click on "Debug" from the AppEngine version view or go to Stackdriver → Debug . This will display the screen shown below. What you need to do is select the file (guestbook.py) on the left, then click on the line number as shown.

This will show a message that is highlighted in the red box above, that it is waiting for a snapshot to be triggered. Now, all we need to do is hit our page at
https://<PROJECT_ID>.appspot.com.
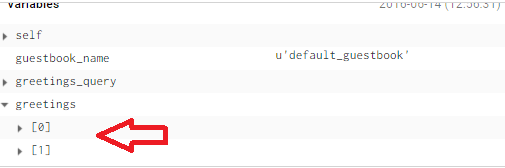
Once you do that, the snapshot will get activated and you will see the Variables and Call stack sections get populated as shown below. Look at how the variables are displayed and you can expand them to check on the values. This is super useful.
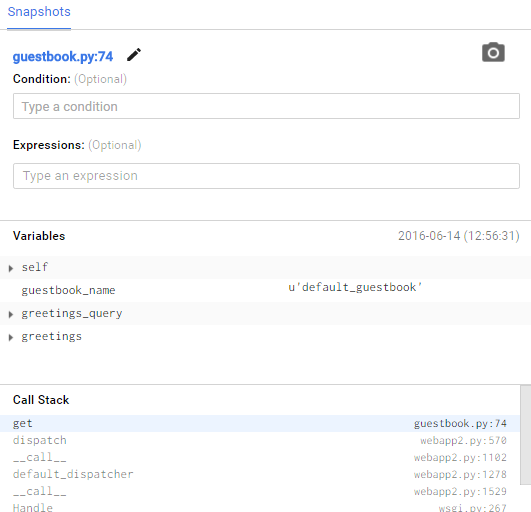
For example, if you expand on greetings variable, you will see that it has the records corresponding to the number of guestbook entries that you've created.
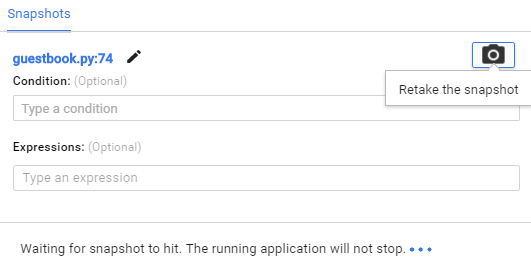
One very handy feature is to retake a snapshot at anytime. Just click on the camera icon at any time and it will once again wait for the snapshot to hit as shown below:
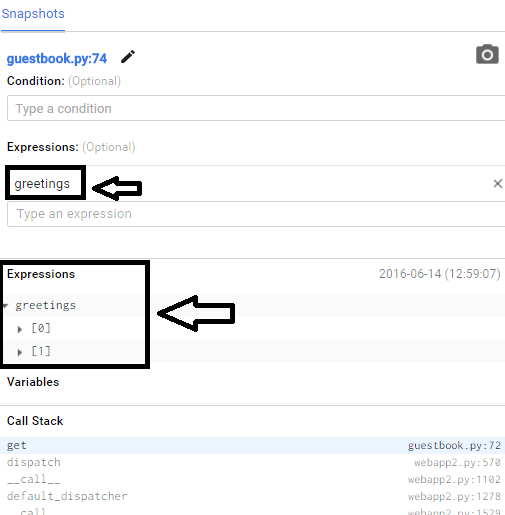
You can use the Expressions field as shown below to track specific variables. For e.g. we know that we have a variable greetings and we are interested in inspecting its value, the moment a snapshot is hit. We can put in the greetings variable as shown in the screenshot below. When the snapshot is hit, it will populate it will the values as shown.
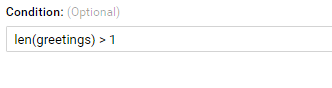
If you would like the snapshot to activate only on a certain condition, then you can use the Condition field as shown below. Here we are saying that the snapshot should happen only if the number of greetings is greater than 1. Experiment with this if you want.
It is very important to make sure that your web application performance is up to the requirements that you have set. Stackdriver Trace is a key tool that helps you understand latency in your applications.
It is enabled by default for all App Engine applications and gives us very handy performance details for all our endpoints along with a breakup across various calls.
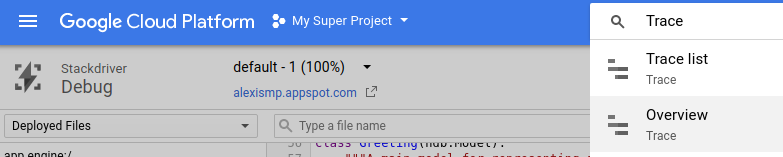
In our case, we have been hitting the home page ("/") and viewing / adding the guestbook entries. This is sufficient for the Trace to tell us more about the latency. Simply navigate to Stackdriver Traces Overview and we see a screenshot as shown below. Notice the recent traces and their latencies.

If we click on any one of the trace i.e. click on the URI link, it will show the detailed trace as given below:
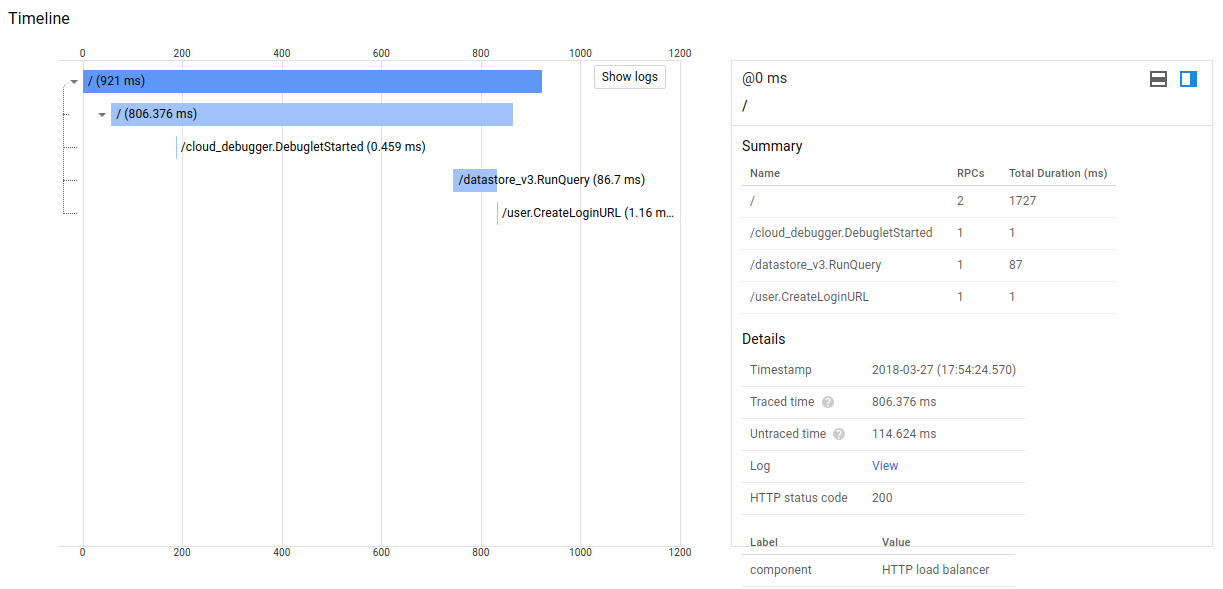
Notice, how it is able to give us a break up of the latency and which calls are taking most time. You can see from the above visualization that the datastore query is taking time. Maybe one option to look at could be caching the data to reduce that bottleneck. Again all this depends on your application and this should be very useful to determine which areas in your call trace might require some refactoring.
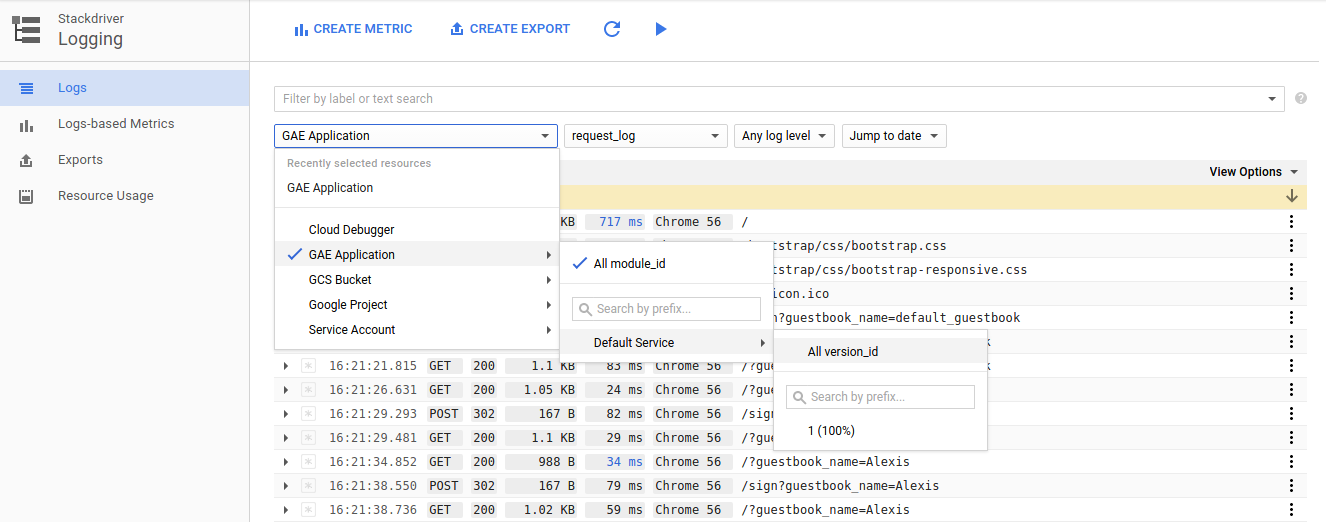
You can view your application logs at any time by going to navigating to Stackdriver Logging (as shown below). There are multiple filters available starting from various GCP Services → Log Types → Log Level → Date and more.

The screenshot below shows the Logs for our App Engine application and the default Version 1.
Finally, let's look to a feature that should get you excited about the possibilities it has to offer. Usually as developers we do our best to put log statements in our code, deploy our code and then hope that the log tells us all that we want to know.
But we know that is not enough and only on debugging do we realize that maybe we should have put a few more log statements here and there. The usual workflow then is to modify your code, put in the additional log statement, re-deploy and monitor.
This is fine but what if you could add these log statements (let's call them logpoints now) to your running application. This means we don't need to go through the process of stopping the application, changing code and redeploying. Instead, we can manage our list of logpoints from outside our application using the logpoints support.
Still from within Cloud Shell, let us check the current list of logpoints that we have configured (which should obviously be 0). This is done via the gcloud command as shown below:
gcloud debug logpoints list
This is the console output you should see :
Debug target not specified. Using default target: default-1
Listed 0 items.
Now, we are going to add a logpoint to the running application. To add a logpoint, we need to do the following things:
- Identify the source code file and the line number where we want to add the logpoint.
- Identify the log message. This log message can be hardcoded or even an expression.
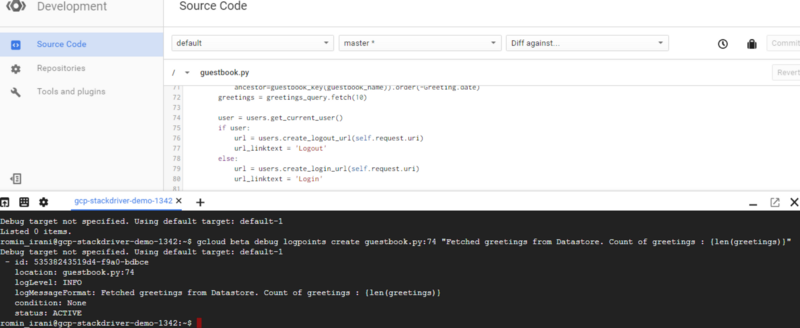
In our case, we are going to add a logpoint to the guestbook.py file at line #74 via the logpoints create command as shown below:
gcloud debug logpoints create guestbook.py:74 "Fetched greetings from Datastore. Count of greetings : {len(greetings)}"This is the console output you should see :
Debug target not specified. Using default target: default-1
— id: 53538243519d4-f9a0-bdbce
location: guestbook.py:74
logLevel: INFO
logMessageFormat: Fetched greetings from Datastore. Count of greetings : {len(greetings)}
condition: None
status: ACTIVE
We provided the filename:linenumber and the log message above. Note that our log message also contains an expression which will print out the number of greetings that we were retrieved from the datastore.
The command comes back with the message that the logpoint has been added. A screenshot from our Cloud Shell is shown below:
Now, if you fire the logpoints list command, you will see the following output:
gcloud debug logpoints list
This is the console output you should see :
Debug target not specified. Using default target: default-1
STATUS LOCATION CONDITION LOG_LEVEL LOG_MESSAGE_FORMAT ID
ACTIVE
guestbook.py:74 INFO Fetched greetings from Datastore. Count of greetings : {len(greetings)} 53538243519d4-f9a0-bdbce
To see this in action, we can once again hit the home page at https://<PROJECT_ID>.appspot.com. This will invoke the code and in turn our logpoint. Remember this will get logged by default in our Application Logs. So all we need to do is visit Stackdriver Logging one more time as shown below:
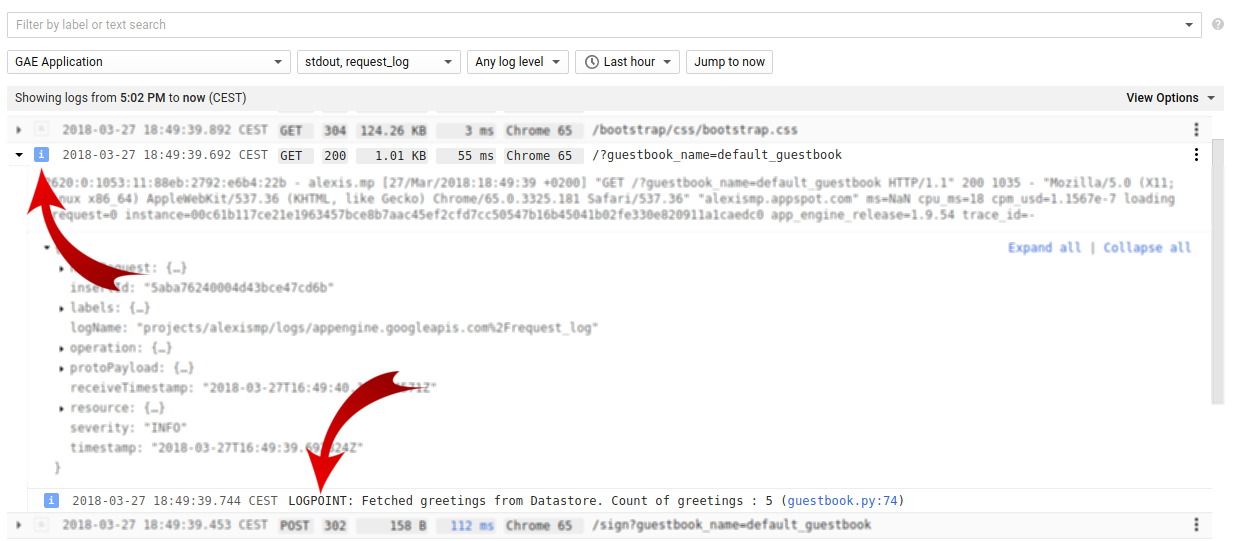
Click on the particular request and Voila! In the details, you will see our logpoint getting fired and the log message is shown.
We hope you have enjoyed this tutorial. It touches upon just a few of the capabilities that the Stackdriver platform brings to the table. There is a lot more to explore. Check out Romin Irani's blog (the original author of this codelab) at https://rominirani.com/ for more Google Cloud Platform tutorials.
You can also check out this other codelab called "Using Stackdriver's monitoring and logging to get better visibility into your application's health".
If you have any feedback or want to report issues with this codelab, please use the "Please find a bug" link at the bottom left of this page.