
The goal of this codelab is for you to understand how to leverage the logging and monitoring tools offered to all Cloud Function developers. These tools come with every Cloud Function that you deploy across all supported languages and should enable you to be more productive when writing and operating your serverless code.
We will use an HTTP-triggered function here but everything we cover also applies to other languages and to functions triggered by other events (storage bucket, pub/sub, etc.)
Self-paced environment setup
If you don't already have a Google Account (Gmail or Google Apps), you must create one. Sign-in to Google Cloud Platform console (console.cloud.google.com) and create a new project:


Remember the project ID, a unique name across all Google Cloud projects (the name above has already been taken and will not work for you, sorry!). It will be referred to later in this codelab as PROJECT_ID.
Next, you'll need to enable billing in the Cloud Console in order to use Google Cloud resources.
Running through this codelab shouldn't cost you more than a few dollars, but it could be more if you decide to use more resources or if you leave them running (see "cleanup" section at the end of this document).
New users of Google Cloud Platform are eligible for a $300 free trial.
Google Cloud Shell
While Google Cloud Functions and its logging and monitoring capabilities can be used remotely from your laptop, in this codelab we will be using Google Cloud Shell, a command line environment running in the Cloud.
This Debian-based virtual machine is loaded with all the development tools you'll need. It offers a persistent 5GB home directory, and runs on the Google Cloud, greatly enhancing network performance and authentication. This means that all you will need for this codelab is a browser (yes, it works on a Chromebook).
To activate Google Cloud Shell, from the developer console simply click the button on the top right-hand side (it should only take a few moments to provision and connect to the environment):

Click the "Start Cloud Shell" button:


Once connected to the cloud shell, you should see that you are already authenticated and that the project is already set to your PROJECT_ID :
gcloud auth list
Command output
Credentialed accounts:
 - <myaccount>@<mydomain>.com (active)
gcloud config list project
Command output
[core]
project = <PROJECT_ID>
Cloud Shell also sets some environment variables by default which may be useful as you run future commands.
echo $GOOGLE_CLOUD_PROJECT
Command output
<PROJECT_ID>
If for some reason the project is not set, simply issue the following command :
gcloud config set project <PROJECT_ID>
Looking for your PROJECT_ID? Check out what ID you used in the setup steps or look it up in the console dashboard:

IMPORTANT: Finally, set the default zone and project configuration:
gcloud config set compute/zone us-central1-f
You can choose a variety of different zones. Learn more in the Regions & Zones documentation.
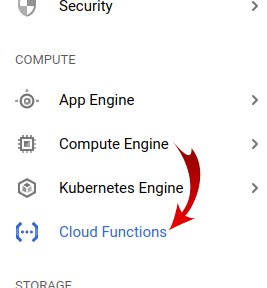
In order to have something to monitor, let's create a Hello World cloud function. In the left menu of the Console, click on Cloud Functions, then "Create function" :
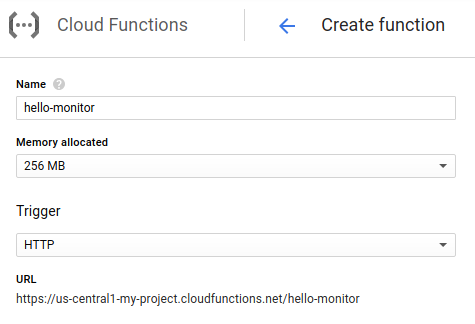
Name your new function "hello-monitor" :
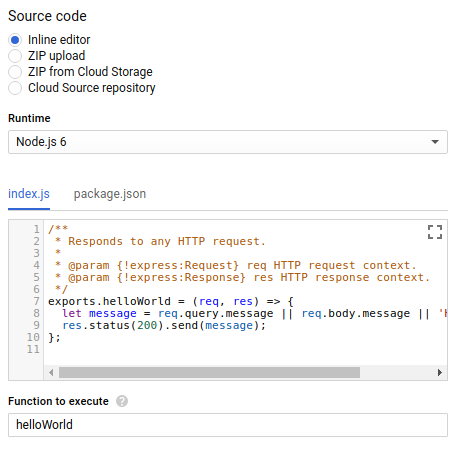
... and keep all the defaults for the source code (you can however chose a different language/runtime if you'd like) :
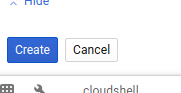
Finally, create the function using the "Create" button :
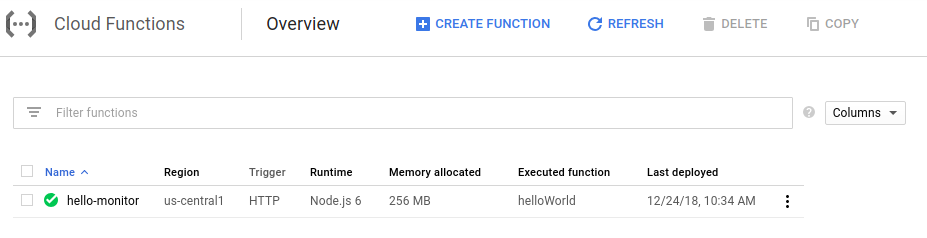
After a short moment you should see your function listed as ready to be invoked (as indicated by the green checkmark) :
Now that the cloud function has been successfully deployed we will test it from the command line.
First, using Cloud Shell, emit the following command :
$ gcloud functions describe hello-monitor
This should return a description of the function, including a URL for httpsTrigger which is the HTTP(S) endpoint to invoke the function. It should be of the form : https://<region>-<project-id>.cloudfunctions.net/hello-monitor
Triggering the function should now be as simple as curl'ing this url :
$ curl https://<region>-<project-id>.cloudfunctions.net/hello-monitor
Hello World!
We'll now use Vegeta, a simple HTTP load testing tool. To install it, from Cloud Shell, simply type this command :
$ go get -u github.com/tsenart/vegeta
To send some traffic to your cloud function (5 requests per second for a couple of minutes), use this command :
$ echo "GET https://<region>-<project-id>.cloudfunctions.net/hello-monitor" \
   | vegeta attack -rate=5 -duration=120s \
   > results.bin
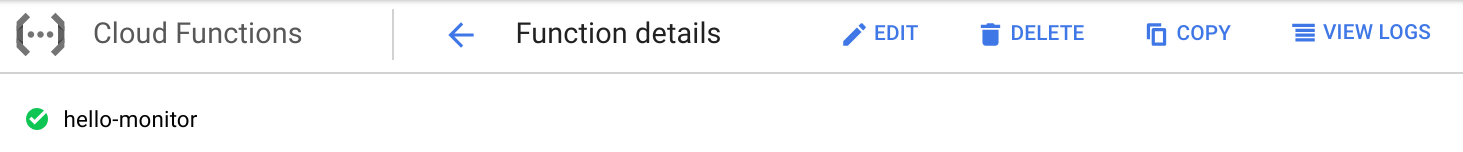
From your function details view, click the "View Logs" right-hand menu :
This should lead you to the Stackdriver Logging section of your project, showing you only your cloud function logs :
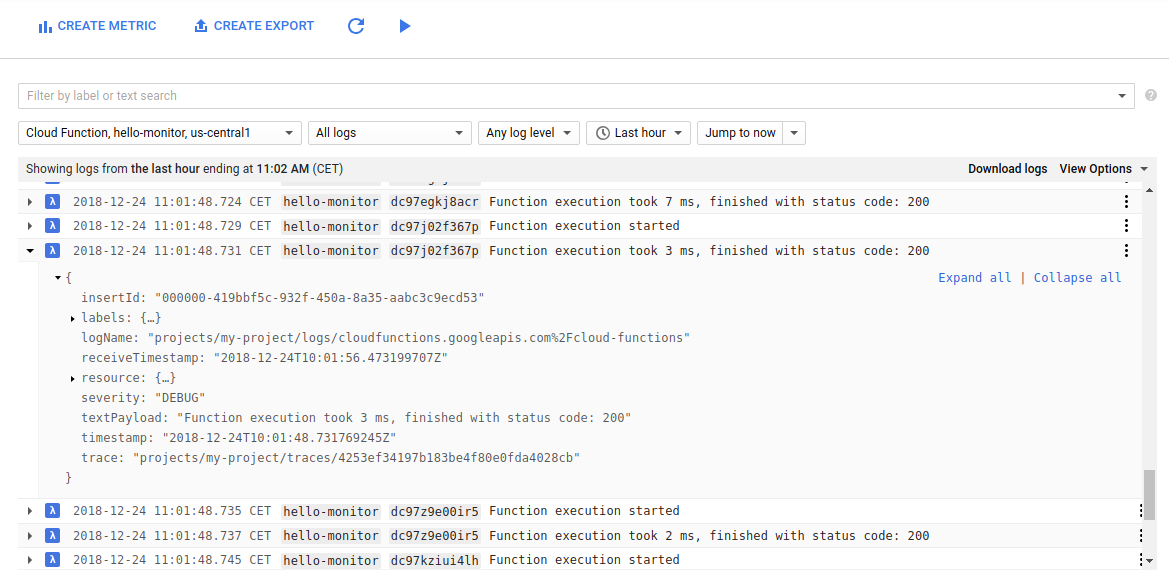
Hopefully all requests to your function return a 200 status code.
Using this log viewer, you can :
- filter by log level (in our case all logs are
Debug-level) - select a specific time-frame (relative or absolute)
- enable log streaming ("play" button at the top of the screen)
- copy a link to the log entry (for sharing with team members)
- show a log entry in resource context
- pin a log entry (as a visual cue)
- export logs to BigQuery, Cloud Storage, or Cloud Pub/Sub (or just download them in JSON or CSV format)
Note also that the top-left selector you can filter logs by function. You can also search for labels or a full text search in the search bar at the top of the window. In our case the labels are hello-monitor (the name of the function) as well as an execution identifier for each request.
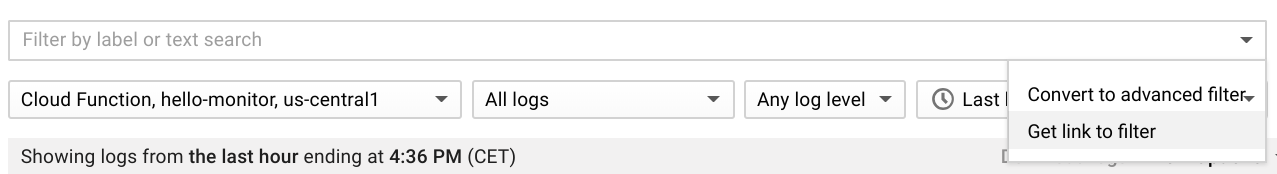
Filters can also be copied to be shared (check out the drop-down menu in the search box) :
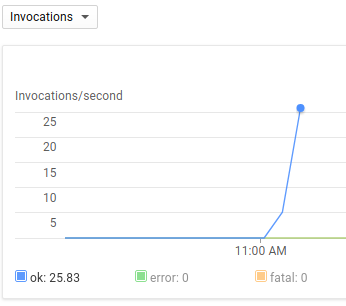
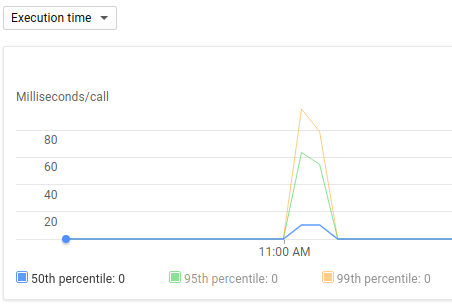
Using the console, navigate to the "Function details" view and observe the spike we've created with our load tester, both in terms of number of invocations per second and in their execution time :
Another more detailed tool to observe latency and RPC calls is the Stackdriver Trace feature, but before we can use this feature we need to make a few changes to our functions, namely:
- Add the life-saving
node-emojipackage as a dependency - Update the function code to use the node-emoji module and introduce some latency
- Add an environment variable to enable Stackdriver Trace for Cloud Functions
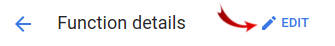
From the "Function details" page, click edit to modify the function :
Edit the package.json file to add a dependency for the node-emoji package :
{
  "name": "sample-http",
  "version": "0.0.1",
  "dependencies": {
    "node-emoji": "^1.8.1"
  }
}
Edit the actual function by changing the content of index.js to the following :
const emoji = require('node-emoji');

exports.helloWorld = (req, res) => {
  let message = req.query.message || req.body.message || 'Hello World!';

  // add some latency, functions are too quick!
  setTimeout(function() {
     message += emoji.random().emoji;
     res.status(200).send(message);
  }, (3 * 100));  // 300ms

};
This will add a random emoji to the message returned by the function after it pauses for 300 milliseconds.
Finally, add an Cloud Function environment variable called GOOGLE_CLOUD_TRACE_ENABLED and set to true as follows:
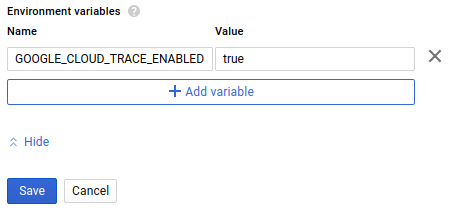
Don't forget to click Save!
Now go back to Cloud Shell and recall the command to generate some load on the newly deployed function :
$ echo "GET https://<region>-<project-id>.cloudfunctions.net/hello-monitor" \
   | vegeta attack -rate=5 -duration=120s \
   > results.bin
We're now ready to observe the list of traces produced with no other setup requirements and no specific tracing library in your code !
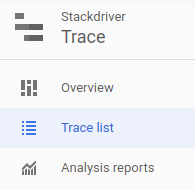
Using the left-hand menu, navigate to Trace list (under Stackdriver Trace) :
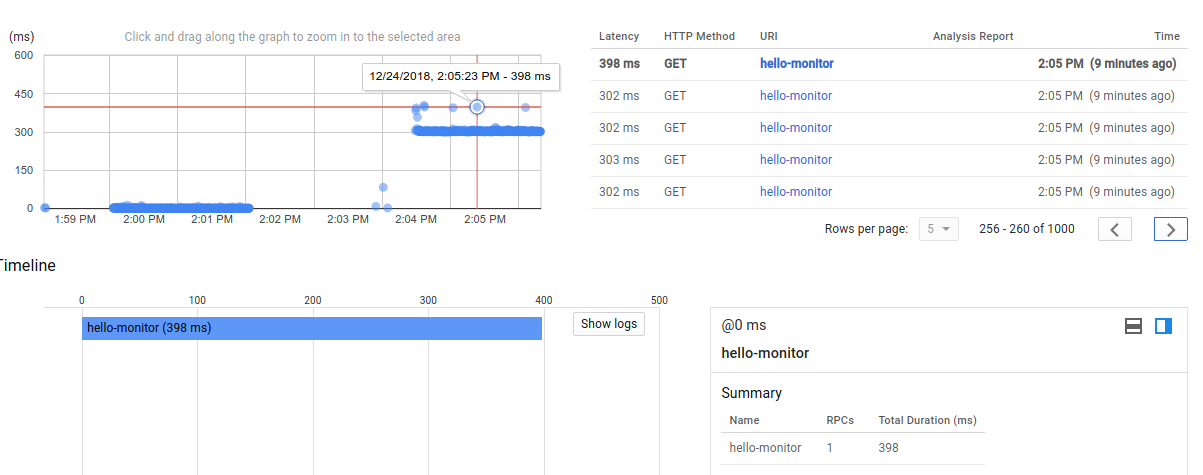
You should see something similar to this screen capture :
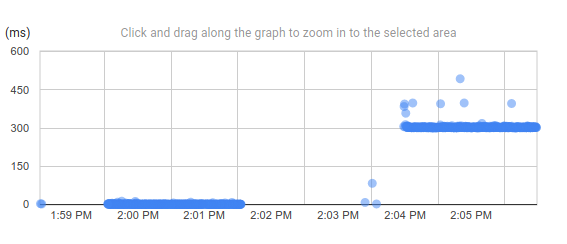
This should make it quite obvious that the latency introduced in our function is indeed measured at 300ms.
Each dot on this graph is a request for which you can view detailed information, such as timestamp, the HTTP method and status, its labels, a link back to the corresponding log entry, and any subsequent RPC call that the function makes :
If you'd like to zoom in, simply click and drag on the graph :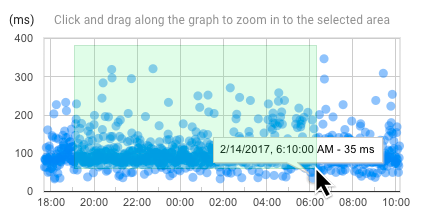
To zoom out, click the "Undo Zoom" button at the top of the page.
Since we've deployed a single function, the graph shows only GET requests on the hello-monitor URI, but you can filter traces by HTTP method (GET, POST, DELETE, ...), by HTTP status (2XX, 3XX, ...), or by using the request filter.
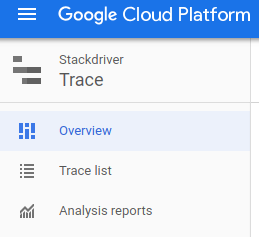
Navigate now to the Traces "Overview" section in the left menu :
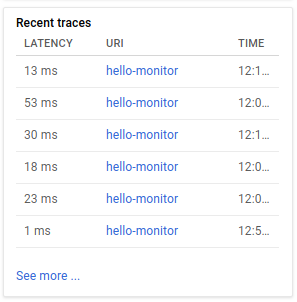
From this overview page you can find recent traces and other insights.
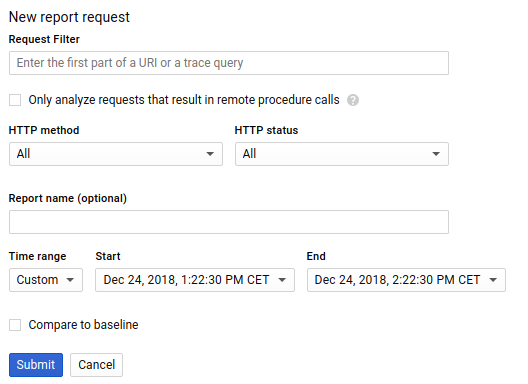
... as well as the ability to create custom reports based on a combination of a URI request filter, an HTTP method, an HTTP status, and a time range. It even lets you compare the generated values to a time baseline :
If you manage to setup the correct time ranges and with enough data points you can produce a report that shows the important latency shift between the initial function and the new one :
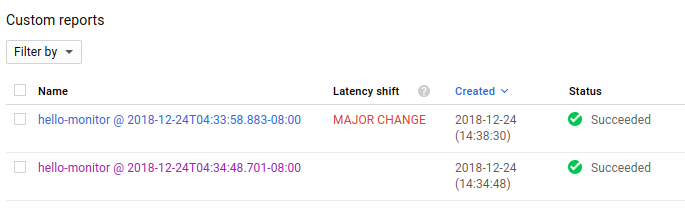
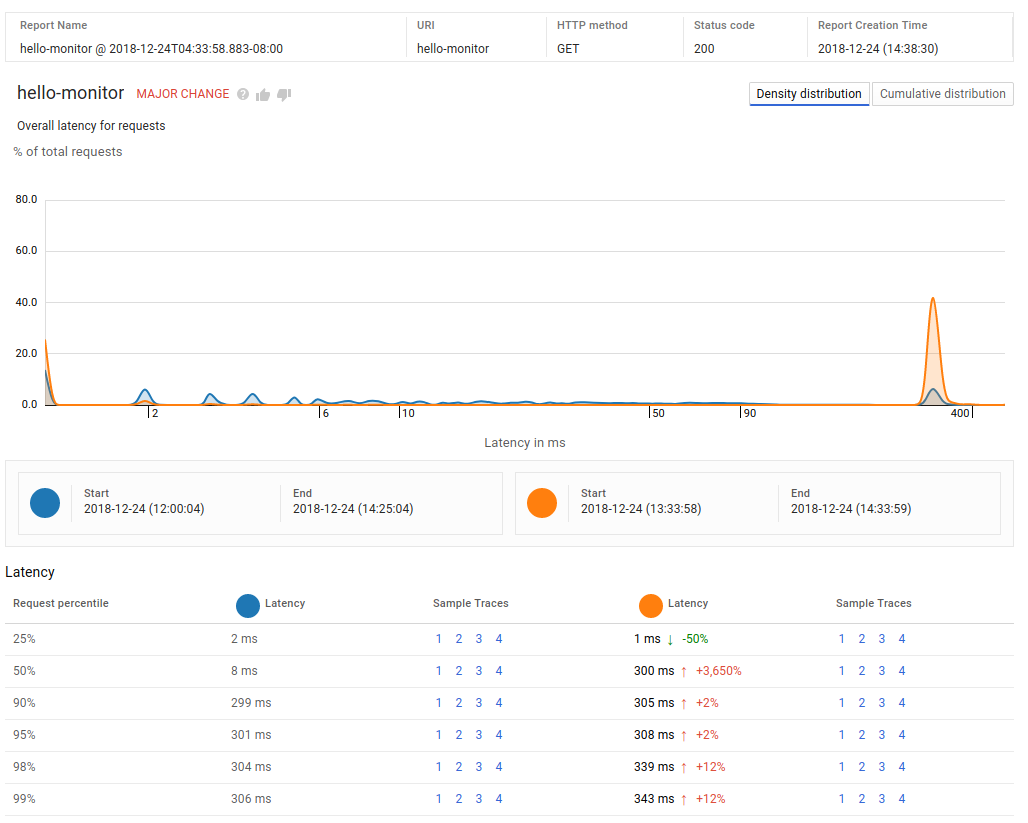
Such a custom report can be used to find when a performance problem was introduced as well as to track a service level indicator (SLI) such as end-user request latency.
This concludes our codelab which covered deploying a new cloud function, navigating through its logs and observing its request traces.
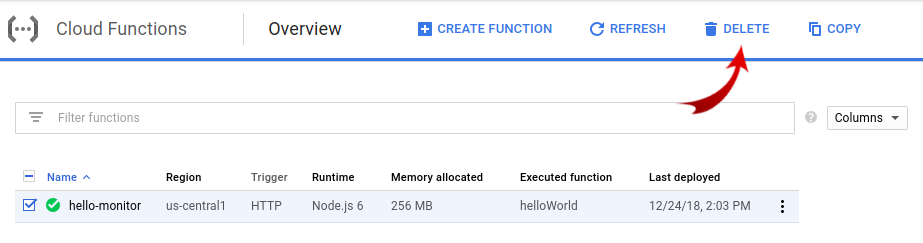
While Cloud Functions and Stackdriver tools are serverless platforms which will not incur cost when not in use, to be a good cloud citizen let's delete our function.
Simply select the hello-monitor function in the Cloud Functions overview page and click "delete".
This concludes this simple getting started codelab with Cloud Functions logging and traces!
Here is some follow-up reading :
- Stackdriver Monitoring log-based metrics
- Stackdriver Error Reporting
- ... or more codelabs from the Serverless category
/