Monitoring your infrastructure
Once your server-side tagging setup has been upgraded to production-ready status, you will need to take proactive steps to monitor the deployment.
Even though you should periodically check the status of your deployment, critical checkpoints are:
- When you first deploy the environment and the following days/weeks to make sure you have enough computation available for the incoming traffic.
- Before known traffic peaks, such as when seasonal campaigns begin or before a major launch.
Three useful monitoring opportunities in the Google Cloud Platform are with the Cloud Run reports, Cloud Logging, and Billing reports.
Cloud Run reports
If you are running your server-side tagging environment on Google Cloud Run, you can access some very useful reports in the Cloud Run section of the Google Cloud Platform console.
When you click on a Cloud Run service, you see a dashboard that shows you a handy report about the overall health of your tagging server.

- Pick an interval you want to see statistics for.
- The Request count card shows the number of requests reaching the service. The number is sampled every 60 seconds and is categorized into different HTTP response codes (e.g. 2XX, 4XX, 5XX).
- The Container instance count card shows you how many instances were deployed at a given time. If the number of instances falls below your configured minimum, your selected Google Cloud region might have resource availability issues.
- The Container CPU utilization card shows the total CPU usage of the service. You will be able to observe how Cloud Run creates more instances when your instances use more than 0.6 (60%) of their CPU. If you see the total CPU usage constantly near or over the target threshold, it means that the minimum instance count is not enough.
If any of these graphs or reports give you cause for concern, a good recovery step is to deploy a new revision via the Cloud Run user interface, even if you just keep the same settings. This will force a redeployment of your server-side tagging environment.
Sometimes the Google Cloud Region your service is running in (us-central1 by default) can have issues with resource availability. A good place to verify these is via Cloud Logging (see below) as well as the Google Cloud Service Health dashboard.
Cloud Logging
Cloud Run logs a lot of useful information about your environment health automatically into a Google Cloud service called Cloud Logging.
To explore your service logs, head on over to Logs Explorer.
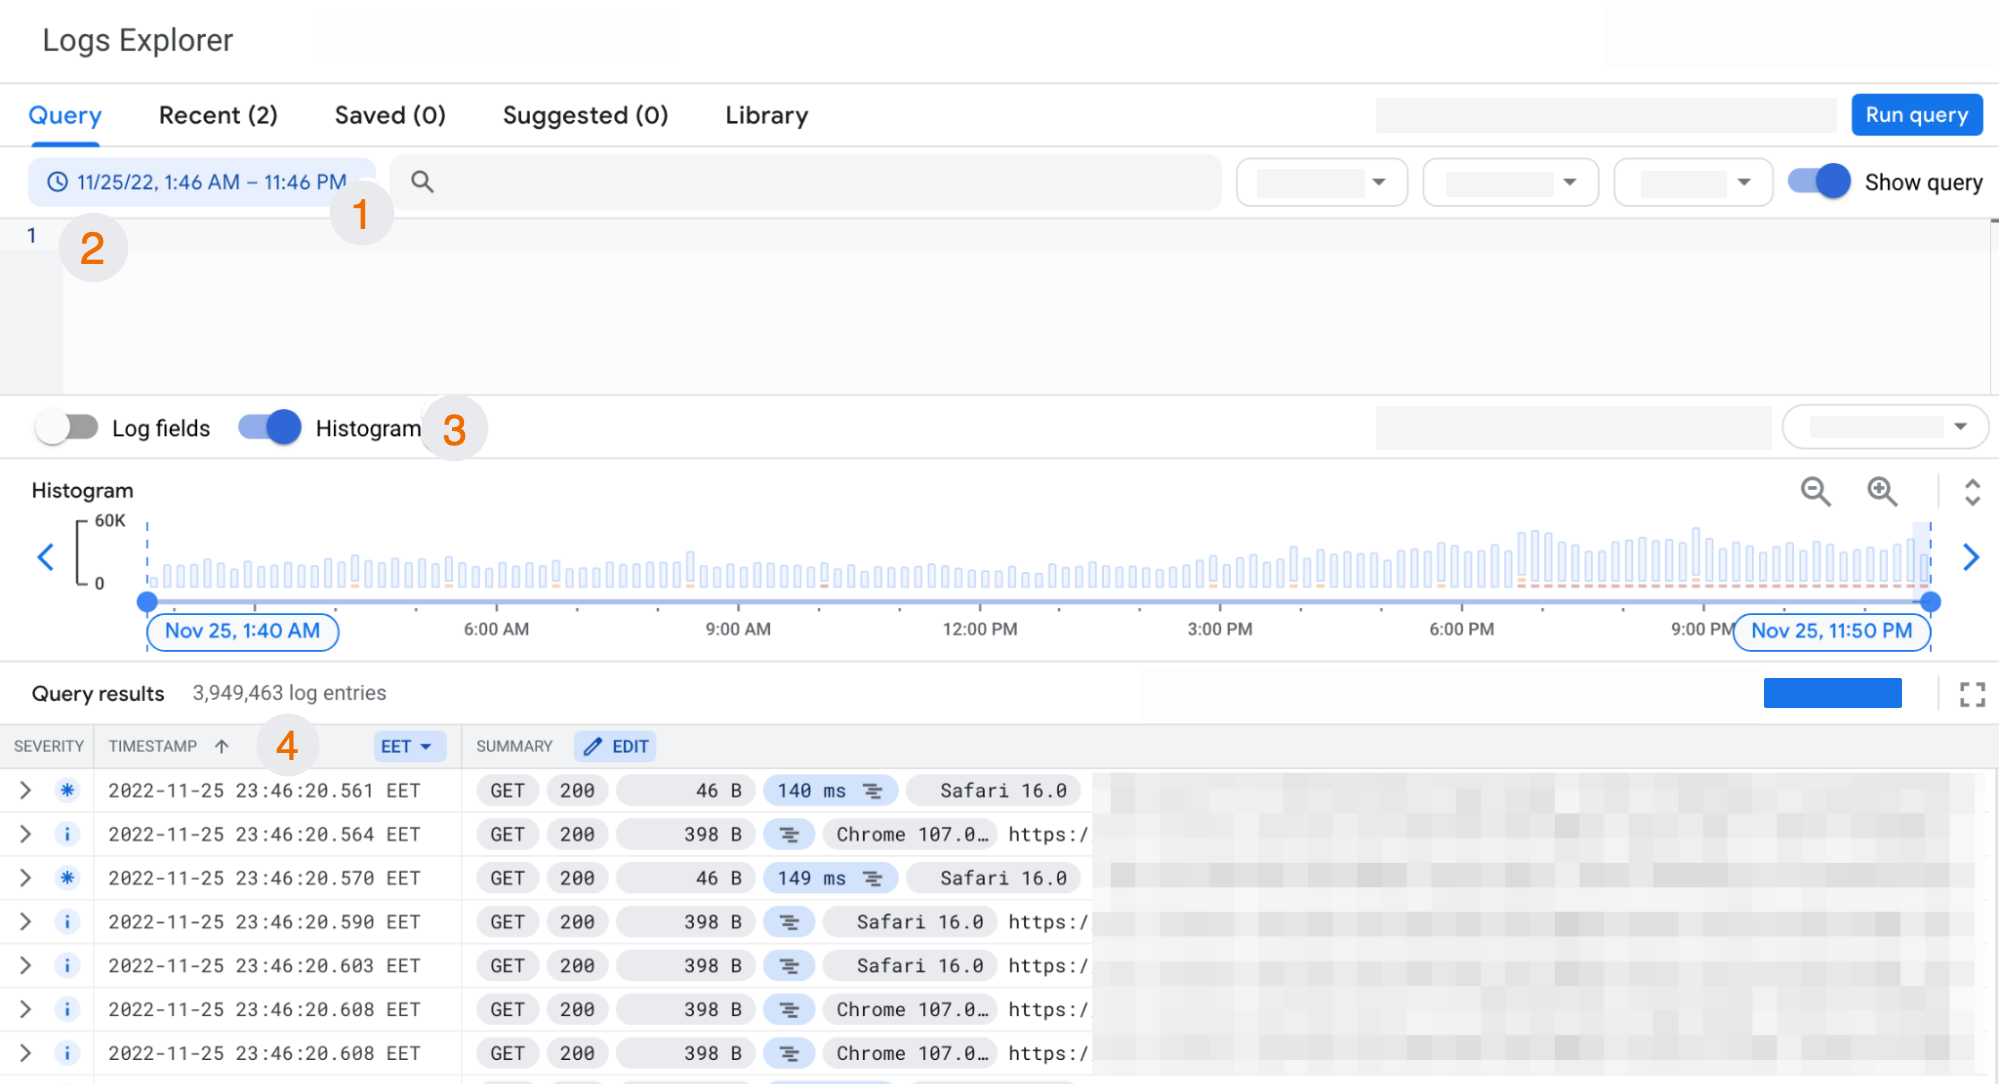
- Pick a date range you want to see statistics for.
- Enter a query to filter the logs (you can find useful queries below).
- Toggle the Histogram on to quickly see what grades of severity your logs comprise (e.g. Info, Warning, Error).
- Click any log in the list to see more details about the entry.
Here are some useful queries to help you monitor the setup:
Filtering for system errors
The severity = "ERROR" query filters log entries that are classified as service errors. This is a useful query whenever you suspect there to be a service disruption or something else wrong with your instances. For example, a log entry with severity ERROR could have the following description: ZONE_RESOURCE_POOL_EXHAUSTED. This error means that the Google Cloud Platform was unable to provide you with the instances you required.
Filtering for faulty HTTP requests
The httpRequest.status >= 400 query filters the logs to show HTTP requests that server-side Tag Manager responded to with an error status (HTTP status 400 or higher).
400 errors typically mean that a request was sent to your server-side tagging endpoint but there was no client to claim the request. These could be requests from bots and crawlers that can be ignored. However, if your data streams result in a 400 error, you need to take a look at the configuration of your server container clients.
5XX errors indicate an issue with the Google Cloud service itself. They could indicate failed health checks or load balancer problems. If your environment is suffering from resource exhaustion issues, a typical symptom is that you'll start seeing more of these 5XX errors, too.
Filtering standard output logs
The query logName: "stdout" returns the standard output log of your service. It's a useful log to follow in case your server-side resources (clients, tags, and variables) use the logToConsole sandbox API to log relevant information.
Filtering incoming HTTP requests
logName: "logs/requests" returns logs are for the actual incoming HTTP requests themselves. You will see them only if you have not disabled request logging when running the shell script or by adding other log filters.
You can expand the request details by clicking on the relevant row in the list, but note that the HTTP request body is not available in logs. You will only see the request URL and additional metadata. If the request is sent with the POST method, for example, where the contents are encoded in the request body, those contents can not be explored in the logs.
Congratulations on finishing this learning pathway!
Please take the survey to help us improve the course.
What to do now?
In case you still need to configure additional tags, check out the server-side tagging docs:
Where to find support?
If you need more support with implementing your measurement tags, you can reach out to our certified partners or ask the community.