Learn what noise means, where it is added, and how it impacts your measurement efforts.
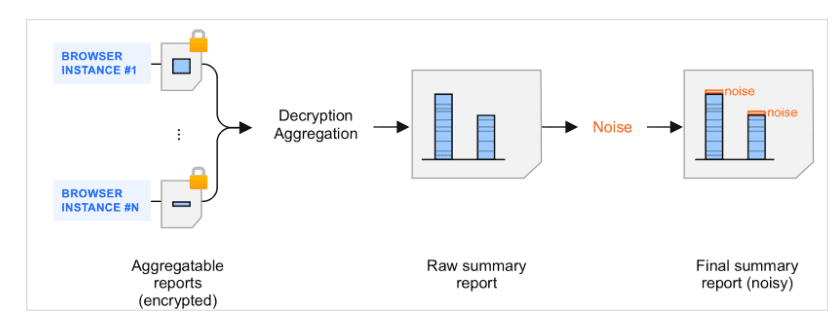
Summary reports are the result of the aggregation of aggregatable reports. When aggregatable reports are batched by a collector and processed by the aggregation service, noise—a random amount of data—is added to the resulting summary reports. Noise is added to protect user privacy. The goal of this mechanism is to have a framework which can support differentially private measurement.
Introduction to noise in summary reports
While adding noise isn't usually a part of ads measurement today, in many cases the noise added won't substantially change how you interpret your results.
It may help to think about it in the following way: Would you be confident taking a decision based on a certain piece of data if that data wasn't noisy?
For example, would an advertiser be confident in changing their campaign strategy or budgets, based on the fact that Campaign A had 15 conversions and Campaign B had 16?
If the answer is no, noise is irrelevant.
What you will want to do is configure your API usage in such a way that:
- The answer to the question above is yes.
- Noise is managed in a way that doesn't significantly impact your ability to make a decision based on certain data. You can approach this as follows: for an expected minimum number of conversions, you want to keep the noise in the collected metric below a certain %.
In this section and the following, we'll outline strategies to achieve 2.
Core concepts
The aggregation service adds noise once to each summary value—that is, once per key—every time a summary report is requested.
These noise values are randomly drawn from a specific probability distribution, discussed below.
All the elements that impact noise rely on two primary concepts.
The noise distribution (details below) is the same regardless of the summary value, low or high. Therefore, the higher the summary value, the less impact the noise is likely to have, relative to this value.
For example, assume both a total aggregated purchase value of $20,000 and a total aggregated purchase value of $200 are subject to noise selected from the same distribution.
Let's assume noise from this distribution varies roughly between -100 and +100.
- For the summary purchase value of $20,000, noise varies between 0 and 100/20,000=0.5%.
- For the summary purchase value of $200, noise varies between 0 and 100/200=50%.
Therefore, noise is likely to have a lower impact on the $20,000 aggregated purchase value than on the $200 value. Relatively speaking, $20,000 is likely to be less noisy, that is it's likely to have a higher signal-to-noise ratio.

This has a few important practical implications that are outlined in the next section. This mechanism is part of the API design, and the practical implications are long-term. They will continue to play an important role when ad techs design and evaluate various aggregation strategies.
While the noise is drawn from the same distribution regardless of the summary value, that distribution depends on several parameters. One of these parameters, epsilon, could be altered by ad techs during the concluded origin trial to evaluate various utility/privacy adjustments. However, consider the ability to tweak epsilon as temporary. We welcome your feedback on your use-cases and the values of epsilon that work well.
While an ad tech company is not in direct control of the ways noise is added, it can influence the impact of noise on its measurement data. In the next sections, we'll dive into how noise can be influenced in practice.
Before we do, let's take a closer look at the way noise is applied.
Zooming in: how noise is applied
One noise distribution
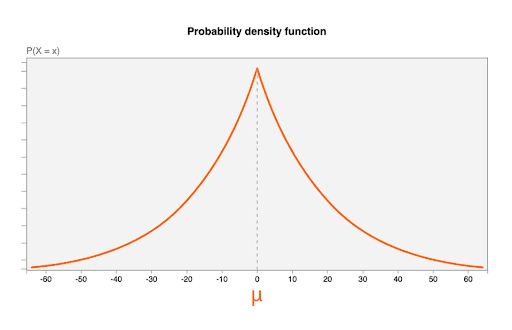
Noise is drawn from the Laplace distribution, with the following parameters:
- A mean (
μ) of 0. This means that the most likely noise value is 0 (no noise added), and that the noisy value is as likely to be smaller than the original as it is to be larger (this is sometimes called unbiased). - A scale parameter of
b = CONTRIBUTION_BUDGET/epsilon.CONTRIBUTION_BUDGETis defined in the browser.epsilonis fixed in the aggregation server.
The following diagram shows the probability density function for a Laplace distribution with μ=0, b = 20:
Random noise values, one noise distribution
Let's assume that an ad tech requests summary reports for two aggregation keys, key1 and key2.
The aggregation service selects two noise values x1 and x2, following the same noise distribution. x1 is added to the summary value for key1, and x2 is added to the summary value for key2.
In the diagrams, we'll represent noise values as identical. This is a simplification; in reality, noise values will vary, as they're drawn randomly from the distribution.
This illustrates that the noise values all come from the same distribution, and are independent from the summary value they're applied to.
Other properties of noise
Noise is applied to every summary value—including empty ones (0).
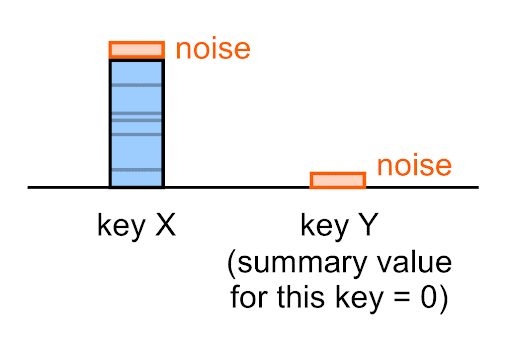
For example, even if the true summary value for a given key is 0, the noisy summary value you'll see in the summary report for this key will (most likely) not be 0.
Noise can be either a positive or a negative number.
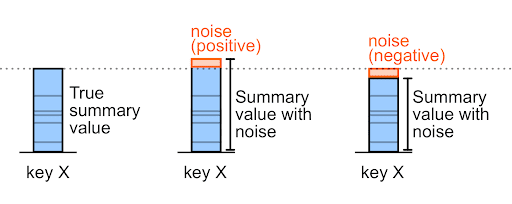
For example, for a pre-noise purchase amount of 327,000, noise may be +6,000 or -6,000 (these are arbitrary example values).
Evaluating noise
Calculating the standard deviation of the noise
The standard deviation of the noise is:
b*sqrt(2) = (CONTRIBUTION_BUDGET / epsilon)*sqrt(2)
Example
With epsilon = 10, the standard deviation of the noise is:
b*sqrt(2) = (CONTRIBUTION_BUDGET / epsilon)*sqrt(2) = (65,536/10)*sqrt(2) = 9,267
Evaluating when measurement differences are significant
Because you will know the standard deviation of the noise added to each value output by the aggregation service, you can determine appropriate thresholds for comparison to determine whether differences observed could be due to noise.
For example, if the noise added to a value is approximately +/- 10 (accounting for scaling) and the difference in the value between two campaigns is over 100, it's likely safe to conclude that the difference in the value measured between each campaign is not due to noise alone.
Engage and share feedback
You can participate and experiment with this API.
- Read about aggregatable reports and the aggregation service, ask questions, and suggest feedback.
- Read the Attribution reporting guides.
- Ask questions and join discussions on the Privacy Sandbox Developer Support repo.
Next steps
- To see what variables you can control to improve the signal to noise ratio, refer to Working with noise.
- Review Experiment with summary report design decisions for help with planning your aggregation reporting strategies.
- Try out the Noise lab.