
Page Summary
-
Regularly review your Google Maps Platform API usage, quota, and billing information to control costs and identify unexpected application interactions.
-
Google Maps Platform provides Reporting and Monitoring tools to help you track and manage your API usage.
-
Reporting offers predefined visual reports in the Cloud Console for basic usage, quota, and billing insights.
-
Monitoring provides customizable dashboards and alerts for in-depth tracking and proactive notifications.
-
Use these tools to stay within your budget, optimize performance, and ensure efficient use of Google Maps Platform services.
It's important to review your Google Maps Platform API usage, quota, and billing information on a regular basis. This information helps you measure API usage, stay within predefined consumption limits, and control costs through planned budgets. Reviewing this information can also alert you to any unexpected interactions that might occur between your applications and the Google Maps Platform services.
The Maps Platform provides two tools that can help you review usage, quota, and billing information:
- Reporting: A set of predefined visual reports that let you easily see basic API usage, quota, and billing information in the Google Cloud console. You can quickly determine the number of API calls, see how close you are to hitting API usage quotas, and monitor billing usage over time.
Monitoring: A set of tools, both in the Cloud console and through an API, that let you monitor API usage, quota, and billing information and define alerts when any of these metrics approaches a predefined limit.
Monitoring lets you create your own customized monitoring dashboards displaying your metrics as different chart types. You can also issue alert notifications, such as emails or SMS text messages, when a metric crosses a predefined threshold.
Reporting
Reporting in the Maps Platform provides a set of predefined visual reports that let you easily see basic API usage, quota, and billing information in the Cloud console. View reports for your Maps Platform API usage, quota, and billing numbers by using the Cloud console.
APIs & Services reports
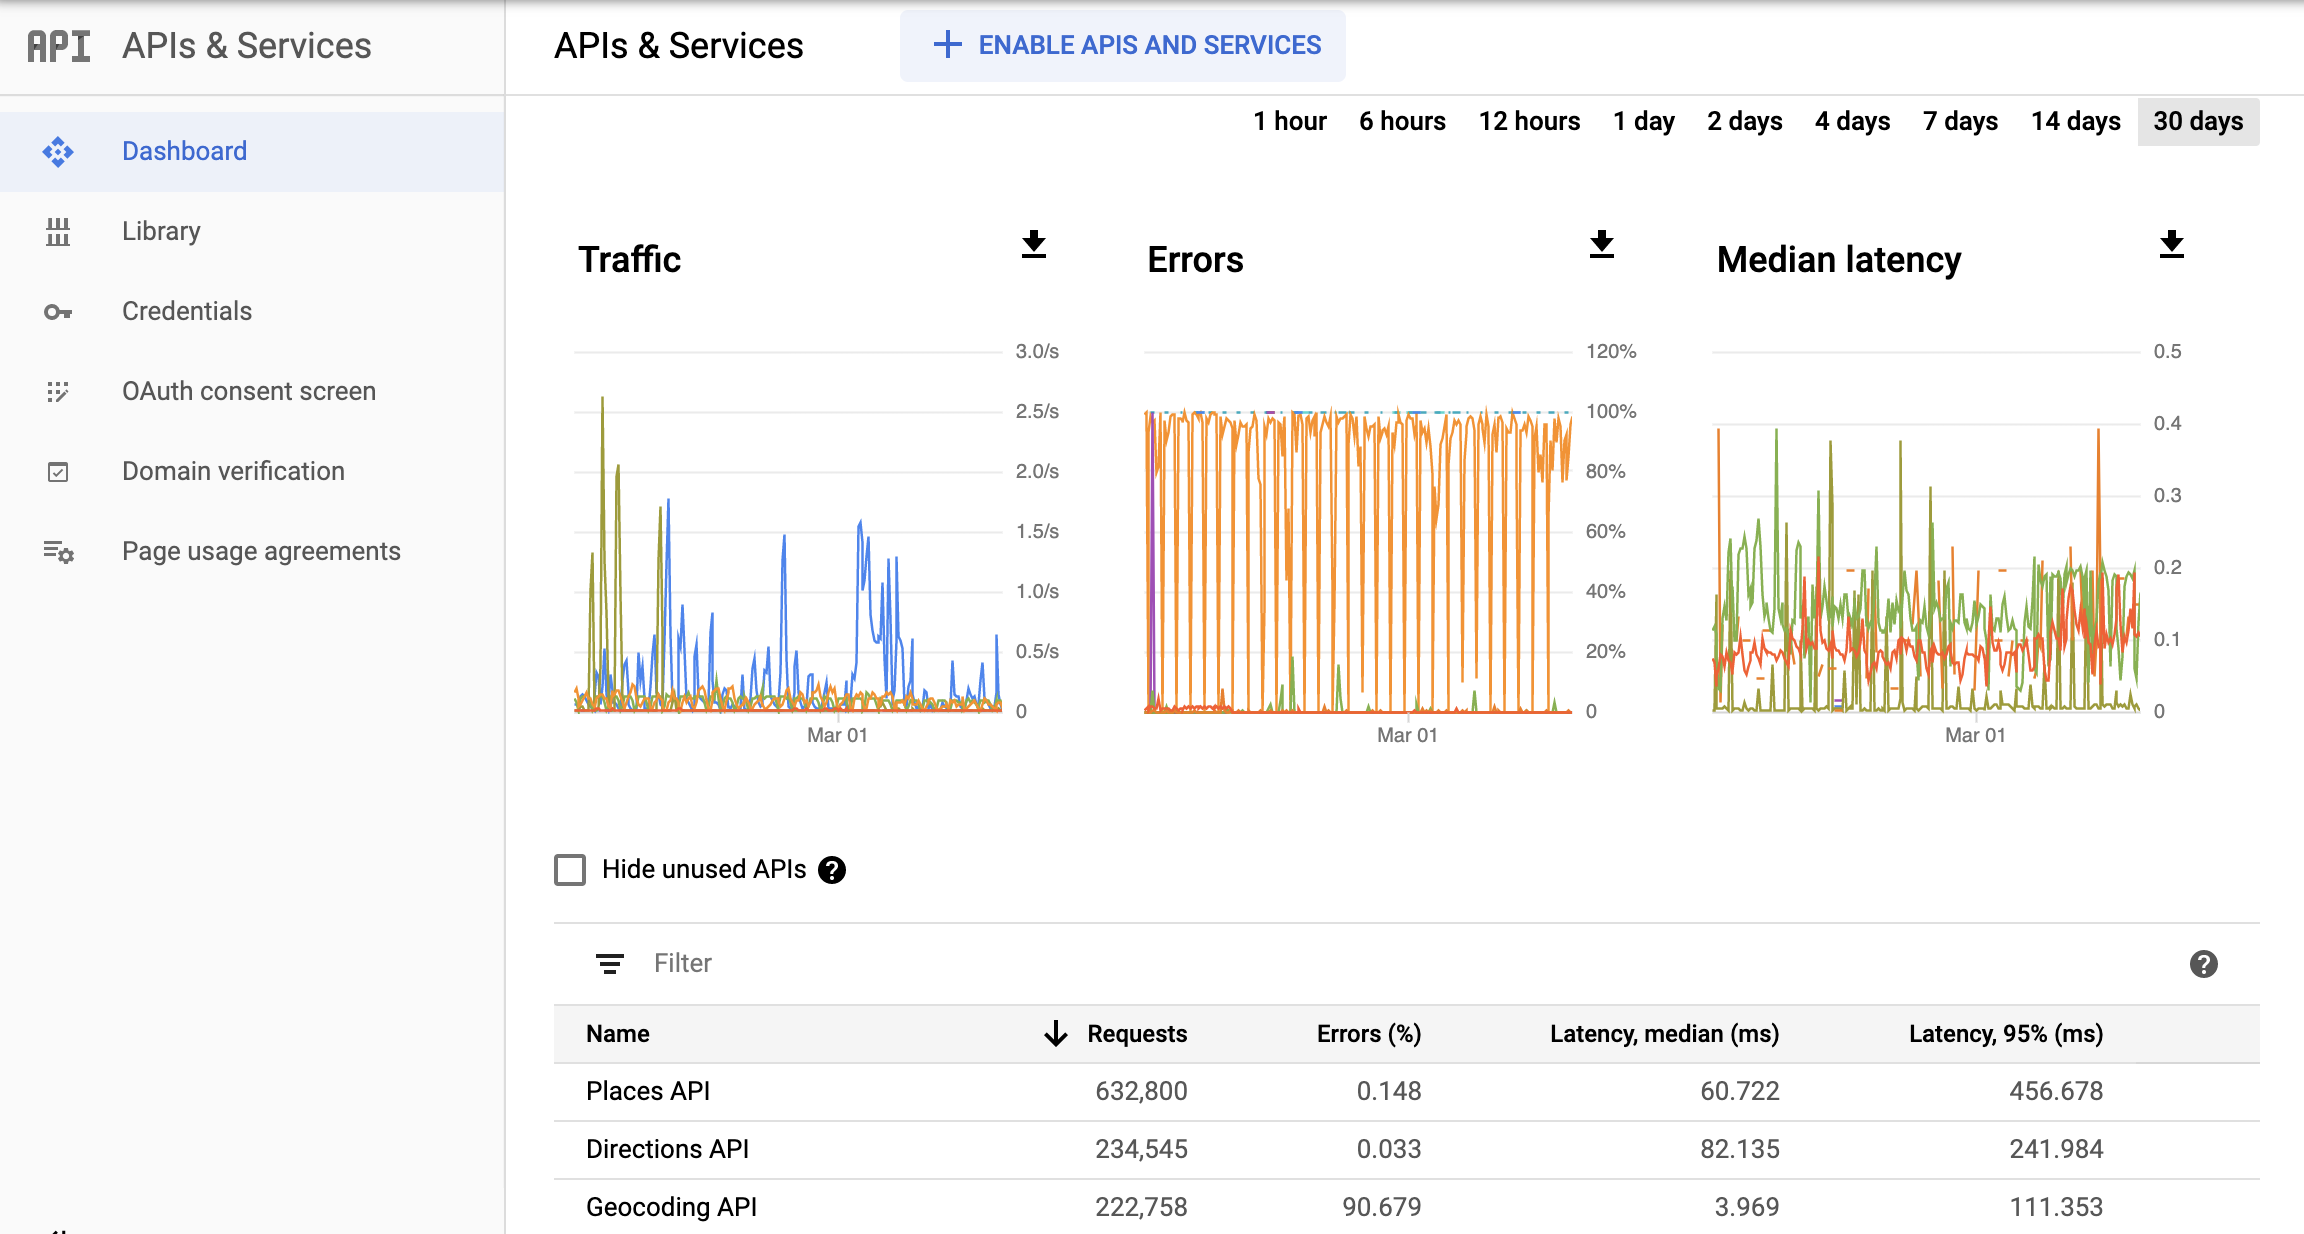
The Cloud console APIs & Services report provides usage metrics for all APIs enabled for your project, including the Maps Platform APIs and SDKs as well as all other Google APIs and services.
This image shows the APIs & Services report.
Quotas
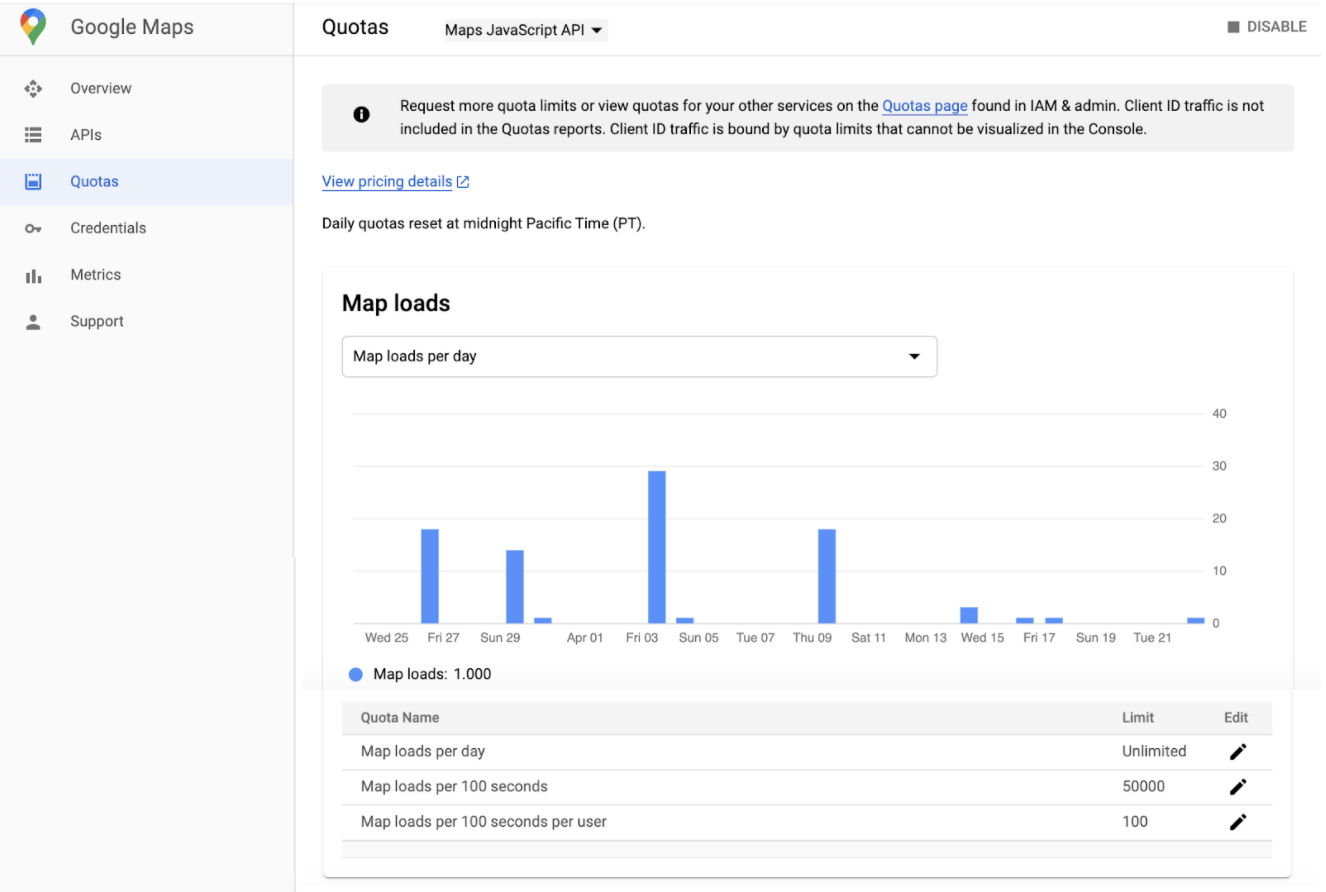
Quotas set limits on the number of requests your project can make to the Maps Platform APIs. Requests can be limited in three ways:
- Per day
- Per minute
- Per user per minute (where available)
Only successful requests and requests that cause server errors count against quota. Requests that fail authentication do not count against quota.
Quota usage is displayed in graphs on the Quotas report page in the Cloud console.
Billing
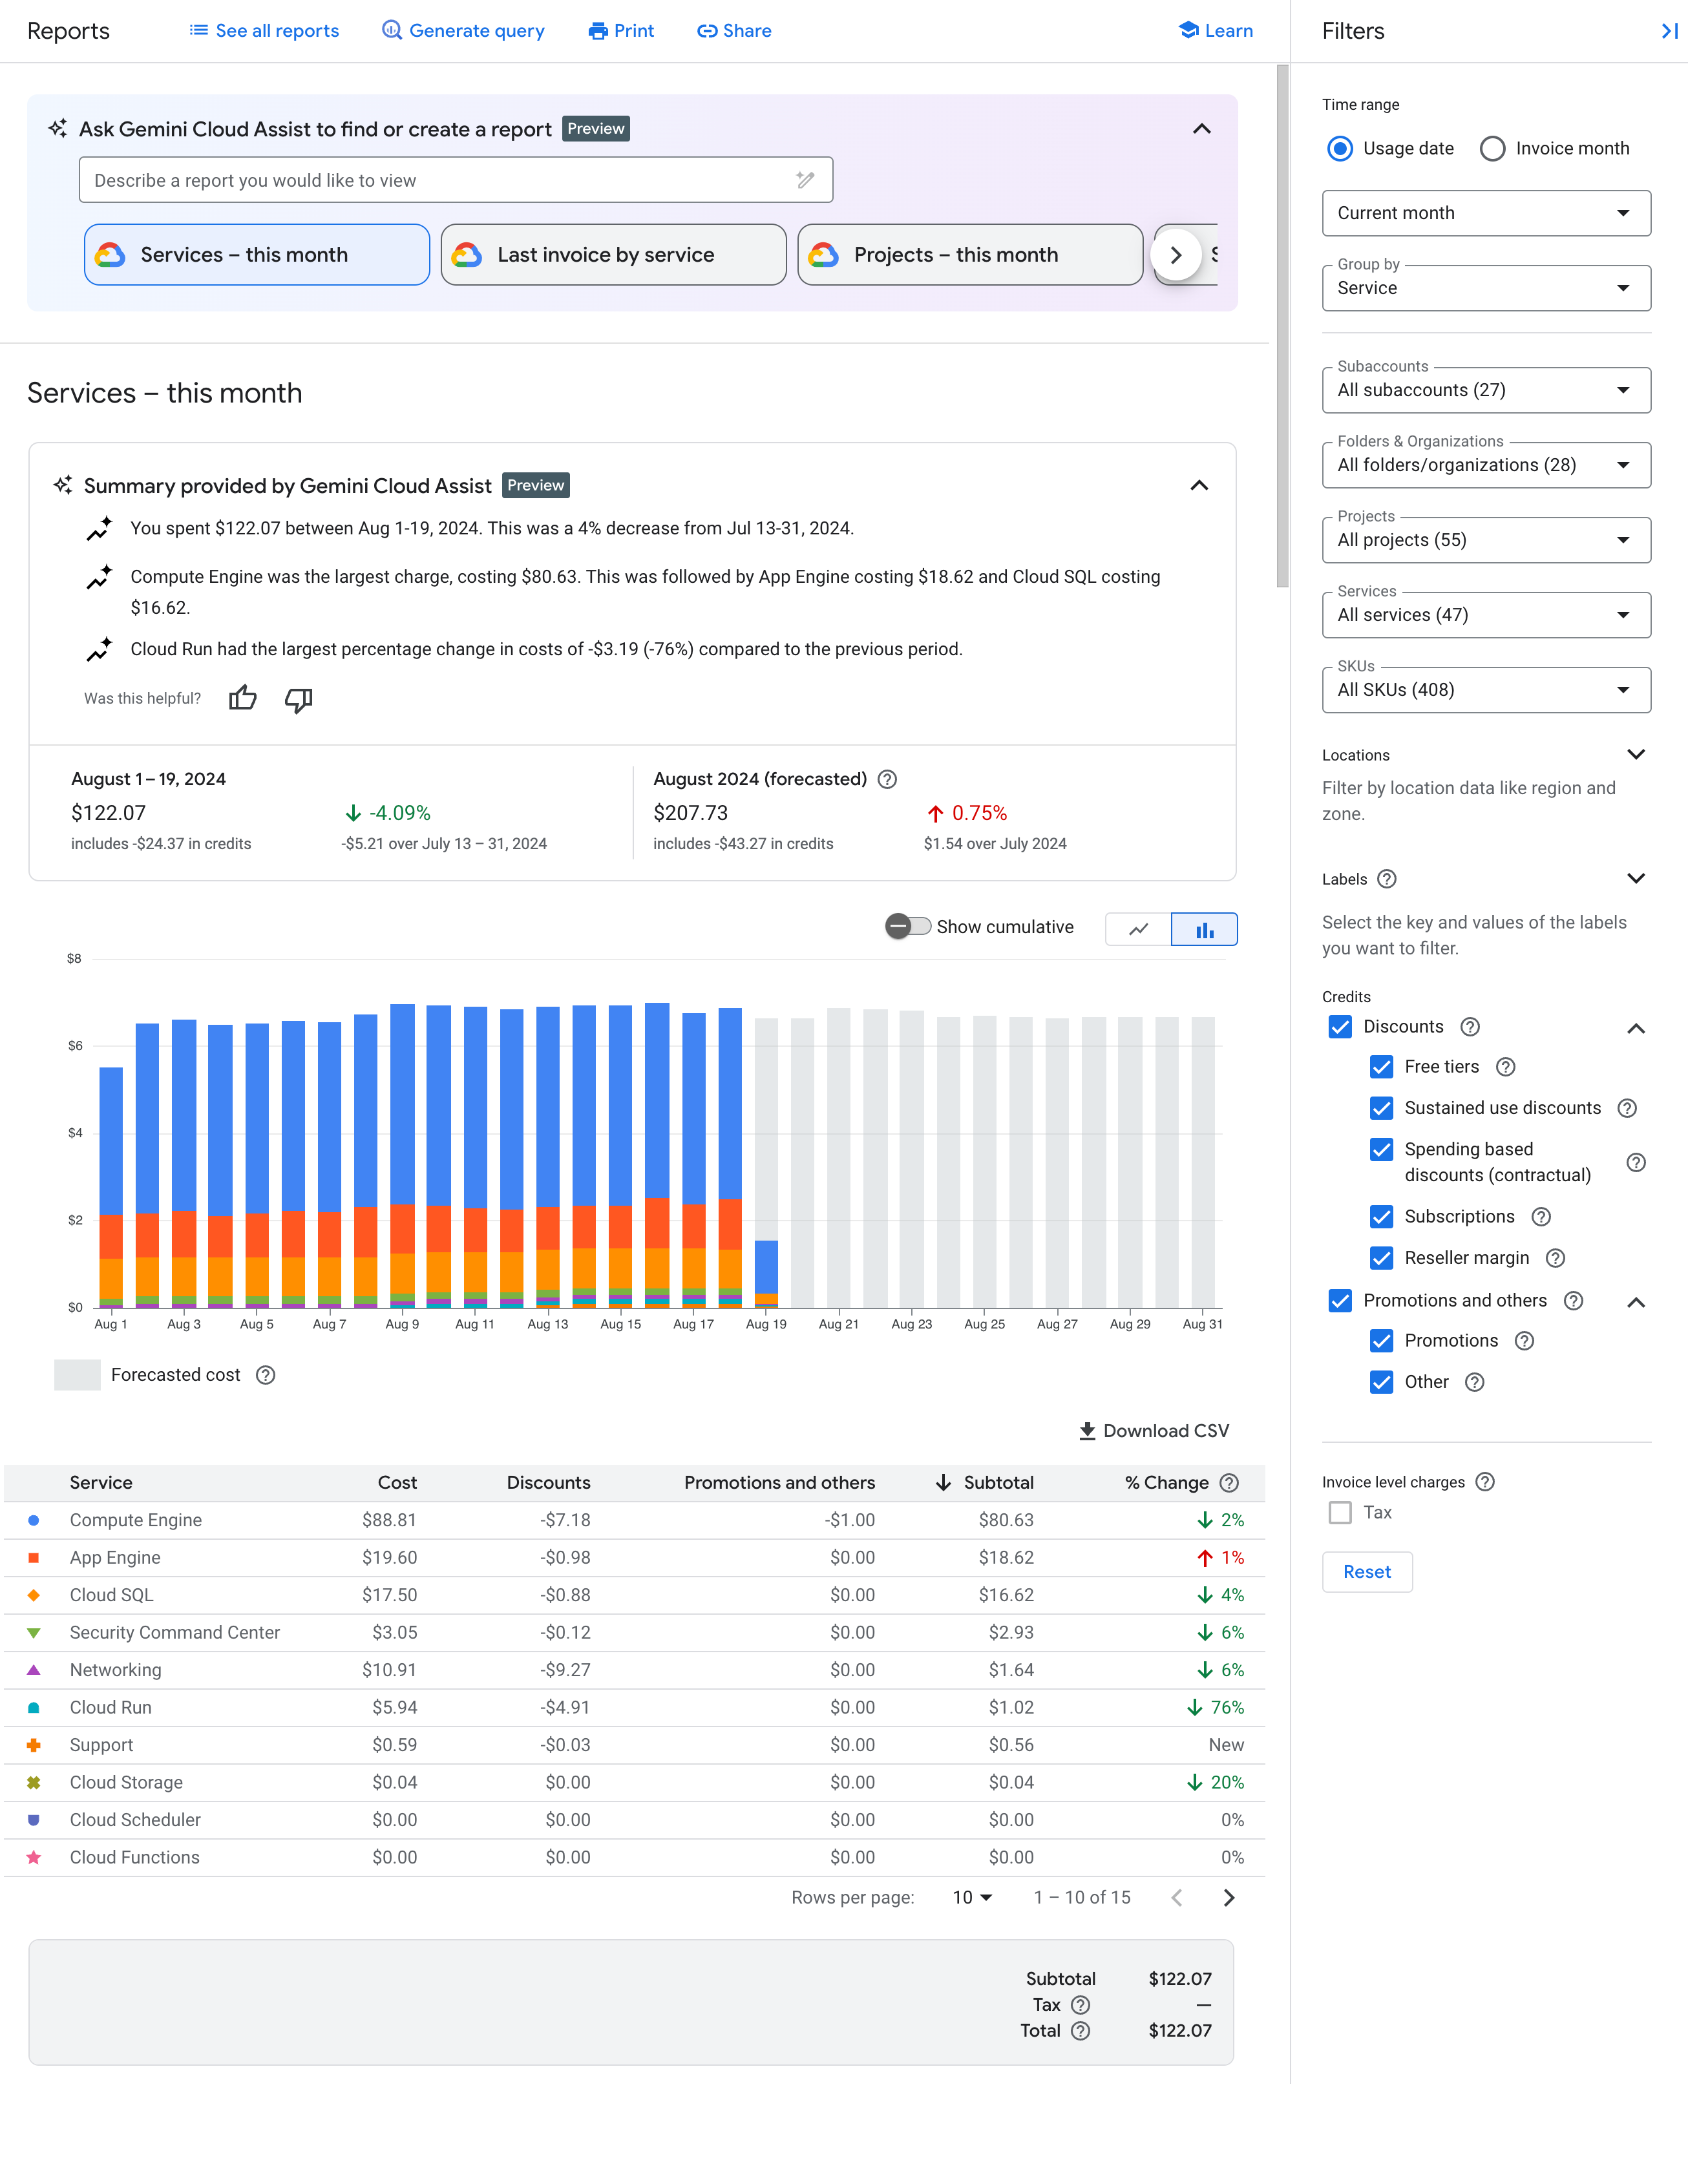
The Cloud console Billing reports provide billing and related cost information for the project you have selected.
The Cloud Billing Reports page lets you view your Google Cloud usage costs for all projects linked to a Cloud Billing account. To help you view the cost trends that are important to you, you can select a data range, specify a time range, configure the chart filters, and group by project, service, SKU, or location.
Cloud Billing reports can help you answer questions like these:
- How is my current month's Google Cloud spending trending?
- What project cost the most last month?
- What are my forecasted future costs based on historical trends?
- How much am I spending by region?
This image shows the Billing report.
Monitoring
Cloud Monitoring collects measurements of your service and of the Google Cloud resources that you use. For example, you can monitor API calls or quota usage over a specified time interval.
Not only can you define custom metrics and charts, but you can also define alerts. Use alerts to send a notification when the performance of a service doesn't meet criteria you define. For example, you can send a notification as an email, text message, to the Cloud console Mobile App, and other options.
Metrics
In Cloud Monitoring:
- A metric describes something that is measured. Examples of metrics include the number of calls to an API, percent of a usage quota consumed, or a virtual machine's CPU utilization.
- A time series is a data structure that contains time-stamped measurements of a metric and information about the source and meaning of those measurements.
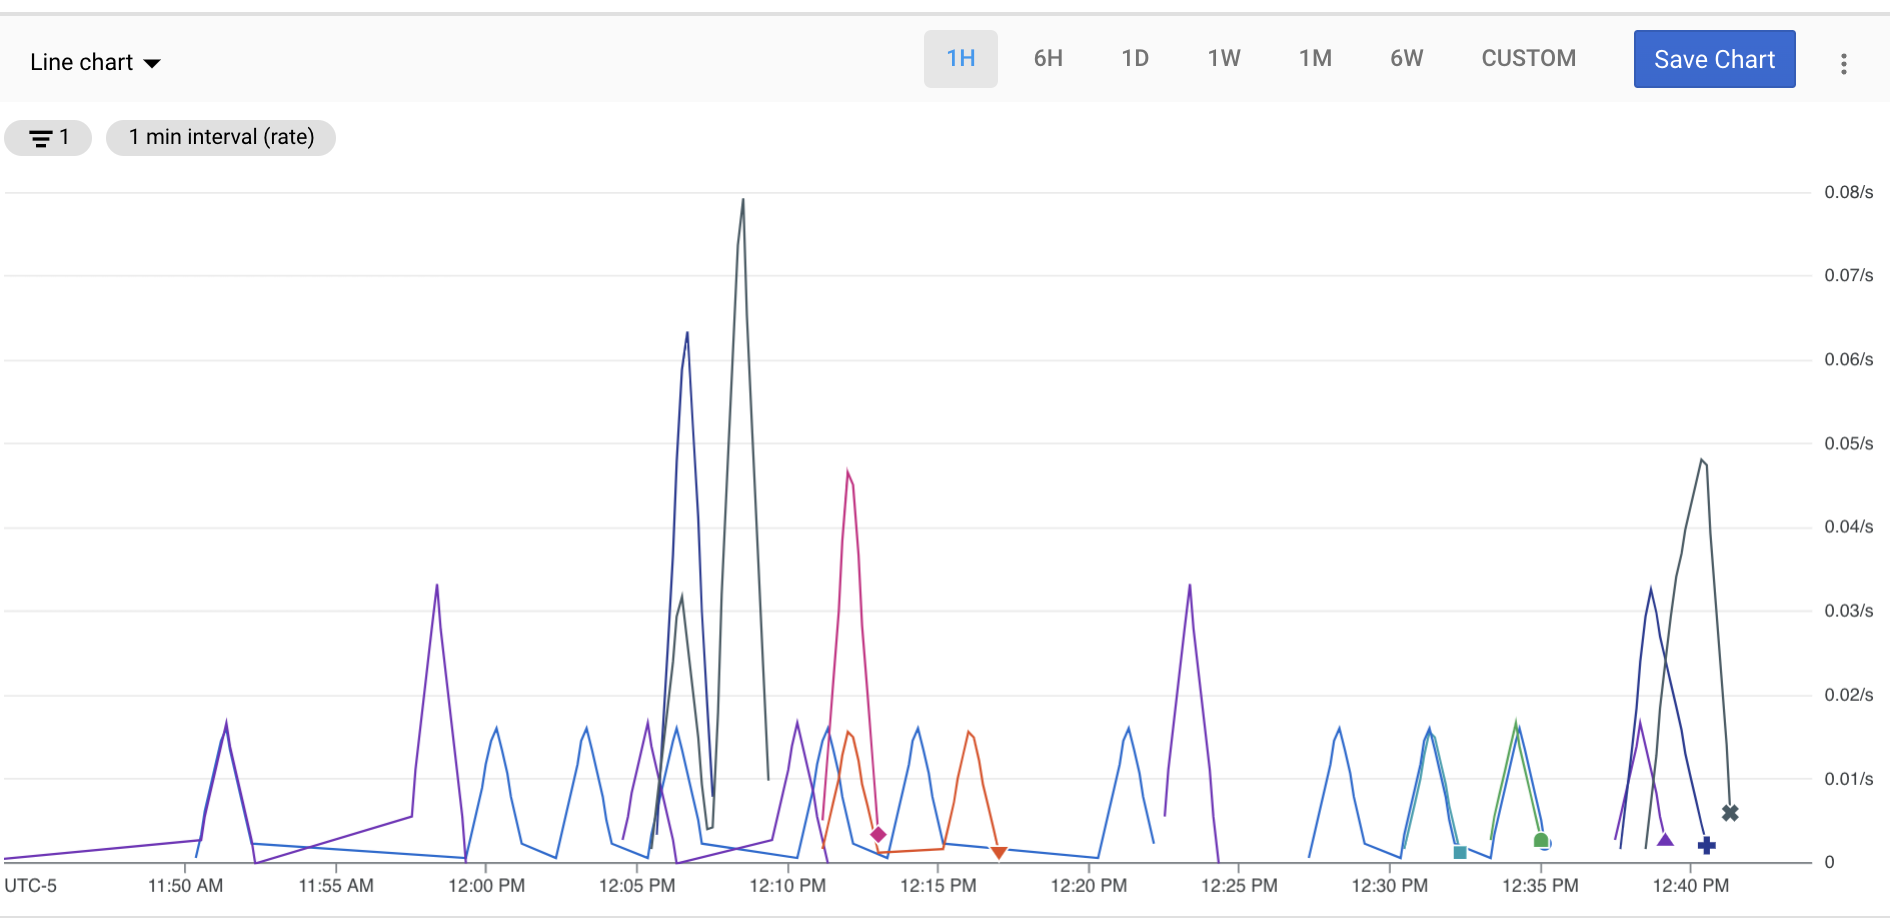
To explore metric data, build a chart with Metrics Explorer. For example, to view the request count of an API in one minute intervals for the past hour, use Metrics Explorer to construct a chart that displays the most recent data.
Dashboards
Dashboards let you view and monitor your time-series data as a collection of charts. To create custom dashboards, you can use the Cloud console or the Cloud Monitoring API.
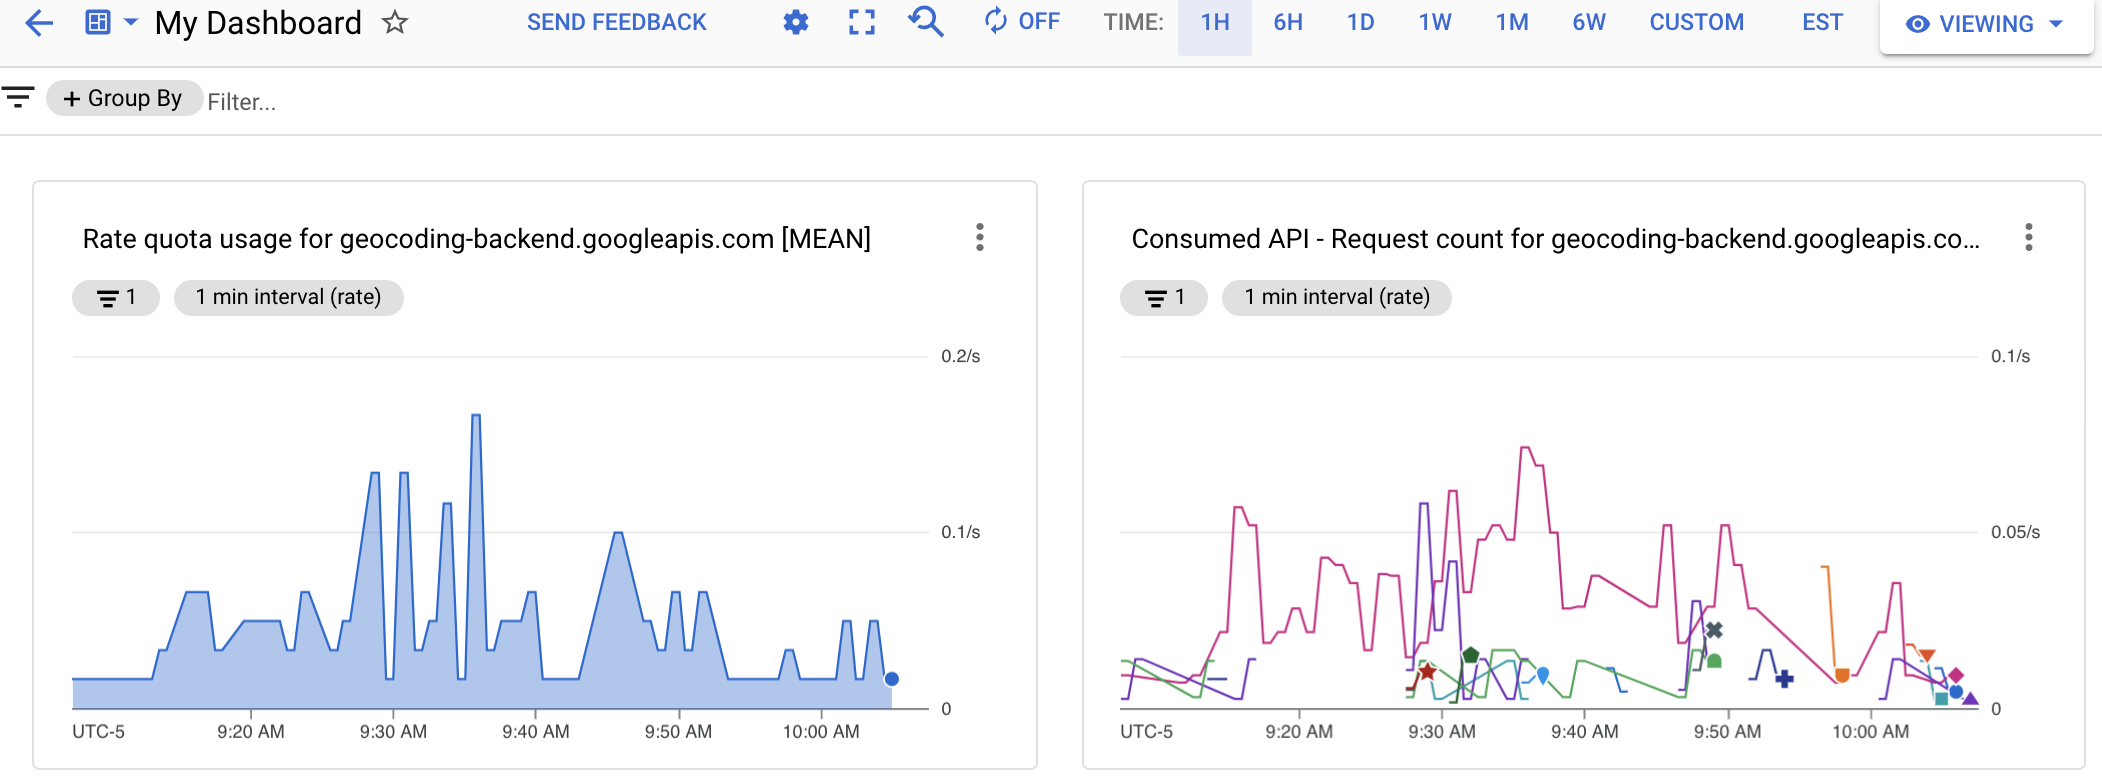
The following image shows a custom dashboard with two charts: a quota chart on the left, and an API count chart on the right.
Alerts
To be notified when the performance of a service doesn't meet criteria you define, create an alerting policy. For example, you can create an alerting policy that notifies your on-call team when the 90th percentile of the latency of HTTP 200 responses from your service exceeds 100 ms.
Alerting gives timely awareness to problems in your cloud applications so you can resolve the problems quickly.
Cloud Monitoring supports many types of alerts such as:
- Metric threshold alerts: Trigger an alert if a metric rises above or falls below a value for a specific duration or a metric increases or decreases by a predefined percentage.
- Budget alerts: Trigger notifications when your costs exceed a percentage of your budget.
- Quota alerts: Trigger notifications when your usage approaches a quota limit.