Stay organized with collections
Save and categorize content based on your preferences.
The Pollen API lets you request pollen data for a specific location.
Pollen data includes regional plant species and pollen types, as well as pollen
index and health recommendations.1 The Pollen API covers over 65 countries
with a resolution of 1 x 1 kilometer (0.6 x 0.6 mile).
The API provides endpoints that let you query:
Forecast: Up to 5-day pollen forecast with daily information, including
pollen index for types of plants.2
Heatmaps: Color-coded tiles of 3 pollen types.
Features of the Pollen API
Daily forecast pollen index and categories: The Pollen API
continuously calculates the value of various pollen types and plant indices
with 1 x 1 kilometer (0.6 x 0.6 mile) resolution.
Health recommendations: Recommended health insights according to the
current pollen levels. Health recommendations are implemented at the plant
type level according to the pollen index level.[^1]
Plant description details: Detailed information for the various species
that relate to the plant and its potential for allergenic effect. The
description includes the following information: type, family, season,
special shapes, special colors, cross reaction, and 2 pictures of each
plant.
Heatmaps: A collection of pollen type index image tiles that can be
displayed on top of Google Maps.
[[["Easy to understand","easyToUnderstand","thumb-up"],["Solved my problem","solvedMyProblem","thumb-up"],["Other","otherUp","thumb-up"]],[["Missing the information I need","missingTheInformationINeed","thumb-down"],["Too complicated / too many steps","tooComplicatedTooManySteps","thumb-down"],["Out of date","outOfDate","thumb-down"],["Samples / code issue","samplesCodeIssue","thumb-down"],["Other","otherDown","thumb-down"]],["Last updated 2025-08-18 UTC."],[[["\u003cp\u003e
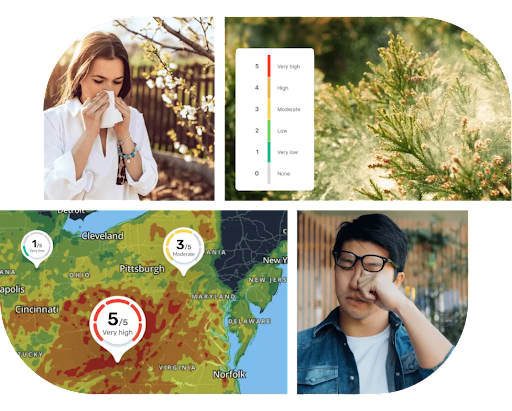
The Pollen API delivers location-specific pollen data, including pollen types, plant species, pollen index, and health recommendations for over 65 countries.\u003c/p\u003e\n"],["\u003cp\u003eThis API offers endpoints for accessing daily pollen forecasts (up to 5 days) and visualizing pollen distribution with heatmaps.\u003c/p\u003e\n"],["\u003cp\u003eFeatures include a daily pollen index, categorized by plant type, health recommendations based on pollen levels, detailed plant descriptions, and heatmaps for visualizing pollen distribution.\u003c/p\u003e\n"],["\u003cp\u003eYou can access daily pollen forecast data and heatmap tiles through dedicated endpoints after setting up your Google Cloud project.\u003c/p\u003e\n"]]],[],null,["The Pollen API lets you request pollen data for a specific location.\nPollen data includes regional plant species and pollen types, as well as pollen\nindex and health recommendations.^[1](#fn1)^ The Pollen API covers over 65 countries\nwith a resolution of 1 x 1 kilometer (0.6 x 0.6 mile).\n\nThe API provides endpoints that let you query:\n\n- **Forecast:** Up to 5-day pollen forecast with daily information, including\n pollen index for types of plants.^[2](#fn2)^\n\n- **Heatmaps:** Color-coded tiles of 3 pollen types.\n\nFeatures of the Pollen API\n\n- **Daily forecast pollen index and categories:** The Pollen API\n continuously calculates the value of various pollen types and plant indices\n with 1 x 1 kilometer (0.6 x 0.6 mile) resolution.\n\n- **Health recommendations:** Recommended health insights according to the\n current pollen levels. Health recommendations are implemented at the plant\n type level according to the pollen index level.\\[\\^1\\]\n\n- **Plant description details:** Detailed information for the various species\n that relate to the plant and its potential for allergenic effect. The\n description includes the following information: type, family, season,\n special shapes, special colors, cross reaction, and 2 pictures of each\n plant.\n\n- **Heatmaps:** A collection of pollen type index image tiles that can be\n displayed on top of Google Maps.\n\nPollen API country and region coverage\n\nSee [Pollen API supported countries and plants](/maps/documentation/pollen/coverage) for\nthe latest coverage details, on a country-by-country basis, for which pollen and\nplant information is available.\n\nHow to use the Pollen API\n\n|---|-------------------------------------------|----------------------------------------------------------------------------------------------------------------------------------|\n| 1 | **Get set up** | Start with [Set up your Google Cloud project](/maps/documentation/pollen/cloud-setup) and complete the instructions that follow. |\n| 2 | **Get daily pollen forecast information** | See [Get forecast](/maps/documentation/pollen/forecast). |\n| 3 | **Get heatmap tiles** | See [Get heatmap tiles](/maps/documentation/pollen/heatmap-tiles). |\n\nWhat's next\n\n- [Set up your Google Cloud project](/maps/documentation/pollen/cloud-setup)\n- [Get forecast](/maps/documentation/pollen/forecast)\n- [Get heatmap tiles](/maps/documentation/pollen/heatmap-tiles)\n\n*** ** * ** ***\n\n1.\n | **Note:** The [World Health Organization](https://iris.who.int/bitstream/handle/10665/345329/9789240034228-eng.pdf) and other regional authoritative sources identify AQI categories (color and range) for sensitive populations. Our Air Quality and Pollen APIs provide data and recommendations based on those sources. We do not process health data or personalize for end users.\n2. The number of forecast days may vary between locations and plant species. [↩](#fnref2)"]]