
Page Summary
-
The
heatmapTilesendpoint delivers air quality heatmaps as a tile overlay, which is a collection of PNG images displayed on top of a Google Map. -
Each tile within the overlay has specific (X, Y) coordinates, with (0,0) at the northwest corner and increasing values eastward (X) and southward (Y), determined by the zoom level.
-
The zoom level (0-16) controls the map's scale and the tile grid size, with higher zoom levels showing more detailed areas.
-
To request a heatmap tile, you need to provide the heatmap type, zoom level (Z), tile coordinates (X, Y), and your API key in the request URL.
-
You can overlay these heatmap tiles on top of the default map using methods described in the provided documentation for a comprehensive air quality visualization.
The
heatmapTiles
endpoint provides air quality related heatmaps through a tile overlay. A tile
overlay is a collection of PNG image tiles that can be displayed on top of a
Google Maps. Each image tile is (256 x 256 pixels).
About heatmap tiles
The tile overlay is a grid assembled from a collection of tiles,
each assigned (X,Y) coordinates.
The tile with coordinates (0,0) is always at the northwest corner
of the map. The X values increase from west to east,
while the Y values increase from north to south.
The zoom level determines how large or small the contents of a map appear in a
map view. The tile grid size is determined by scaling the X and Y
coordinates exponentially by the zoom level.
gridSizeX = XzoomLevel
gridSizeY = YzoomLevel
For example, at a zoom level of 2, the world map is represented using a 4 x 4 matrix, for a total of 16 tiles. The zoom also determines what is the max value allowed for the coordinates.
The following image shows a US_AQI heatmap with a zoom level of 2,
along with the coordinates of each tile:

See Map and Tile coordinates for additional details.
About the heatmap endpoint
A heatmap tile is represented by a bytes array containing the tile data as a PNG
image. You request current air quality heatmap tiles using the
heatmapTiles
endpoint by sending an HTTP GET request to:
https://airquality.googleapis.com/v1/mapTypes/TYPE/heatmapTiles/Z/X/Y?key=YOUR_API_KEY
All request parameters are required in a request:
TYPE- The type heatmap to return. See allowed values.Z- Zoom level that determines how large or small the contents of a map appear in a map view. Allowed values are 0-16, where a value of 0 displays the entire world in a single tile.X,Y- The coordinates of the tile to retrieve, relative to the north west corner (0,0).Xvalues are increasing from west to east andYvalues are increasing from north to south.Tile coordinates have to be valid for the specified zoom level. For example, if you set the zoom level to 2, and request a tile at coordinates of 10,10, the API returns an error.
YOUR_API_KEY- Your application's API key. This key identifies your application for purposes of quota management. For more information, see get a key.
Example heatmap request
The image above shows a US_AQI heatmap with a zoom level of 2,
along with the coordinates of each tile. The following example uses the
heatmapTiles endpoint to request the tile at coordinates 0,1 from the
heatmap:
https://airquality.googleapis.com/v1/mapTypes/US_AQI/heatmapTiles/2/0/1?key=YOUR_API_KEY
The tile appears as:
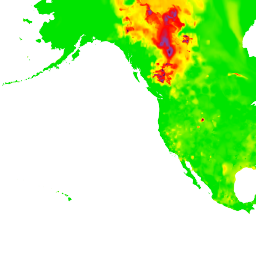
For more information on overlaying tiles on top of the default map, see Overlay Map Types.