
The Billing reports page is a reporting feature in the Google Cloud console. It provides customizable analysis of your past and current expenditures on Google Maps Platform and Google Cloud, as well as the tools necessary to understand your charges and reconcile your bill.
Cloud Billing Reports can help you answer any of the following questions:
- How does my current month's spend compare to last month's?
- What Google Maps service is responsible for the most spend?
- How much am I spending in a particular region?
- How much am I saving from committed use discounts, and could I save more?
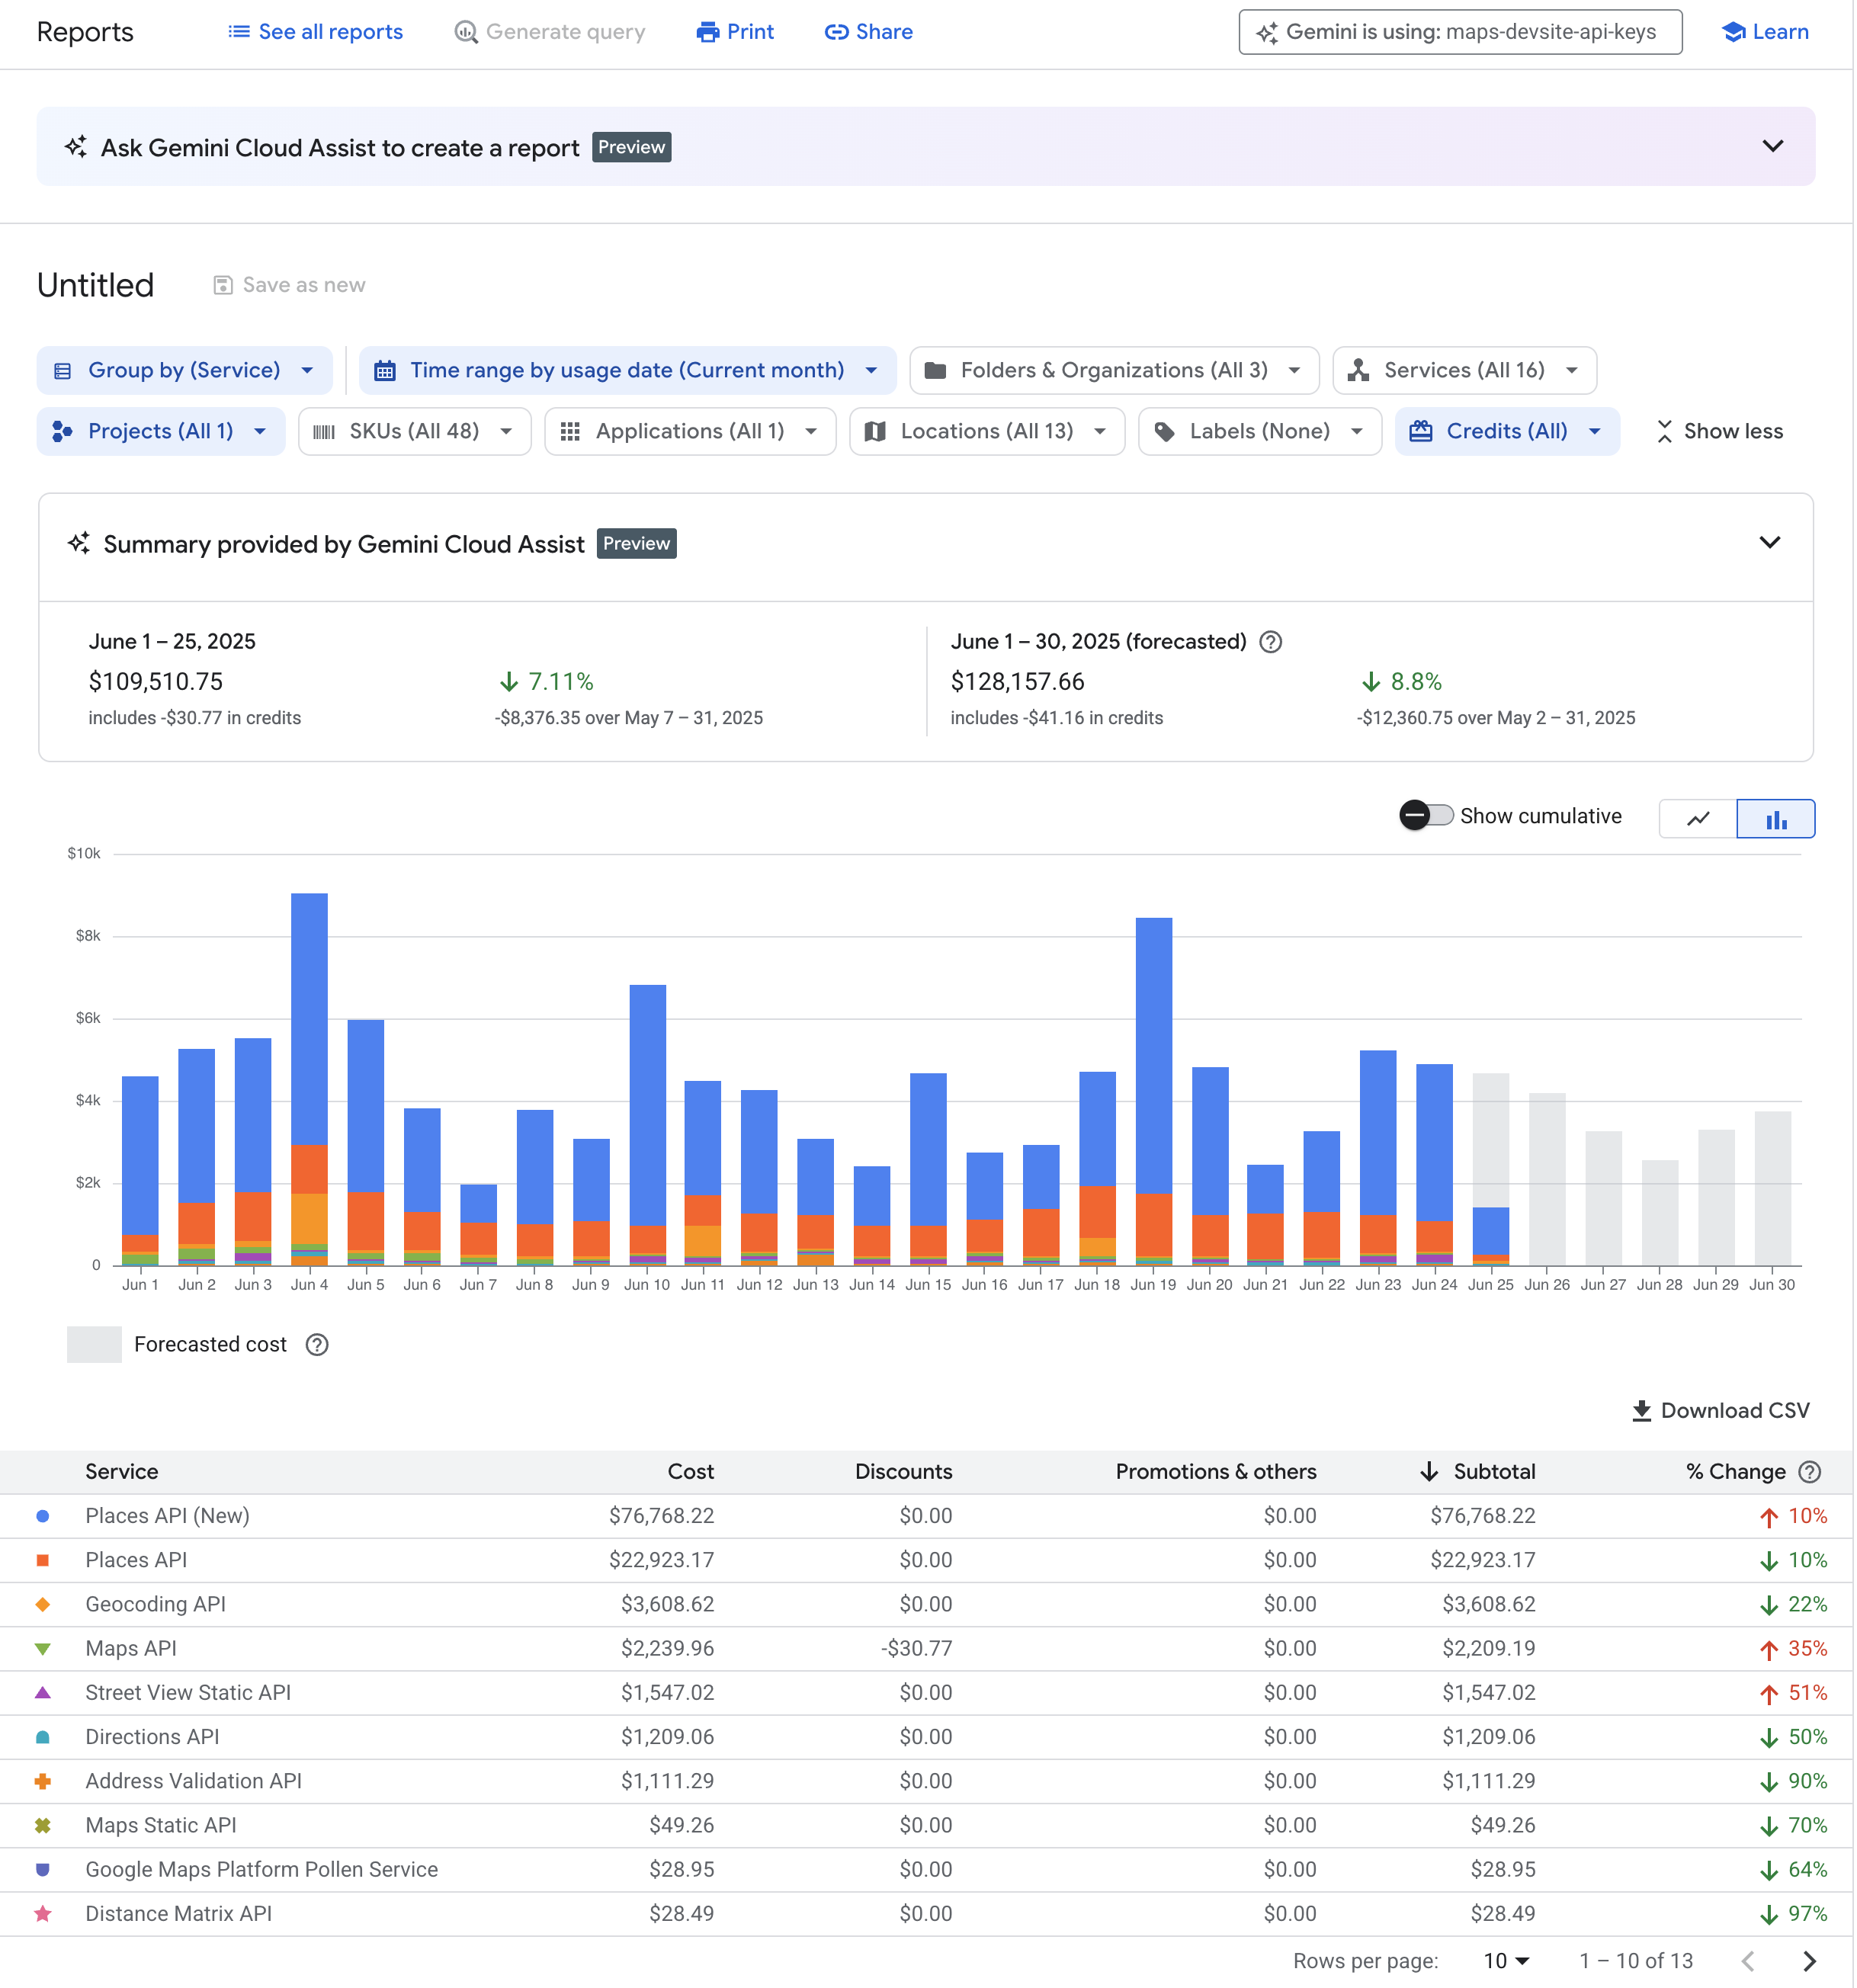
The following image shows the billing reports page.
For an interactive tour of the billing reports page in the console, launch the billing reports tour.
View billing reports
Predefined reports
The Google Cloud console provides a number of predefined reports. These predefined reports are designed to cover most use cases, and can be extended and customized to provide more granular reporting data.
The Google Cloud console provides the following reports:
Billing report
The billing report lets you view and analyze usage costs using many customizable settings and filters.
For daily reporting, a 24-hour time period in the Cloud Billing report begins at midnight US and Canadian Pacific Time (UTC-8). It also observes daylight saving time shifts in the United States.
Learn more about the billing report
Cost table report
Invoice and statement cost analysis
The cost table report offers detailed invoice and statement information. It includes project-level cost breakdowns, tax costs per project, and details like service IDs, SKU IDs, and project numbers. This report is customizable and downloadable as a CSV.
Learn more about the cost table report
Cost breakdown report
Monthly cost and savings overview
The cost breakdown report gives you a summarized view of monthly charges and credits, including:
- On-demand Google Cloud usage costs (at non-discounted list prices).
- Savings from custom contract pricing.
- Usage-based credit savings (such as committed use, sustained use, free tier).
- Invoice-level charges like tax and adjustments.
Learn more about the cost breakdown report
Pricing report
Google Cloud console service pricing
The pricing table report provides SKU prices for Google Cloud, Google Maps Platform, and Google Workspace, current as of the viewing date.
This report displays:
- SKU prices specific to your Cloud Billing account.
- List price, contract price, and effective discount for accounts with custom pricing.
- Each pricing tier as a separate row for SKUs with tiered pricing.
- All prices in your billing account currency.
The report is customizable and downloadable as a CSV for offline analysis.
Learn more about the pricing report
Committed use discounts (CUD) analysis reports
Understand your discounts
CUDs provide discounted prices for eligible Google Cloud resources when you purchase committed use contracts requiring you to commit to either using a minimum level of resources or spending a minimum amount for a term duration of one or three years.
The CUD analysis reports help you visualize and understand the effectiveness and financial impact of your purchased CUDs.
These reports answer key questions related to the following topics:
- Bill savings from CUDs.
- Utilization of existing commitments.
- Coverage of eligible usage by commitments.
- Opportunities for further savings by increasing commitments.
- Improved utilization through discount sharing.
Learn more about the committed use discounts (CUD) analysis reports
For a full list of available reports, see Cloud billing reports.
Custom reports
You can set up custom reporting based on your exported billing data using BigQuery. To do this, you must enable the Cloud Billing export to BigQuery service, which automatically uploads your data to a BigQuery dataset.
Once your data is in BigQuery, you can run queries against it, or use tools like Looker Studio to create custom visualizations.