Page Summary
-
This module explores neural networks, a model architecture designed to automatically identify nonlinear patterns in data, eliminating the need for manual feature cross experimentation.
-
You will learn the fundamental components of a deep neural network, including nodes, hidden layers, and activation functions, and how they contribute to prediction.
-
The module covers the training process of neural networks, using the backpropagation algorithm to optimize predictions and minimize loss.
-
Additionally, you will gain insights into how neural networks handle multi-class classification problems using one-vs.-all and one-vs.-one approaches.
-
This module builds on prior knowledge of machine learning concepts such as linear and logistic regression, classification, and working with numerical and categorical data.
You may recall from the Feature cross exercises in the Categorical data module, that the following classification problem is nonlinear:
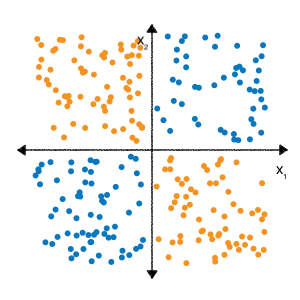
"Nonlinear" means that you can't accurately predict a label with a model of the form \(b + w_1x_1 + w_2x_2\). In other words, the "decision surface" is not a line.
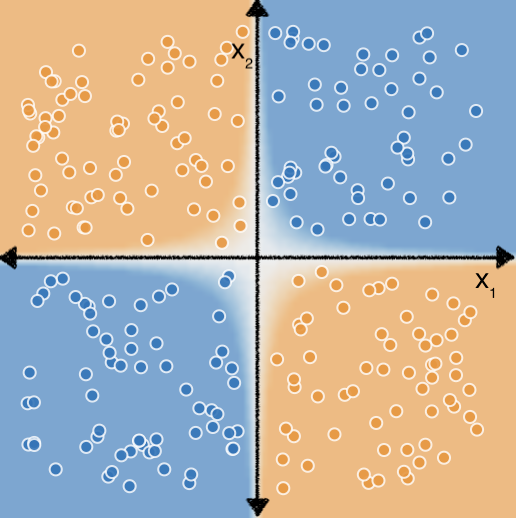
However, if we perform a feature cross on our features $x_1$ and $x_2$, we can then represent the nonlinear relationship between the two features using a linear model: $b + w_1x_1 + w_2x_2 + w_3x_3$ where $x_3$ is the feature cross between $x_1$ and $x_2$:
Now consider the following dataset:
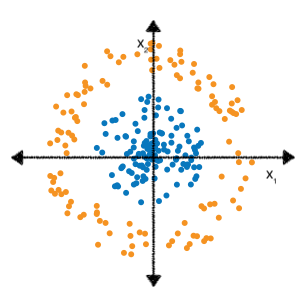
You may also recall from the Feature cross exercises that determining the correct feature crosses to fit a linear model to this data took a bit more effort and experimentation.
But what if you didn't have to do all that experimentation yourself? Neural networks are a family of model architectures designed to find nonlinear patterns in data. During training of a neural network, the model automatically learns the optimal feature crosses to perform on the input data to minimize loss.
In the following sections, we'll take a closer look at how neural networks work.