Datasets tagged climate in Earth Engine
با مجموعهها، منظم بمانید
ذخیره و طبقهبندی محتوا براساس اولویتهای شما.
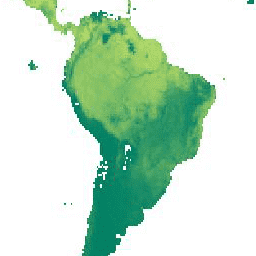
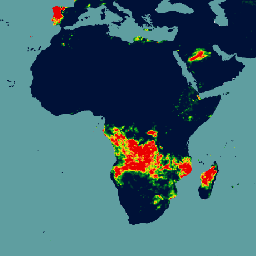
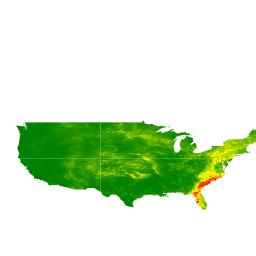
شبیهساز سیستم تنفس زمین (BESS) تابش نسخه ۱
شبیهساز سیستم تنفس زمین (BESS) یک مدل سادهشده مبتنی بر فرآیند است که انتقال تابشی جو و تاج پوشش، فتوسنتز تاج پوشش، تعرق و تعادل انرژی را با هم ترکیب میکند. این مدل یک مدل انتقال تابشی جو و شبکه عصبی مصنوعی را با نیروهای حاصل از محصولات جوی MODIS ترکیب میکند تا محصولات روزانه ۵ کیلومتری تولید کند. ...
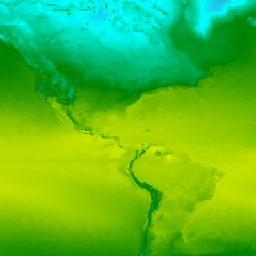
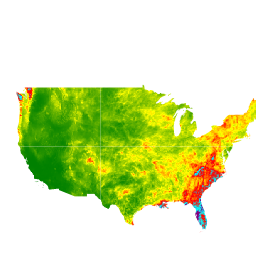
CFSR: بازتحلیل هماهنگشدهی سامانهی پیشبینی آب و هوا
بازتحلیل سامانه پیشبینی اقلیمی (CFSR) مرکز ملی پیشبینیهای زیستمحیطی (NCEP) به عنوان یک سامانه جهانی، با وضوح بالا و جفتشده جو-اقیانوس-خشکی-سطح-یخ دریا طراحی و اجرا شد تا بهترین تخمین از وضعیت این حوزههای جفتشده را در طول دوره ۳۲ ساله ثبت از ژانویه ... ارائه دهد.
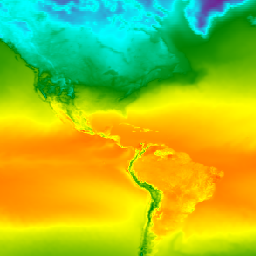
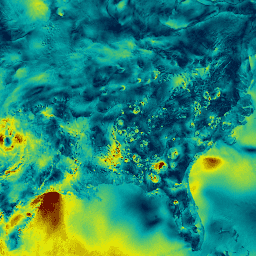
CFSV2: سیستم پیشبینی آب و هوای NCEP نسخه ۲، محصولات ۶ ساعته هماهنگ شدهاند
سیستم پیشبینی آب و هوا (CFS) مرکز ملی پیشبینیهای زیستمحیطی (NCEP) یک مدل کاملاً جفتشده است که نشاندهنده تعامل بین جو زمین، اقیانوسها، خشکی و یخ دریا است. CFS در مرکز مدلسازی زیستمحیطی (EMC) در NCEP توسعه داده شد. CFS عملیاتی به ... ارتقا یافت.
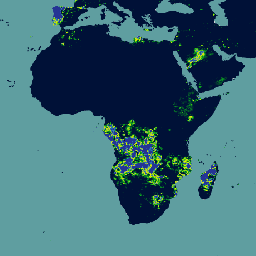
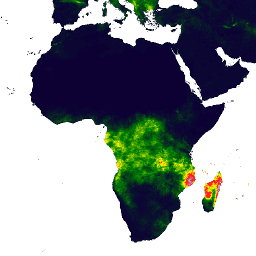
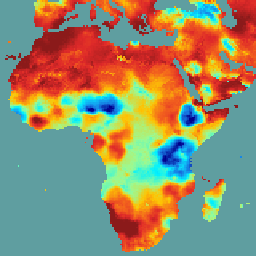
بارش روزانه نزدیک به زمان واقعی CHIRP: مرکز مخاطرات اقلیمی، بارش مادون قرمز با دادههای ایستگاه (نسخه ۳.۰، مبتنی بر IMERG)
مرکز مخاطرات اقلیمی بارش مادون قرمز با ایستگاهها (CHIRPS نسخه ۳) یک مجموعه داده بارش شبه جهانی با وضوح بالا و با دوره زمانی بیش از ۴۰ سال است. این مجموعه داده از ۶۰ درجه شمالی تا ۶۰ درجه جنوبی را پوشش میدهد و تمام طولهای جغرافیایی را پوشش میدهد و دادههایی از سال ۱۹۸۱ تا به امروز ارائه میدهد. CHIRPS نسخه ۳ تخمینهای بارش مادون قرمز حرارتی مبتنی بر ماهواره را با مشاهدات ایستگاههای محلی ترکیب میکند...
تحلیل مجدد روزانه بارش CHIRP: مرکز مخاطرات اقلیمی بارش مادون قرمز با دادههای ایستگاه (نسخه 3.0، مبتنی بر ERA5)
مرکز مخاطرات اقلیمی بارش مادون قرمز با ایستگاهها (CHIRPS نسخه ۳) یک مجموعه داده بارش شبه جهانی با وضوح بالا و با دوره زمانی بیش از ۴۰ سال است. این مجموعه داده از ۶۰ درجه شمالی تا ۶۰ درجه جنوبی را پوشش میدهد و تمام طولهای جغرافیایی را پوشش میدهد و دادههایی از سال ۱۹۸۱ تا به امروز ارائه میدهد. CHIRPS نسخه ۳ تخمینهای بارش مادون قرمز حرارتی مبتنی بر ماهواره را با مشاهدات ایستگاههای محلی ترکیب میکند...
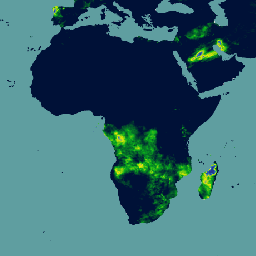
بارش روزانه CHIRP: مرکز مخاطرات اقلیمی، بارش مادون قرمز با دادههای ایستگاه (نسخه ۲.۰ نهایی)
مرکز مخاطرات اقلیمی بارش مادون قرمز با دادههای ایستگاه (CHIRPS) یک مجموعه داده بارش شبه جهانی 30+ ساله است. CHIRPS تصاویر ماهوارهای با وضوح 0.05 درجه را با دادههای ایستگاههای مستقر در محل ترکیب میکند تا سریهای زمانی بارش شبکهای را برای تجزیه و تحلیل روند و پایش خشکسالی فصلی ایجاد کند.
پنجگانه بارش CHIRPS: مرکز مخاطرات اقلیمی، بارش مادون قرمز با دادههای ایستگاه (نسخه ۲.۰ نهایی)
مرکز مخاطرات اقلیمی بارش مادون قرمز با دادههای ایستگاه (CHIRPS) یک مجموعه داده بارش شبه جهانی 30+ ساله است. CHIRPS تصاویر ماهوارهای با وضوح 0.05 درجه را با دادههای ایستگاههای مستقر در محل ترکیب میکند تا سریهای زمانی بارش شبکهای را برای تجزیه و تحلیل روند و پایش خشکسالی فصلی ایجاد کند.
پنجگانه بارش CHIRPS: مرکز مخاطرات اقلیمی، بارش مادون قرمز با دادههای ایستگاه (نسخه ۳.۰)
مرکز مخاطرات اقلیمی بارش مادون قرمز با ایستگاهها (CHIRPS نسخه ۳) یک مجموعه داده بارش شبه جهانی با وضوح بالا و با دوره زمانی بیش از ۴۰ سال است. این مجموعه داده از ۶۰ درجه شمالی تا ۶۰ درجه جنوبی را پوشش میدهد و تمام طولهای جغرافیایی را پوشش میدهد و دادههایی از سال ۱۹۸۱ تا به امروز ارائه میدهد. CHIRPS نسخه ۳ تخمینهای بارش مادون قرمز حرارتی مبتنی بر ماهواره را با مشاهدات ایستگاههای محلی ترکیب میکند...
دمای روزانه CHIRTS: مرکز مخاطرات آب و هوایی، دمای مادون قرمز به همراه دادههای روزانه ایستگاهها
محصول دادههای دمای روزانه مادون قرمز مرکز مخاطرات اقلیمی با ایستگاهها (CHIRTS-daily؛ Verdin و همکاران، 2020) یک مجموعه داده شبکهای تقریباً جهانی و با وضوح بالا (وضوح 0.05° × 0.05°، 60°S - 70°N) است که حداقل (Tmin) و حداکثر دمای 2 متری (Tmax) روزانه و چهار متغیر مشتق شده را ارائه میدهد: بخار اشباع ...
این مجموعه دادهها، تجزیه و تحلیل شبکهای از دمای روزانه هوای سطح زمین در مناطق خشکی جهان، از جمله دمای حداکثر (Tmax) و حداقل (Tmin) روزانه را ارائه میدهد. این دادهها که از سال ۱۹۷۹ تا به امروز را پوشش میدهند، بر روی شبکههای عرض/طول جغرافیایی ۰.۵ درجهای ارائه شدهاند که با وضوح دادههای روزانه جهانی مبتنی بر پیمانه CPC مطابقت دارند...
سرویس پایش جو کوپرنیک (CAMS) جهانی تقریباً بلادرنگ
سرویس پایش جو کوپرنیک، ظرفیتی را برای پایش مداوم ترکیب جو زمین در مقیاسهای جهانی و منطقهای فراهم میکند. سیستم اصلی تولید تقریباً بلادرنگ جهانی، مجموعهای از دادههای جمعآوری و پیشبینی است که دو پیشبینی ۵ روزه در روز برای آئروسلها و مواد شیمیایی ارائه میدهد...
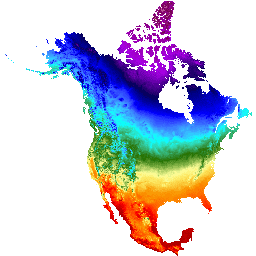
Daymet V4: خلاصههای روزانه آب و هوای سطحی و اقلیمی
نسخه چهارم نرمافزار Daymet، تخمینهای شبکهای از پارامترهای آب و هوای روزانه برای آمریکای شمالی قارهای، هاوایی و پورتوریکو ارائه میدهد (دادههای پورتوریکو از سال ۱۹۵۰ در دسترس است). این نرمافزار از دادههای ایستگاههای هواشناسی منتخب و منابع داده پشتیبان مختلف استخراج شده است. در مقایسه با نسخه قبلی، Daymet ...
دو مجموعه داده مرتبط FAO در مورد خاکهای آلی زهکشیشده، تخمینهایی از موارد زیر ارائه میدهند: DROSA-A: مساحت خاکهای آلی (برحسب هکتار) که برای فعالیتهای کشاورزی (زمینهای زراعی و مراتع چراگاه) زهکشی شدهاند. DROSE-A: تخمین کربن (C) و اکسید نیتروژن (N2O) (برحسب گیگاگرم) از زهکشی کشاورزی خاکهای آلی تحت ...
این مجموعه دادهها شامل پیشبینیهای ۱۵ روزه از متغیرهای مدل جوی تولید شده توسط سیستم پیشبینی یکپارچه ECMWF (IFS) با وضوح ۰.۲۵ درجه است. ما به این موارد به عنوان پیشبینیهای نزدیک به زمان واقعی (NRT) اشاره میکنیم زیرا محصولات جدید دو بار در روز پس از انتشار پیشبینی زمان واقعی ECMWF منتشر میشوند...
پیشبینیهای موج IFS نزدیک به لحظه (کوتاهمدت) ECMWF
این مجموعه دادهها شامل پیشبینیهای ۶ روزه از میدانهای مدل موج تولید شده توسط سیستم پیشبینی یکپارچه ECMWF (IFS) با وضوح ۰.۲۵ درجه است. ما به این موارد به عنوان پیشبینیهای نزدیک به زمان واقعی (NRT) اشاره میکنیم زیرا محصولات جدید دو بار در روز پس از انتشار پیشبینی زمان واقعی ECMWF منتشر میشوند...
این مجموعه دادهها شامل پیشبینیهای ۱۵ روزه از میدانهای مدل موج تولید شده توسط سیستم پیشبینی یکپارچه ECMWF (IFS) با وضوح ۰.۲۵ درجه است. ما به این موارد، پیشبینیهای نزدیک به زمان واقعی (NRT) میگوییم زیرا محصولات جدید دو بار در روز پس از انتشار پیشبینی زمان واقعی ECMWF منتشر میشوند...
دادههای روزانه ERA5 - آخرین بازتحلیل اقلیمی تولید شده توسط ECMWF / سرویس تغییرات اقلیمی کوپرنیک
ERA5 نسل پنجم بازتحلیل جوی ECMWF از آب و هوای جهانی است. بازتحلیل، دادههای مدل را با مشاهدات از سراسر جهان در یک مجموعه داده کامل و سازگار جهانی ترکیب میکند. ERA5 جایگزین نسخه قبلی خود، بازتحلیل ERA-Interim، شده است. ERA5 DAILY مقادیر تجمیعی را برای هر روز برای ... ارائه میدهد.
ERA5 نسل پنجم بازتحلیل جوی ECMWF از آب و هوای جهانی است. این بازتحلیل توسط سرویس تغییرات اقلیمی کوپرنیک (C3S) در ECMWF تولید میشود. بازتحلیل، دادههای مدل را با مشاهدات از سراسر جهان در یک مجموعه داده کامل و سازگار جهانی با استفاده از قوانین ... ترکیب میکند.
ERA5 نسل پنجم بازتحلیل جوی ECMWF از آب و هوای جهانی است. بازتحلیل، دادههای مدل را با مشاهدات از سراسر جهان در یک مجموعه داده کامل و سازگار جهانی ترکیب میکند. ERA5 جایگزین نسخه قبلی خود، بازتحلیل ERA-Interim، شده است. این مجموعه داده شامل پارامترهای سهبعدی در ۳۷ سطح فشار است.
دادههای ماهانه ERA5 - آخرین تحلیلهای مجدد اقلیمی تهیه شده توسط ECMWF / سرویس تغییرات اقلیمی کوپرنیک
ERA5 نسل پنجم بازتحلیل جوی ECMWF از آب و هوای جهانی است. بازتحلیل، دادههای مدل را با مشاهدات از سراسر جهان در یک مجموعه داده کامل و سازگار جهانی ترکیب میکند. ERA5 جایگزین نسخه قبلی خود، بازتحلیل ERA-Interim، شده است. ERA5 MONTHLY مقادیر تجمیعی را برای هر ماه برای ... ارائه میدهد.
ERA5-Land Daily Aggregated - تحلیل مجدد آب و هوا ECMWF
ERA5-Land یک مجموعه داده بازتحلیل است که دیدگاهی منسجم از تکامل متغیرهای زمین در طول چندین دهه با وضوح بهبود یافته در مقایسه با ERA5 ارائه میدهد. ERA5-Land با بازپخش مؤلفه زمین از بازتحلیل اقلیمی ECMWF ERA5 تولید شده است. بازتحلیل، دادههای مدل را با ... ترکیب میکند.
ERA5-Land یک مجموعه داده بازتحلیل است که دیدگاهی منسجم از تکامل متغیرهای زمین در طول چندین دهه با وضوح بهبود یافته در مقایسه با ERA5 ارائه میدهد. ERA5-Land با بازپخش مؤلفه زمین از بازتحلیل اقلیمی ECMWF ERA5 تولید شده است. بازتحلیل، دادههای مدل را با ... ترکیب میکند.
ERA5-Land ماهانه تجمیع شده - تحلیل مجدد آب و هوا ECMWF
ERA5-Land یک مجموعه داده بازتحلیل است که دیدگاهی منسجم از تکامل متغیرهای زمین در طول چندین دهه با وضوح بهبود یافته در مقایسه با ERA5 ارائه میدهد. ERA5-Land با بازپخش مؤلفه زمین از بازتحلیل اقلیمی ECMWF ERA5 تولید شده است. بازتحلیل، دادههای مدل را با ... ترکیب میکند.
میانگین ماهانه ERA5-Land بر اساس ساعت روز - تحلیل مجدد آب و هوا ECMWF
ERA5-Land یک مجموعه داده بازتحلیل است که دیدگاهی منسجم از تکامل متغیرهای زمین در طول چندین دهه با وضوح بهبود یافته در مقایسه با ERA5 ارائه میدهد. ERA5-Land با بازپخش مؤلفه زمین از بازتحلیل اقلیمی ECMWF ERA5 تولید شده است. بازتحلیل، دادههای مدل را با ... ترکیب میکند.
ERA5-Land یک مجموعه داده بازتحلیل است که دیدگاهی منسجم از تکامل متغیرهای زمین در طول چندین دهه با وضوح بهبود یافته در مقایسه با ERA5 ارائه میدهد. ERA5-Land با بازپخش مؤلفه زمین از بازتحلیل اقلیمی ECMWF ERA5 تولید شده است. بازتحلیل، دادههای مدل را با ... ترکیب میکند.
FLDAS: شبکه سیستمهای هشدار زودهنگام قحطی (FEWS NET) سیستم جذب دادههای زمینی
مجموعه دادههای FLDAS (مکنالی و همکاران، ۲۰۱۷) برای کمک به ارزیابی امنیت غذایی در کشورهای در حال توسعه و کمجمعیت طراحی شده است. این مجموعه شامل اطلاعاتی در مورد بسیاری از متغیرهای مرتبط با آب و هوا از جمله میزان رطوبت، نم، تبخیر و تعرق، میانگین دمای خاک، میزان کل بارندگی و غیره است. چندین مجموعه داده مختلف FLDAS وجود دارد؛ ...
مجموعه دادههای Farmscapes 2020 نقشههای احتمال با وضوح بالا (25 سانتیمتر) را برای سه ویژگی نیمه طبیعی کلیدی در مناظر کشاورزی انگلستان ارائه میدهد: پرچینها، جنگلها و دیوارهای سنگی. این مجموعه دادهها با همکاری مرکز بازیابی طبیعت Leverhulme در آکسفورد توسعه داده شده است تا به عنوان پایهای برای کاربردها عمل کند...
این نسخه برداری شده از مجموعه داده رستری Farmscapes 2020 است. این مجموعه، هندسههای چندضلعی را ارائه میدهد که نمایانگر ویژگیهای چشمانداز نیمه طبیعی در مقیاس ریز (به ویژه پرچینها، جنگلها و دیوارهای سنگی) در سراسر مناظر کشاورزی انگلستان هستند. این مجموعه داده با همکاری مرکز بازیابی طبیعت آکسفورد لورهولم توسعه داده شده است تا ...
مجموعه داده گونهشناسی جنگل (ForTy) نسخه ۱ شامل یک نقشه احتمال جهانی برای هر کلاس با وضوح ۱۰ متر است که تمام مناطق زمینی بین عرض جغرافیایی ۶۵ درجه جنوبی و ۸۴ درجه شمالی را برای سال ۲۰۲۰ پوشش میدهد. این گونهشناسی شش کلاسه با تعاریف FAO و مقررات جنگلزدایی اتحادیه اروپا (EUDR) مطابقت دارد: کلاس ۱ ...
این محصول، دمای سطح زمین است. نسخه جدیدتر JAXA/GCOM-C/L3/LAND/LST/V3 نیز برای این مجموعه داده موجود است که از این الگوریتم برای پردازش استفاده میکند. GCOM-C مشاهدات و جمعآوری دادههای جهانی طولانیمدت و مداوم را برای روشن کردن مکانیسم نوسانات بودجه تابش و ... انجام میدهد.
این محصول، دمای سطح زمین است. برای دادههای پس از 2021-11-28، به مجموعه دادههای V3 مراجعه کنید. GCOM-C مشاهدات و جمعآوری دادههای جهانی بلندمدت و مداوم را برای روشن کردن مکانیسم نوسانات بودجه تابش و چرخه کربن مورد نیاز برای پیشبینیهای دقیق در مورد ... انجام میدهد.
این محصول، دمای سطح زمین است. این یک مجموعه داده مداوم با تأخیر ۳-۴ روزه است. GCOM-C مشاهدات و جمعآوری دادههای جهانی طولانیمدت و مداوم را برای روشن کردن مکانیسم نوسانات بودجه تابش و چرخه کربن مورد نیاز برای ایجاد ... انجام میدهد.
این محصول دمای سطح دریا است. نسخه جدیدتر JAXA/GCOM-C/L3/OCEAN/SST/V3 نیز برای این مجموعه داده موجود است که از این الگوریتم برای پردازش استفاده میکند. GCOM-C مشاهدات و جمعآوری دادههای جهانی طولانیمدت و مداوم را برای روشن کردن مکانیسم نوسانات بودجه تابش و کربن انجام میدهد...
این محصول دمای سطح دریا است. برای دادههای پس از 2021-11-28، به مجموعه دادههای V3 مراجعه کنید. GCOM-C مشاهدات و جمعآوری دادههای جهانی طولانیمدت و مداوم را برای روشن کردن مکانیسم نوسانات بودجه تابش و چرخه کربن مورد نیاز برای پیشبینیهای دقیق در مورد آینده انجام میدهد...
این محصول دمای سطح دریا است. این یک مجموعه داده مداوم با تأخیر ۳-۴ روزه است. GCOM-C مشاهدات و جمعآوری دادههای جهانی طولانیمدت و مداوم را برای روشن کردن مکانیسم نوسانات بودجه تابش و چرخه کربن مورد نیاز برای تصمیمگیری دقیق انجام میدهد...
GFS: دادههای پیشبینیشده ۳۸۴ ساعته جو توسط سامانه پیشبینی جهانی
سیستم پیشبینی جهانی (GFS) یک مدل پیشبینی آب و هوا است که توسط مراکز ملی پیشبینی محیطی (NCEP) تولید شده است. مجموعه دادههای GFS شامل خروجیهای مدل انتخاب شده (که در زیر شرح داده شده است) به عنوان متغیرهای پیشبینی شبکهای است. پیشبینیهای ۳۸۴ ساعته، با ۱ ساعت (تا ۱۲۰ ساعت) و ۳ ساعت (بعد از ...
سیستم جذب دادههای جهانی زمین ناسا نسخه ۲ (GLDAS-2) دارای سه جزء است: GLDAS-2.0، GLDAS-2.1 و GLDAS-2.2. GLDAS-2.0 کاملاً با دادههای ورودی نیروی هواشناسی پرینستون ادغام شده و یک سری زمانی سازگار از سال ۱۹۴۸ تا ۲۰۱۴ ارائه میدهد. GLDAS-2.1 با ترکیبی از مدل ... ادغام شده است.
سیستم جذب دادههای جهانی زمین ناسا نسخه ۲ (GLDAS-2) دارای سه جزء است: GLDAS-2.0، GLDAS-2.1 و GLDAS-2.2. GLDAS-2.0 کاملاً با دادههای ورودی نیروی هواشناسی پرینستون ادغام شده و یک سری زمانی سازگار از سال ۱۹۴۸ تا ۲۰۱۴ ارائه میدهد. GLDAS-2.1 با ترکیبی از مدل ... ادغام شده است.
اندازهگیری بارش جهانی (GPM) یک ماموریت ماهوارهای بینالمللی است که هر سه ساعت یکبار مشاهدات نسل بعدی باران و برف را در سراسر جهان ارائه میدهد. بازیابیهای چند ماهوارهای یکپارچه برای GPM (IMERG) الگوریتم یکپارچهای است که تخمینهای بارندگی را با ترکیب دادههای تمام ابزارهای مایکروویو غیرفعال در GPM ارائه میدهد...
تولید نسخه نهایی IMERG با نام "06" در سپتامبر 2021 متوقف شد. انتظار میرود نسخه "07" در سپتامبر 2022 منتشر شود. اندازهگیری بارش جهانی (GPM) یک ماموریت ماهوارهای بینالمللی است که مشاهدات نسل بعدی باران و برف را در سراسر جهان هر سه ساعت یکبار ارائه میدهد. بازیابیهای یکپارچه چند ماهوارهای برای ...
اندازهگیری بارش جهانی (GPM) یک ماموریت ماهوارهای بینالمللی است که هر سه ساعت یکبار مشاهدات نسل بعدی باران و برف را در سراسر جهان ارائه میدهد. بازیابیهای چند ماهوارهای یکپارچه برای GPM (IMERG) الگوریتم یکپارچهای است که تخمینهای بارندگی را با ترکیب دادههای تمام ابزارهای مایکروویو غیرفعال در GPM ارائه میدهد...
این مجموعه دادهها شامل شاخصهای خشکسالی مشتق شده از مجموعه دادههای هواشناسی سطحی شبکهبندی شده روزانه ۴ کیلومتری (GRIDMET) است. شاخصهای خشکسالی ارائه شده شامل شاخص بارش استاندارد (SPI)، شاخص تقاضای خشکسالی تبخیری (EDDI)، شاخص تبخیر و تعرق استاندارد شده بارش (SPEI)، شاخص شدت خشکسالی پالمر (PDSI) و پالمر ...
GRIDMET: مجموعه دادههای هواشناسی سطحی شبکهبندیشده دانشگاه آیداهو
مجموعه دادههای هواشناسی سطح شبکهای، میدانهای سطحی روزانه با وضوح مکانی بالا (حدود ۴ کیلومتر) از دما، بارش، بادها، رطوبت و تابش را در سراسر ایالات متحده از سال ۱۹۷۹ ارائه میدهد. این مجموعه دادهها، دادههای مکانی با وضوح بالای PRISM را با دادههای با وضوح زمانی بالا از ... ترکیب میکند.
GSMaP عملیاتی: نقشهبرداری ماهوارهای جهانی بارش - نسخه ۶
نقشهبرداری ماهوارهای جهانی بارش (GSMaP) نرخ بارش ساعتی جهانی را با وضوح 0.1 در 0.1 درجه ارائه میدهد. GSMaP محصولی از ماموریت اندازهگیری بارش جهانی (GPM) است که مشاهدات بارش جهانی را در فواصل سه ساعته ارائه میدهد. مقادیر با استفاده از دادههای غیرفعال چند باندی تخمین زده میشوند...
GSMaP عملیاتی: نقشهبرداری ماهوارهای جهانی از بارش - نسخه ۷
نقشهبرداری ماهوارهای جهانی بارش (GSMaP) نرخ بارش ساعتی جهانی را با وضوح 0.1 در 0.1 درجه ارائه میدهد. GSMaP محصولی از ماموریت اندازهگیری بارش جهانی (GPM) است که مشاهدات بارش جهانی را در فواصل سه ساعته ارائه میدهد. مقادیر با استفاده از دادههای غیرفعال چند باندی تخمین زده میشوند...
GSMaP عملیاتی: نقشهبرداری ماهوارهای جهانی از بارش - نسخه ۸
نقشهبرداری ماهوارهای جهانی بارش (GSMaP) نرخ بارش ساعتی جهانی را با وضوح 0.1 در 0.1 درجه ارائه میدهد. GSMaP محصولی از ماموریت اندازهگیری بارش جهانی (GPM) است که مشاهدات بارش جهانی را در فواصل سه ساعته ارائه میدهد. مقادیر با استفاده از دادههای غیرفعال چند باندی تخمین زده میشوند...
تحلیل مجدد GSMaP: نقشهبرداری ماهوارهای جهانی از بارش
نقشهبرداری ماهوارهای جهانی بارش (GSMaP) نرخ بارش ساعتی جهانی را با وضوح 0.1 در 0.1 درجه ارائه میدهد. GSMaP محصولی از ماموریت اندازهگیری بارش جهانی (GPM) است که مشاهدات بارش جهانی را در فواصل سه ساعته ارائه میدهد. مقادیر با استفاده از دادههای غیرفعال چند باندی تخمین زده میشوند...
از زمان معرفی آنها در سال ۲۰۱۲، مناطق اقلیمی محلی (LCZs) به عنوان استاندارد جدیدی برای توصیف مناظر شهری پدیدار شدهاند و یک رویکرد طبقهبندی جامع ارائه میدهند که پوشش زمین در مقیاس خرد و ویژگیهای فیزیکی مرتبط را در نظر میگیرد. این نقشه جهانی از مناطق اقلیمی محلی، با اندازه پیکسل ۱۰۰ متر و ...
آرشیو بهترین آهنگهای بینالمللی برای پروژه مدیریت آب و هوا
آرشیو بینالمللی بهترین مسیر برای نظارت بر آب و هوا (IBTrACS) مکان و شدت طوفانهای گرمسیری جهانی را ارائه میدهد. دادهها از دهه ۱۸۴۰ تاکنون را شامل میشوند و عموماً دادهها را در فواصل ۳ ساعته ارائه میدهند. در حالی که بهترین دادههای مسیر بر موقعیت و شدت (حداکثر باد پایدار ...) متمرکز هستند.
روز LST: دمای سطح زمین در طول روز (۸ کیلومتر در روز) با شکاف دمایی پر شده توسط پروژه اطلس مالاریا
دمای سطح زمین (LST) در طول روز از محصولات MODIS MOD11A2 v6.1 با برد تقریبی ۱ کیلومتر استخراج میشوند. دادههای ترکیبی ۸ روزه به درجه سانتیگراد تبدیل شده و سپس با استفاده از رویکردی که در Weiss و همکاران (۲۰۱۴) مطرح شده است، شکافها پر میشوند تا دادههای از دست رفته ناشی از عواملی مانند پوشش ابر حذف شوند. ...
روز LST: دمای سطح زمین در طول روز (سالانه از کیلومتر) با شکاف دمایی پروژه اطلس مالاریا
دمای سطح زمین (LST) در طول روز از محصولات MODIS MOD11A2 v6.1 با برد تقریبی ۱ کیلومتر استخراج میشوند. دادههای ترکیبی ۸ روزه به درجه سانتیگراد تبدیل شده و سپس با استفاده از رویکردی که در Weiss و همکاران (۲۰۱۴) مطرح شده است، شکافها پر میشوند تا دادههای از دست رفته ناشی از عواملی مانند پوشش ابر حذف شوند. ...
روز LST: دمای سطح زمین در طول روز (ماهانه ۱ کیلومتر) با شکافهای دمایی پروژه اطلس مالاریا
دمای سطح زمین (LST) در طول روز از محصولات MODIS MOD11A2 v6.1 با برد تقریبی ۱ کیلومتر استخراج میشوند. دادههای ترکیبی ۸ روزه به درجه سانتیگراد تبدیل شده و سپس با استفاده از رویکردی که در Weiss و همکاران (۲۰۱۴) مطرح شده است، شکافها پر میشوند تا دادههای از دست رفته ناشی از عواملی مانند پوشش ابر حذف شوند. ...
شب LST: دمای سطح زمین در طول شب (۸ روز از ۱ کیلومتر) - شکاف دمایی پروژه اطلس مالاریا
دمای سطح زمین در شب (LST) از محصولات MODIS MOD11A2 v6.1 با برد تقریبی ۱ کیلومتر استخراج میشوند. دادههای ترکیبی ۸ روزه به درجه سانتیگراد تبدیل شده و سپس با استفاده از رویکردی که در Weiss و همکاران (۲۰۱۴) مطرح شده است، شکافها پر میشوند تا دادههای از دست رفته ناشی از عواملی مانند پوشش ابر حذف شوند. ...
شب LST: دمای سطح زمین در شب (سالانه از 1 کیلومتر) - شکاف دمایی پروژه اطلس مالاریا
دمای سطح زمین در شب (LST) از محصولات MODIS MOD11A2 v6.1 با برد تقریبی ۱ کیلومتر استخراج میشوند. دادههای ترکیبی ۸ روزه به درجه سانتیگراد تبدیل شده و سپس با استفاده از رویکردی که در Weiss و همکاران (۲۰۱۴) مطرح شده است، شکافها پر میشوند تا دادههای از دست رفته ناشی از عواملی مانند پوشش ابر حذف شوند. ...
شب LST: دمای سطح زمین در شب (ماهانه ۱ کیلومتر) - پروژه اطلس مالاریا - پر از شکاف
دمای سطح زمین در شب (LST) از محصولات MODIS MOD11A2 v6.1 با برد تقریبی ۱ کیلومتر استخراج میشوند. دادههای ترکیبی ۸ روزه به درجه سانتیگراد تبدیل شده و سپس با استفاده از رویکردی که در Weiss و همکاران (۲۰۱۴) مطرح شده است، شکافها پر میشوند تا دادههای از دست رفته ناشی از عواملی مانند پوشش ابر حذف شوند. ...
خلاصههای ماهانه MACAv2-METDATA: دانشگاه آیداهو، آنالوگهای ساختهشده تطبیقی چندمتغیره که در مدلهای اقلیمی جهانی به کار گرفته شدهاند
مجموعه داده MACAv2-METDATA مجموعهای از 20 مدل آب و هوایی جهانی است که مرزهای ایالات متحده را پوشش میدهد. روش آنالوگهای ساخته شده تطبیقی چند متغیره (MACA) یک روش کوچکمقیاسسازی آماری است که از یک مجموعه داده آموزشی (یعنی یک مجموعه داده مشاهدات هواشناسی) برای حذف سوگیریهای تاریخی و تطبیق الگوهای مکانی استفاده میکند...
MACAv2-METDATA: دانشگاه آیداهو، آنالوگهای ساختهشده تطبیقی چندمتغیره که در مدلهای اقلیمی جهانی به کار گرفته شدهاند
مجموعه داده MACAv2-METDATA مجموعهای از 20 مدل آب و هوایی جهانی است که مرزهای ایالات متحده را پوشش میدهد. روش آنالوگهای ساخته شده تطبیقی چند متغیره (MACA) یک روش کوچکمقیاسسازی آماری است که از یک مجموعه داده آموزشی (یعنی یک مجموعه داده مشاهدات هواشناسی) برای حذف سوگیریهای تاریخی و تطبیق الگوهای مکانی استفاده میکند...
MCD18A1 نسخه 6.2 یک طیفسنج تصویربرداری با وضوح متوسط (MODIS) است که توسط ماهوارههای Terra و Aqua با ترکیب تابش موج کوتاه رو به پایین (DSR) و با شبکهبندی سطح 3 تولید میشود و روزانه با وضوح پیکسلی 1 کیلومتر و تخمین DSR هر 3 ساعت یکبار تولید میشود. DSR تابش خورشیدی فرودی بر روی سطوح زمین است...
MCD18C2 نسخه 6.2 یک طیفسنج تصویربرداری با وضوح متوسط (MODIS) است که توسط ماهوارههای Terra و Aqua با ترکیب تابش فعال فتوسنتزی (PAR) و با شبکهبندی سطح 3 تولید میشود و روزانه با وضوح 0.05 درجه (5600 متر در خط استوا) و با تخمین PAR هر 3 ساعت یکبار تولید میشود. PAR تابش خورشیدی تابشی است...
M2T1NXFLX (یا tavg1_2d_flx_Nx) یک مجموعه داده با میانگین زمانی ساعتی در تحلیل گذشتهنگر عصر مدرن برای تحقیق و کاربردها نسخه 2 (MERRA-2) است. این مجموعه شامل تشخیص شار سطحی جذبشده، مانند کل بارش، کل بارش تصحیحشده با بایاس، دمای هوای سطح، رطوبت ویژه سطح، سرعت باد سطح و ... است.
M2T1NXLND (یا tavg1_2d_lnd_Nx) یک مجموعه داده با میانگین زمانی ساعتی در تحلیل گذشتهنگر عصر مدرن برای تحقیق و کاربردها نسخه 2 (MERRA-2) است. این مجموعه شامل تشخیص سطح زمین، مانند شار جریان پایه، رواناب، رطوبت خاک سطحی، رطوبت خاک منطقه ریشه، آب در لایه سطحی، آب در ...
M2T1NXRAD (یا tavg1_2d_rad_Nx) یک مجموعه داده با میانگین زمانی ساعتی در تحلیل گذشتهنگر عصر مدرن برای تحقیق و کاربردها نسخه 2 (MERRA-2) است. این مجموعه شامل تشخیص تشعشع، مانند آلبدو سطح، کسر مساحت ابر، ضخامت نوری در ابر، شار موج کوتاه ورودی سطح (یعنی تابش خورشیدی)، سطح ...
M2T1NXSLV (یا tavg1_2d_slv_Nx) یک مجموعه داده دوبعدی با میانگین زمانی ساعتی در نسخه 2 از نرمافزار Modern-Era Retrospective Analysis for Research and Applications (MERRA-2) است. این مجموعه شامل دادههای هواشناسی تشخیصی در سطوح عمودی پرکاربرد، مانند دمای هوا در ارتفاع 2 متری (یا در ارتفاع 10 متری، 850 هکتوپاسکال، 500 هکتوپاسکال، 250 هکتوپاسکال)، ...
MOD08_M3 V6.1 یک محصول جهانی جو است که شامل مقادیر میانگین شبکهای ماهانه 1 در 1 درجه از پارامترهای جوی است. این پارامترها مربوط به خواص ذرات آئروسل جوی، بار کل ازن، بخار آب جوی، خواص نوری و فیزیکی ابر و شاخصهای پایداری جوی هستند. ...
MOD11A1.061 دمای سطح زمین و ضریب انتشار روزانه جهانی 1 کیلومتر
محصول MOD11A1 V6.1 مقادیر روزانه دمای سطح زمین (LST) و ضریب گسیلندگی را در یک شبکه 1200 در 1200 کیلومتری ارائه میدهد. مقدار دما از محصول نوار MOD11_L2 مشتق شده است. در عرضهای جغرافیایی بالاتر از 30 درجه، برخی از پیکسلها ممکن است چندین مشاهده داشته باشند که در آنها معیارهای آسمان صاف ...
MOD11A2.061 دمای سطح زمین و ضریب انتشار 8 روزه جهانی 1 کیلومتر
محصول MOD11A2 V6.1 میانگین دمای سطح زمین (LST) 8 روزه را در یک شبکه 1200 در 1200 کیلومتری ارائه میدهد. مقدار هر پیکسل در MOD11A2 میانگین سادهای از تمام پیکسلهای LST مربوط به MOD11A1 است که در آن دوره 8 روزه جمعآوری شدهاند. MOD11A2 ...
MOD21A1D.061 دمای سطح زمین Terra و ضریب انتشار سه باند روزانه جهانی 1 کیلومتر
مجموعه دادههای MOD21A1D به صورت روزانه از محصولات LST میانی سطح ۲ شبکهبندی شده (L2G) در طول روز با وضوح مکانی ۱۰۰۰ متر تولید میشود. فرآیند L2G، دانههای نواری روزانه MOD21 را بر روی یک شبکه سینوسی MODIS نگاشت کرده و تمام مشاهداتی را که بر روی یک سلول شبکهبندی شده قرار میگیرند، ذخیره میکند...
MOD21A1N.061 دمای سطح زمین Terra و ضریب انتشار سه باند روزانه جهانی 1 کیلومتر
مجموعه دادههای MOD21A1N به صورت روزانه از محصولات LST سطح ۲ شبکهبندی شده (L2G) با وضوح مکانی ۱۰۰۰ متر تولید میشود. فرآیند L2G، دانههای نواری روزانه MOD21 را بر روی یک شبکه سینوسی MODIS نگاشت کرده و تمام مشاهداتی را که بر روی یک سلول شبکهبندی شده قرار میگیرند، ذخیره میکند...
MOD21C1.061 دمای سطح زمین Terra و ضریب انتشار سه باند روزانه L3 جهانی 0.05 درجه CMG
مجموعه دادههای MOD21C1 به صورت روزانه در یک شبکه مدلسازی اقلیمی (CMG) با زاویه 0.05 درجه (5600 متر در خط استوا) از محصولات LST میانی شبکهبندی شده سطح 2 (L2G) در طول روز تولید میشود. فرآیند L2G، دانههای نواری روزانه MOD21 را بر روی یک شبکه سینوسی MODIS نگاشت کرده و همه ... را ذخیره میکند.
MOD21C2.061 دمای سطح زمین Terra و ضریب انتشار سه بانده 8 روزه L3 Global 0.05 Deg CMG
مجموعه داده MOD21C2 یک محصول LST ترکیبی 8 روزه است که از الگوریتمی مبتنی بر روش میانگینگیری ساده استفاده میکند. این الگوریتم میانگین را از تمام دادههای روزانه MOD21A1D و MOD21A1N بدون ابر از دوره 8 روزه محاسبه میکند. برخلاف مجموعه دادههای MOD21A1 که در آن ...
MOD21C3.061 دمای سطح زمین Terra و ضریب انتشار سه باند ماهانه L3 جهانی 0.05 درجه CMG
مجموعه داده MOD21C3 یک محصول LST ترکیبی ماهانه است که از الگوریتمی مبتنی بر روش میانگینگیری ساده استفاده میکند. این الگوریتم میانگین را از تمام دادههای روزانه MOD21A1D و MOD21A1N بدون ابر از دوره 8 روزه محاسبه میکند. برخلاف مجموعه دادههای MOD21A1 که در آن ...
MYD08_M3 V6.1 is an atmosphere global product that contains monthly 1 x 1 degree grid average values of atmospheric parameters. These parameters are related to atmospheric aerosol particle properties, total ozone burden, atmospheric water vapor, cloud optical and physical properties, and atmospheric stability indices. The …
MYD11A1.061 Aqua Land Surface Temperature and Emissivity Daily Global 1km
The MYD11A1 V6.1 product provides daily land surface temperature (LST) and emissivity values in a 1200 x 1200 kilometer grid. The temperature value is derived from the MYD11_L2 swath product. Above 30 degrees latitude, some pixels may have multiple observations where the criteria for clear-sky …
MYD11A2.061 Aqua Land Surface Temperature and Emissivity 8-Day Global 1km
The MYD11A2 V6.1 product provides an average 8-day land surface temperature (LST) in a 1200 x 1200 kilometer grid. Each pixel value in MYD11A2 is a simple average of all the corresponding MYD11A1 LST pixels collected within that 8 day period. The MYD11A2 does a …
MYD21A1D.061 Aqua Land Surface Temperature and 3-Band Emissivity Daily Global 1km
The MYD21A1D dataset is produced daily from daytime Level 2 Gridded (L2G) intermediate LST products at a spatial resolution of 1,000 meters. The L2G process maps the daily MOD21 swath granules onto a sinusoidal MODIS grid and stores all observations falling over a gridded cell …
MYD21A1N.061 Aqua Land Surface Temperature and 3-Band Emissivity Daily Global 1km
The MYD21A1N dataset is produced daily from nighttime Level 2 Gridded (L2G) intermediate LST products at a spatial resolution of 1,000 meters. The L2G process maps the daily MOD21 swath granules onto a sinusoidal MODIS grid and stores all observations falling over a gridded cell …
MYD21C1.061 Aqua Land Surface Temperature and 3-Band Emissivity Daily L3 Global 0.05 Deg CMG
The MYD21C1 dataset is produced daily in a 0.05 degree (5,600 meters at the equator) Climate Modeling Grid (CMG) from daytime Level 2 Gridded (L2G) intermediate LST products. The L2G process maps the daily MYD21 swath granules onto a sinusoidal MODIS grid and stores all …
MYD21C2.061 Aqua Land Surface Temperature and 3-Band Emissivity 8-Day L3 Global 0.05 Deg CMG
The MYD21C2 dataset is an 8-day composite LST product that uses an algorithm based on a simple averaging method. The algorithm calculates the average from all the cloud free MYD21A1D and MYD21A1N daily acquisitions from the 8-day period. Unlike the MYD21A1 data sets where the …
MYD21C3.061 Aqua Land Surface Temperature and 3-Band Emissivity Monthly L3 Global 0.05 Deg CMG
The MYD21C3 dataset is a monthly composite LST product that uses an algorithm based on a simple averaging method. The algorithm calculates the average from all the cloud free MYD21A1D and MYD21A1N daily acquisitions from the 8-day period. Unlike the MYD21A1 data sets where the …
This dataset provides geospatial data for the total column dry air mole fraction of methane in the atmosphere, "XCH4", as observed by the MethaneAIR imaging spectrometer. XCH4 is defined as the total column amount (number of molecules) of methane ("CH4") divided by the total amount …
This dataset provides geospatial data for the total column dry air mole fraction of methane in the atmosphere, "XCH4", as observed by the MethaneAIR imaging spectrometer. XCH4 is defined as the total column amount (number of molecules) of methane ("CH4") divided by the total amount …
The area emissions model is still in development and not representative of a final product. This dataset provides spatially disaggregated methane emission fluxes (kg/hr) using measurements from MethaneAIR flights focused on oil and gas producing regions throughout the United States. Total emissions for the survey …
This dataset provides data for high-emitting methane point source detections (kg/hr) over 13 oil and gas or coal extraction areas from Colorado, New Mexico, and Texas in the west to Pennsylvania, Ohio, and West Virginia in the east, plus three urban areas (New York City, …
This dataset provides data for high-emitting methane point source detections (kg/hr) over 13 oil and gas or coal extraction areas from Colorado, New Mexico, and Texas in the west to Pennsylvania, Ohio, and West Virginia in the east, plus three urban areas (New York City, …
This early "Public Preview" dataset provides geospatial data for the column-averaged dry-air mole fraction of methane in the atmosphere, "XCH4", retrieved from measurements by the MethaneSAT imaging spectrometer. XCH4 is defined as the total column amount (number of molecules above a unit surface area) of …
The dispersed area emissions model is still in development and not representative of a final product. This early "Public Preview" dataset provides high precision data for methane emissions from dispersed area sources. These emissions data come from the Appalachian, Permian, and Uinta basins in the …
The dispersed area emissions model is still in development and not representative of a final product. This early "Public Preview" dataset provides high precision data for methane emissions from dispersed area sources. These novel measurements demonstrate the importance of quantifying total methane emissions with high …
This early "Public Preview" dataset provides high precision data for methane emissions from discrete point sources. These methane emission fluxes were produced using a point source detection and emissions quantification framework specialized to exploit the high spatial resolution, wide spatial coverage, and high precision of …
NCEP-DOE Reanalysis 2 (Gaussian Grid), Total Cloud Coverage
This collection is no longer being updated. The Model is no longer being updated at the source. NCEP-DOE Reanalysis 2 project is using a state-of-the-art analysis/forecast system to perform data assimilation using past data from 1979 through the previous year.
The NCEP/NCAR Reanalysis Project is a joint project between the National Centers for Environmental Prediction (NCEP, formerly "NMC") and the National Center for Atmospheric Research (NCAR). The goal of this joint effort is to produce new atmospheric analyses using historical data as well as to …
NCEP/NCAR Reanalysis Data, Surface Temperature [deprecated]
The NCEP/NCAR Reanalysis Project is a joint project between the National Centers for Environmental Prediction (NCEP, formerly "NMC") and the National Center for Atmospheric Research (NCAR). The goal of this joint effort is to produce new atmospheric analyses using historical data as well as to …
NCEP/NCAR Reanalysis Data, Water Vapor [deprecated]
The NCEP/NCAR Reanalysis Project is a joint project between the National Centers for Environmental Prediction (NCEP, formerly "NMC") and the National Center for Atmospheric Research (NCAR). The goal of this joint effort is to produce new atmospheric analyses using historical data as well as to …
NEX-DCP30: Ensemble Stats for NASA Earth Exchange Downscaled Climate Projections
The NASA NEX-DCP30 dataset is comprised of downscaled climate scenarios for the conterminous United States that are derived from the General Circulation Model (GCM) runs conducted under the Coupled Model Intercomparison Project Phase 5 (CMIP5, see Taylor et al. 2012) and across the four greenhouse …
NEX-DCP30: NASA Earth Exchange Downscaled Climate Projections
The NASA NEX-DCP30 dataset is comprised of downscaled climate scenarios for the conterminous United States that are derived from the General Circulation Model (GCM) runs conducted under the Coupled Model Intercomparison Project Phase 5 (CMIP5, see Taylor et al. 2012) and across the four greenhouse …
NEX-GDDP-CMIP6: NASA Earth Exchange Global Daily Downscaled Climate Projections
The NEX-GDDP-CMIP6 dataset is comprised of global downscaled climate scenarios derived from the General Circulation Model (GCM) runs conducted under the Coupled Model Intercomparison Project Phase 6 (CMIP6, see Thrasher et al. 2022) and across two of the four "Tier 1" greenhouse gas emissions scenarios …
NEX-GDDP: NASA Earth Exchange Global Daily Downscaled Climate Projections
The NASA NEX-GDDP dataset is comprised of downscaled climate scenarios for the globe that are derived from the General Circulation Model (GCM) runs conducted under the Coupled Model Intercomparison Project Phase 5 (CMIP5, see Taylor et al. 2012) and across two of the four greenhouse …
NLDAS-2: North American Land Data Assimilation System Forcing Fields
Land Data Assimilation System (LDAS) combines multiple sources of observations (such as precipitation gauge data, satellite data, and radar precipitation measurements) to produce estimates of climatological properties at or near the Earth''s surface. This dataset is the primary (default) forcing file (File A) for Phase …
NOAA CDR GRIDSAT-B1: Geostationary IR Channel Brightness Temperature
Note: This dataset has not been updated by the provider since 2024-03-31 due to ongoing infrastructure updates. There is no current timeline for when dataset updates will resume. This dataset provides a high quality Climate Data Record (CDR) of global infrared measurements from geostationary satellites. …
NOAA CDR PATMOSX: Cloud Properties, Reflectance, and Brightness Temperatures, Version 5.3
This dataset provides high quality Climate Data Record (CDR) of multiple cloud properties along with Advanced Very High Resolution Radiometer (AVHRR) Pathfinder Atmospheres Extended (PATMOS-x) brightness temperatures and reflectances. These data have been fitted to a 0.1 x 0.1 equal angle-grid with both ascending and …
Natural Forests of the World 2020, provides a global map of natural forest probability for the year 2020 at a 10-meter resolution. It was developed to support initiatives like the European Union's Deforestation Regulation (EUDR) and other efforts for forest conservation and monitoring. The map …
OpenLandMap Long-term Land Surface Temperature Daytime Monthly Median
Land Surface Temperature daytime monthly mean value 2000-2017. Derived using the data.table package and quantile function in R. For more info about the MODIS LST product see this page. Antarctica is not included. To access and visualize maps outside of Earth Engine, use this page. …
OpenLandMap Long-term Land Surface Temperature Daytime Monthly Standard Deviation
Long-term MODIS LST day-time and night-time temperatures standard deviation at 1 km based on the 2000-2017 time series. Derived using the data.table package and quantile function in R. For more info about the MODIS LST product see this page. Antarctica is not included. To access …
OpenLandMap Long-term Land Surface Temperature Monthly Day-Night Difference
Long-term MODIS LST day-time and night-time differences at 1 km based on the 2000-2017 time series Derived using the data.table package and quantile function in R. For more info about the MODIS LST product see this page. Antarctica is not included. To access and visualize …
Oya is a quasi-global, high-resolution precipitation estimation dataset derived from geostationary (GEO) satellite observations. The Oya model utilizes the full spectrum of visible and infrared (VIS-IR) channels from a constellation of GEO satellites — including GOES-16/18, Meteosat-9/10, and Himawari-8/9 — to generate precipitation estimates covering …
PERSIANN-CDR: Precipitation Estimation From Remotely Sensed Information Using Artificial Neural Networks-Climate Data Record
PERSIANN-CDR is a daily quasi-global precipitation product that spans the period from 1983-01-01 to present. The data is produced quarterly, with a typical lag of three months. The product is developed by the Center for Hydrometeorology and Remote Sensing at the University of California, Irvine …
The PRISM daily and monthly datasets are gridded climate datasets for the conterminous United States, produced by the PRISM Climate Group at Oregon State University. This collection contains both AN81 and AN91 data, indicated by the 'dataset_type' property. Grids are developed using PRISM (Parameter-elevation Regressions …
The PRISM daily and monthly datasets are gridded climate datasets for the conterminous United States, produced by the PRISM Climate Group at Oregon State University. Grids are developed using PRISM (Parameter-elevation Regressions on Independent Slopes Model). PRISM interpolation routines simulate how weather and climate vary …
The PRISM daily and monthly datasets are gridded climate datasets for the conterminous United States, produced by the PRISM Climate Group at Oregon State University. This collection contains both AN81 and AN91 data, as indicated by the 'dataset_type' property. Grids are developed using PRISM (Parameter-elevation …
The Real-Time Mesoscale Analysis (RTMA) is a high-spatial and temporal resolution analysis for near-surface weather conditions. This dataset includes hourly analyses at 2.5 km for CONUS.
Reprocessed GLDAS-2.0: Global Land Data Assimilation System
NASA Global Land Data Assimilation System Version 2 (GLDAS-2) has three components: GLDAS-2.0, GLDAS-2.1, and GLDAS-2.2. GLDAS-2.0 is forced entirely with the Princeton meteorological forcing input data and provides a temporally consistent series from 1948 through 2014. GLDAS-2.1 is forced with a combination of model …
SPEIbase: Standardised Precipitation-Evapotranspiration Index database, Version 2.11
The Global SPEI database (SPEIbase) offers long-time robust information about drought conditions at the global scale, with a 0.5 degree pixel size and monthly cadence. It provides SPEI time scales from 1 to 48 months. The Standardized Precipitation-Evapotranspiration Index (SPEI) expresses, as a standardized variate …
OFFL/L3_CH4 This dataset provides offline high-resolution imagery of methane concentrations. Methane (CH4) is, after carbon dioxide (CO2), the most important contributor to the anthropogenically enhanced greenhouse effect. Roughly three-quarters of methane emissions are anthropogenic and as such, it is important to continue the record of …
The Total Ozone Mapping Spectrometer (TOMS) data represent the primary long-term, continuous record of satellite-based observations available for use in monitoring global and regional trends in total ozone over the past 25 years. The data are produced by the Laboratory for Atmospheres at NASA's Goddard …
The Tropical Rainfall Measuring Mission (TRMM) is a joint mission between NASA and the Japan Aerospace Exploration Agency (JAXA) designed to monitor and study tropical rainfall. The 34B2 product contains a gridded, TRMM-adjusted, merged infrared precipitation (mm/hr) and RMS precipitation-error estimate, with a 3-hour temporal …
This collection is no longer being updated. See IMERG monthly This dataset algorithmically merges microwave data from multiple satellites, including SSMI, SSMIS, MHS, AMSU-B and AMSR-E, each inter-calibrated to the TRMM Combined Instrument. Algorithm 3B43 is executed once per calendar month to produce the single, …
TerraClimate: Monthly Climate and Climatic Water Balance for Global Terrestrial Surfaces, University of Idaho
TerraClimate is a dataset of monthly climate and climatic water balance for global terrestrial surfaces. It uses climatically aided interpolation, combining high-spatial resolution climatological normals from the WorldClim dataset, with coarser spatial resolution, but time-varying data from CRU Ts4.0 and the Japanese 55-year Reanalysis (JRA55). …
The Climate Hazards Center (CHC) Coupled Model Intercomparison Project Phase 6 (CHC-CMIP6)
CHC-CMIP6 was explicitly developed to support the analysis of climate-related hazards over the recent past and in the near-future. This climate projection dataset contains global, daily gridded data for the observational (1983-2016) and projection (2030 and 2050) periods to be used in the identification and …
The two related FAO datasets on Drained Organic Soils provide estimates of: DROSA-A: area of Organic Soils (in hectares) drained for agricultural activities (cropland and grazed grassland) DROSE-A: carbon (C) and nitrous oxide (N2O) estimates (in gigagrams) from the agricultural drainage of organic soils under …
VNP21A1D.002: Day Land Surface Temperature and Emissivity Daily 1km
The NASA Suomi National Polar-Orbiting Partnership (Suomi NPP) Visible Infrared Imaging Radiometer Suite (VIIRS) Land Surface Temperature and Emissivity (LST&E) Day Version 1 product (VNP21A1D) is compiled daily from daytime Level 2 Gridded (L2G) intermediate products. The L2G process maps the daily VNP21 swath granules …
VNP21A1N.002: Night Land Surface Temperature and Emissivity Daily 1km
The NASA Suomi National Polar-Orbiting Partnership (Suomi NPP) Visible Infrared Imaging Radiometer Suite (VIIRS) Land Surface Temperature and Emissivity (LST&E) Night Version 1 product (VNP21A1N) is compiled daily from nighttime Level 2 Gridded (L2G) intermediate products. The L2G process maps the daily VNP21 swath granules …
WeatherNext 2 یک مجموعه داده آزمایشی از پیشبینیهای آب و هوایی گروهی میانبرد جهانی است که توسط یک نسخه عملیاتی از مدل آب و هوایی مولد شبکه عملکردی گوگل دیپمایند تولید شده است. این مجموعه داده آزمایشی شامل دادههای بلادرنگ و دادههای تاریخی است. دادههای بلادرنگ هر دادهای است که مربوط به زمانی است که ...
میانگین WeatherNext 2 میانگین 64 گروه از یک مجموعه داده آزمایشی از پیشبینیهای آب و هوایی گروهی میانبرد جهانی است که توسط یک نسخه عملیاتی از مدل آب و هوایی مولد شبکه عملکردی گوگل دیپمایند تولید شده است. برای مجموعه دادهای که شامل همه اعضای گروه است، لطفاً به WeatherNext 2 (غیر میانگین) مراجعه کنید...
مجموعه داده WeatherNext 3 (0.05°) یک مجموعه داده آزمایشی از پیشبینیهای آب و هوایی گروهی میانبرد جهانی توسط Google DeepMind و Google Research است که توسط یک نسخه عملیاتی از مدل شرح داده شده در: WeatherNext 3: افزایش وضوح و عملکرد مدلهای آب و هوایی جهانی با مشاهدات خام تولید شده است. دسترسی به دادهها ...
مجموعه داده WeatherNext 3 (0.1°) یک مجموعه داده آزمایشی از پیشبینیهای آب و هوایی گروهی میانبرد جهانی توسط Google DeepMind و Google Research است که توسط یک نسخه عملیاتی از مدل شرح داده شده در: WeatherNext 3: افزایش وضوح و عملکرد مدلهای آب و هوایی جهانی با مشاهدات خام تولید شده است. دسترسی به دادهها ...
WorldClim V1 Bioclim provides bioclimatic variables that are derived from the monthly temperature and rainfall in order to generate more biologically meaningful values. The bioclimatic variables represent annual trends (eg, mean annual temperature, annual precipitation), seasonality (eg, annual range in temperature and precipitation), and extreme …
WorldClim version 1 has average monthly global climate data for minimum, mean, and maximum temperature and for precipitation. WorldClim version 1 was developed by Robert J. Hijmans, Susan Cameron, and Juan Parra, at the Museum of Vertebrate Zoology, University of California, Berkeley, in collaboration with …
This dataset contains annual, summertime, and wintertime surface urban heat island (SUHI) intensities for day and night for over 10,000 urban clusters throughout the world. The dataset was created using the MODIS 8-day TERRA and AQUA land surface temperature (LST) products, the Landscan urban extent …
YCEO Surface Urban Heat Islands: Pixel-Level Composites of Yearly Summertime Daytime and Nighttime Intensity
This dataset contains annual, summertime, and wintertime surface urban heat island (SUHI) intensities for day and night for over 10,000 urban clusters throughout the world. The dataset was created using the MODIS 8-day TERRA and AQUA land surface temperature (LST) products, the Landscan urban extent …
YCEO Surface Urban Heat Islands: Pixel-Level Yearly Composites of Wintertime Daytime and Nighttime Intensity
This dataset contains annual, summertime, and wintertime surface urban heat island (SUHI) intensities for day and night for over 10,000 urban clusters throughout the world. The dataset was created using the MODIS 8-day TERRA and AQUA land surface temperature (LST) products, the Landscan urban extent …
YCEO Surface Urban Heat Islands: Spatially-Averaged Daytime and Nighttime Intensity for Annual, Summer, and Winter
This dataset contains annual, summertime, and wintertime surface urban heat island (SUHI) intensities for day and night for over 10,000 urban clusters throughout the world. The dataset was created using the MODIS 8-day TERRA and AQUA land surface temperature (LST) products, the Landscan urban extent …
YCEO Surface Urban Heat Islands: Spatially-Averaged Monthly Composites of Daytime and Nighttime Intensity
This dataset contains annual, summertime, and wintertime surface urban heat island (SUHI) intensities for day and night for over 10,000 urban clusters throughout the world. The dataset was created using the MODIS 8-day TERRA and AQUA land surface temperature (LST) products, the Landscan urban extent …
YCEO Surface Urban Heat Islands: Spatially-Averaged Yearly Composites of Annual Daytime and Nighttime Intensity
This dataset contains annual, summertime, and wintertime surface urban heat island (SUHI) intensities for day and night for over 10,000 urban clusters throughout the world. The dataset was created using the MODIS 8-day TERRA and AQUA land surface temperature (LST) products, the Landscan urban extent …
Breathing Earth System Simulator (BESS) Radiation v1
Breathing Earth System Simulator (BESS) is a simplified process-based model that couples atmosphere and canopy radiative transfers, canopy photosynthesis, transpiration, and energy balance. It couples an atmospheric radiative transfer model and artificial neural network with forcings from MODIS atmospheric products to generate 5-km daily products. …
CFSR: Climate Forecast System Reanalysis Harmonized
The National Centers for Environmental Prediction (NCEP) Climate Forecast System Reanalysis (CFSR) was designed and executed as a global, high-resolution, coupled atmosphere-ocean-land surface-sea ice system to provide the best estimate of the state of these coupled domains over the 32-year period of record from January …
CFSV2: NCEP Climate Forecast System Version 2, 6-Hourly Products Harmonized
The National Centers for Environmental Prediction (NCEP) Climate Forecast System (CFS) is a fully coupled model representing the interaction between the Earth's atmosphere, oceans, land, and sea ice. CFS was developed at the Environmental Modeling Center (EMC) at NCEP. The operational CFS was upgraded to …
CHIRPS Precipitation Daily Near-Real-Time: Climate Hazards Center InfraRed Precipitation With Station Data (Version 3.0, IMERG-based)
The Climate Hazards Center Infrared Precipitation with Stations (CHIRPS v3) is a 40+ year, high-resolution quasi-global rainfall dataset. It spans 60°N to 60°S and covers all longitudes, providing data from 1981 to near-present. CHIRPS v3 combines satellite-based thermal infrared rainfall estimates with in-situ station observations …
CHIRPS Precipitation Daily Reanalysis: Climate Hazards Center InfraRed Precipitation With Station Data (Version 3.0, ERA5-based)
The Climate Hazards Center Infrared Precipitation with Stations (CHIRPS v3) is a 40+ year, high-resolution quasi-global rainfall dataset. It spans 60°N to 60°S and covers all longitudes, providing data from 1981 to near-present. CHIRPS v3 combines satellite-based thermal infrared rainfall estimates with in-situ station observations …
CHIRPS Precipitation Daily: Climate Hazards Center InfraRed Precipitation With Station Data (Version 2.0 Final)
Climate Hazards Center InfraRed Precipitation with Station data (CHIRPS) is a 30+ year quasi-global rainfall dataset. CHIRPS incorporates 0.05° resolution satellite imagery with in-situ station data to create gridded rainfall time series for trend analysis and seasonal drought monitoring.
CHIRPS Precipitation Pentad: Climate Hazards Center InfraRed Precipitation With Station Data (Version 2.0 Final)
Climate Hazards Center InfraRed Precipitation with Station data (CHIRPS) is a 30+ year quasi-global rainfall dataset. CHIRPS incorporates 0.05° resolution satellite imagery with in-situ station data to create gridded rainfall time series for trend analysis and seasonal drought monitoring.
CHIRPS Precipitation Pentad: Climate Hazards Center InfraRed Precipitation With Station Data (Version 3.0)
The Climate Hazards Center Infrared Precipitation with Stations (CHIRPS v3) is a 40+ year, high-resolution quasi-global rainfall dataset. It spans 60°N to 60°S and covers all longitudes, providing data from 1981 to near-present. CHIRPS v3 combines satellite-based thermal infrared rainfall estimates with in-situ station observations …
CHIRTS Temperature Daily: Climate Hazards Center InfraRed Temperature with Stations daily data product
The Climate Hazards Center InfraRed Temperature with Stations daily temperature data product (CHIRTS-daily; Verdin et al. 2020) is a quasi global, high-resolution gridded dataset (0.05° × 0.05° resolution, 60°S - 70°N) that provides daily minimum (Tmin) and maximum 2-meter temperatures (Tmax) and four derived variables: saturation vapor …
This dataset provides a gridded analysis of daily surface air temperature over global land areas, including daily maximum (Tmax), minimum (Tmin) temperatures. Spanning from 1979 to the present, the data is presented on 0.5-degree latitude/longitude grids, aligning with the resolution of CPC's gauge-based global daily …
Copernicus Atmosphere Monitoring Service (CAMS) Global Near-Real-Time
The Copernicus Atmosphere Monitoring Service provides the capacity to continuously monitor the composition of the Earth's atmosphere at global and regional scales. The main global near-real-time production system is a data assimilation and forecasting suite providing two 5-day forecasts per day for aerosols and chemical …
Daymet V4: Daily Surface Weather and Climatological Summaries
Daymet V4 provides gridded estimates of daily weather parameters for Continental North America, Hawaii, and Puerto Rico (Data for Puerto Rico is available starting in 1950). It is derived from selected meteorological station data and various supporting data sources. Compared to the previous version, Daymet …
The two related FAO datasets on Drained Organic Soils provide estimates of: DROSA-A: area of Organic Soils (in hectares) drained for agricultural activities (cropland and grazed grassland) DROSE-A: carbon (C) and nitrous oxide (N2O) estimates (in gigagrams) from the agricultural drainage of organic soils under …
This dataset contains 15-day forecasts of the atmospheric model variables generated by the ECMWF Integrated Forecasting System (IFS) at 0.25 degree resolution. We refer to these as Near-Realtime (NRT) because new products are released twice a day after the release of the ECMWF realtime forecast …
This dataset contains 6-day forecasts of the wave model fields generated by the ECMWF Integrated Forecasting System (IFS) at 0.25 degree resolution. We refer to these as Near-Realtime (NRT) because new products are released twice a day after the release of the ECMWF realtime forecast …
This dataset contains 15-day forecasts of the wave model fields generated by the ECMWF Integrated Forecasting System (IFS) at 0.25 degree resolution. We refer to these as Near-Realtime (NRT) because new products are released twice a day after the release of the ECMWF realtime forecast …
ERA5 Daily Aggregates - Latest Climate Reanalysis Produced by ECMWF / Copernicus Climate Change Service
ERA5 is the fifth generation ECMWF atmospheric reanalysis of the global climate. Reanalysis combines model data with observations from across the world into a globally complete and consistent dataset. ERA5 replaces its predecessor, the ERA-Interim reanalysis. ERA5 DAILY provides aggregated values for each day for …
ERA5 is the fifth generation ECMWF atmospheric reanalysis of the global climate. It is produced by the Copernicus Climate Change Service (C3S) at ECMWF. Reanalysis combines model data with observations from across the world into a globally complete and consistent dataset using the laws of …
ERA5 is the fifth generation ECMWF atmospheric reanalysis of the global climate. Reanalysis combines model data with observations from across the world into a globally complete and consistent dataset. ERA5 replaces its predecessor, the ERA-Interim reanalysis. This dataset contains 3D parameters at 37 pressure levels.
ERA5 Monthly Aggregates - Latest Climate Reanalysis Produced by ECMWF / Copernicus Climate Change Service
ERA5 is the fifth generation ECMWF atmospheric reanalysis of the global climate. Reanalysis combines model data with observations from across the world into a globally complete and consistent dataset. ERA5 replaces its predecessor, the ERA-Interim reanalysis. ERA5 MONTHLY provides aggregated values for each month for …
ERA5-Land is a reanalysis dataset providing a consistent view of the evolution of land variables over several decades at an enhanced resolution compared to ERA5. ERA5-Land has been produced by replaying the land component of the ECMWF ERA5 climate reanalysis. Reanalysis combines model data with …
ERA5-Land is a reanalysis dataset providing a consistent view of the evolution of land variables over several decades at an enhanced resolution compared to ERA5. ERA5-Land has been produced by replaying the land component of the ECMWF ERA5 climate reanalysis. Reanalysis combines model data with …
ERA5-Land is a reanalysis dataset providing a consistent view of the evolution of land variables over several decades at an enhanced resolution compared to ERA5. ERA5-Land has been produced by replaying the land component of the ECMWF ERA5 climate reanalysis. Reanalysis combines model data with …
ERA5-Land Monthly Averaged by Hour of Day - ECMWF Climate Reanalysis
ERA5-Land is a reanalysis dataset providing a consistent view of the evolution of land variables over several decades at an enhanced resolution compared to ERA5. ERA5-Land has been produced by replaying the land component of the ECMWF ERA5 climate reanalysis. Reanalysis combines model data with …
ERA5-Land is a reanalysis dataset providing a consistent view of the evolution of land variables over several decades at an enhanced resolution compared to ERA5. ERA5-Land has been produced by replaying the land component of the ECMWF ERA5 climate reanalysis. Reanalysis combines model data with …
FLDAS: Famine Early Warning Systems Network (FEWS NET) Land Data Assimilation System
The FLDAS dataset (McNally et al. 2017), was designed to assist with food security assessments in data-sparse, developing country settings. It includes information on many climate-related variables including moisture content, humidity, evapotranspiration, average soil temperature, total precipitation rate, etc. There are multiple different FLDAS datasets; …
The Farmscapes 2020 dataset provides high-resolution (25cm) probability maps for three key semi-natural features within England's agricultural landscapes: hedgerows, woodland, and stone walls. This dataset was developed in collaboration with the Leverhulme Centre for Nature Recovery at Oxford to serve as a baseline for applications …
This is the vectorised version of the Farmscapes 2020 raster dataset. It provides polygon geometries representing fine-scale semi-natural landscape features (specifically hedgerows, woodland, and stone walls) across England's agricultural landscapes. This dataset was developed in collaboration with the Oxford Leverhulme Centre for Nature Recovery to …
The Forest Typology (ForTy) v1 dataset consists of a global per-class probability map at 10 m resolution covering all land areas between 65°S and 84°N latitude for the year 2020. The six-class typology is aligned with FAO and EU Deforestation Regulation (EUDR) definitions: Class 1 …
This product is the temperature of terrestrial land surface. A newer version JAXA/GCOM-C/L3/LAND/LST/V3 is also available for this dataset which uses this algorithm for processing. GCOM-C conducts long-term and continuous global observation and data collection to elucidate the mechanism behind fluctuations in radiation budget and …
This product is the temperature of terrestrial land surface. For data after 2021-11-28, see the V3 dataset. GCOM-C conducts long-term and continuous global observation and data collection to elucidate the mechanism behind fluctuations in radiation budget and carbon cycle needed to make accurate projections regarding …
This product is the temperature of terrestrial land surface. This is an ongoing dataset with a latency of 3-4 days. GCOM-C conducts long-term and continuous global observation and data collection to elucidate the mechanism behind fluctuations in radiation budget and carbon cycle needed to make …
This product is the temperature of sea surface. A newer version JAXA/GCOM-C/L3/OCEAN/SST/V3 is also available for this dataset which uses this algorithm for processing. GCOM-C conducts long-term and continuous global observation and data collection to elucidate the mechanism behind fluctuations in radiation budget and carbon …
This product is the temperature of sea surface. For data after 2021-11-28, see the V3 dataset. GCOM-C conducts long-term and continuous global observation and data collection to elucidate the mechanism behind fluctuations in radiation budget and carbon cycle needed to make accurate projections regarding future …
This product is the temperature of sea surface. This is an ongoing dataset with a latency of 3-4 days. GCOM-C conducts long-term and continuous global observation and data collection to elucidate the mechanism behind fluctuations in radiation budget and carbon cycle needed to make accurate …
GFS: Global Forecast System 384-Hour Predicted Atmosphere Data
The Global Forecast System (GFS) is a weather forecast model produced by the National Centers for Environmental Prediction (NCEP). The GFS dataset consists of selected model outputs (described below) as gridded forecast variables. The 384-hour forecasts, with 1-hour (up to 120 hours) and 3-hour (after …
NASA Global Land Data Assimilation System Version 2 (GLDAS-2) has three components: GLDAS-2.0, GLDAS-2.1, and GLDAS-2.2. GLDAS-2.0 is forced entirely with the Princeton meteorological forcing input data and provides a temporally consistent series from 1948 through 2014. GLDAS-2.1 is forced with a combination of model …
NASA Global Land Data Assimilation System Version 2 (GLDAS-2) has three components: GLDAS-2.0, GLDAS-2.1, and GLDAS-2.2. GLDAS-2.0 is forced entirely with the Princeton meteorological forcing input data and provides a temporally consistent series from 1948 through 2014. GLDAS-2.1 is forced with a combination of model …
GPM: Global Precipitation Measurement (GPM) Release 07
Global Precipitation Measurement (GPM) is an international satellite mission to provide next-generation observations of rain and snow worldwide every three hours. The Integrated Multi-satellitE Retrievals for GPM (IMERG) is the unified algorithm that provides rainfall estimates combining data from all passive-microwave instruments in the GPM …
GPM: Monthly Global Precipitation Measurement (GPM) v6
IMERG-Final version "06" stopped being produced in September, 2021. Version "07" is expected to be released in September 2022 Global Precipitation Measurement (GPM) is an international satellite mission to provide next-generation observations of rain and snow worldwide every three hours. The Integrated Multi-satellitE Retrievals for …
GPM: Monthly Global Precipitation Measurement (GPM) vRelease 07
Global Precipitation Measurement (GPM) is an international satellite mission to provide next-generation observations of rain and snow worldwide every three hours. The Integrated Multi-satellitE Retrievals for GPM (IMERG) is the unified algorithm that provides rainfall estimates combining data from all passive-microwave instruments in the GPM …
This dataset contains drought indices derived from the 4-km daily Gridded Surface Meteorological (GRIDMET) dataset. The drought indices provided include the standardized precipitation index (SPI), the evaporative drought demand index (EDDI), the standardized precipitation evapotranspiration index (SPEI), the Palmer Drought Severity Index (PDSI) and Palmer …
GRIDMET: University of Idaho Gridded Surface Meteorological Dataset
The Gridded Surface Meteorological dataset provides high spatial resolution (~4-km) daily surface fields of temperature, precipitation, winds, humidity and radiation across the contiguous United States from 1979. The dataset blends the high resolution spatial data from PRISM with the high temporal resolution data from the …
GSMaP Operational: Global Satellite Mapping of Precipitation - V6
Global Satellite Mapping of Precipitation (GSMaP) provides a global hourly rain rate with a 0.1 x 0.1 degree resolution. GSMaP is a product of the Global Precipitation Measurement (GPM) mission, which provides global precipitation observations at three hour intervals. Values are estimated using multi-band passive …
GSMaP Operational: Global Satellite Mapping of Precipitation - V7
Global Satellite Mapping of Precipitation (GSMaP) provides a global hourly rain rate with a 0.1 x 0.1 degree resolution. GSMaP is a product of the Global Precipitation Measurement (GPM) mission, which provides global precipitation observations at three hour intervals. Values are estimated using multi-band passive …
GSMaP Operational: Global Satellite Mapping of Precipitation - V8
Global Satellite Mapping of Precipitation (GSMaP) provides a global hourly rain rate with a 0.1 x 0.1 degree resolution. GSMaP is a product of the Global Precipitation Measurement (GPM) mission, which provides global precipitation observations at three hour intervals. Values are estimated using multi-band passive …
GSMaP Reanalysis: Global Satellite Mapping of Precipitation
Global Satellite Mapping of Precipitation (GSMaP) provides a global hourly rain rate with a 0.1 x 0.1 degree resolution. GSMaP is a product of the Global Precipitation Measurement (GPM) mission, which provides global precipitation observations at three hour intervals. Values are estimated using multi-band passive …
Since their introduction in 2012, Local Climate Zones (LCZs) emerged as a new standard for characterizing urban landscapes, providing a holistic classification approach that takes into account micro-scale land-cover and associated physical properties. This global map of Local Climate Zones, at 100m pixel size and …
International Best Track Archive for Climate Stewardship Project
The International Best Track Archive for Climate Stewardship (IBTrACS) provides location and intensity for global tropical cyclones. The data span from the 1840s to present, generally providing data at 3-hour intervals. While the best track data is focused on position and intensity (maximum sustained wind …
LST Day: Malaria Atlas Project Gap-Filled Daytime Land Surface Temperature (8-Daily 1km)
Daytime Land Surface Temperature (LST) are derived from the ~1km MODIS MOD11A2 v6.1 products. The 8-daily composites are converted to degrees Celsius and then gap-filled using the approach outlined in Weiss et al (2014) to eliminate missing data caused by factors such as cloud cover. …
LST Day: Malaria Atlas Project Gap-Filled Daytime Land Surface Temperature (Annual 1km)
Daytime Land Surface Temperature (LST) are derived from the ~1km MODIS MOD11A2 v6.1 products. The 8-daily composites are converted to degrees Celsius and then gap-filled using the approach outlined in Weiss et al (2014) to eliminate missing data caused by factors such as cloud cover. …
LST Day: Malaria Atlas Project Gap-Filled Daytime Land Surface Temperature (Monthly 1km)
Daytime Land Surface Temperature (LST) are derived from the ~1km MODIS MOD11A2 v6.1 products. The 8-daily composites are converted to degrees Celsius and then gap-filled using the approach outlined in Weiss et al (2014) to eliminate missing data caused by factors such as cloud cover. …
LST Night: Malaria Atlas Project Gap-Filled Nighttime Land Surface Temperature (8-Daily 1km)
Nighttime Land Surface Temperature (LST) are derived from the ~1km MODIS MOD11A2 v6.1 products. The 8-daily composites are converted to degrees Celsius and then gap-filled using the approach outlined in Weiss et al (2014) to eliminate missing data caused by factors such as cloud cover. …
LST Night: Malaria Atlas Project Gap-Filled Nighttime Land Surface Temperature (Annual 1km)
Nighttime Land Surface Temperature (LST) are derived from the ~1km MODIS MOD11A2 v6.1 products. The 8-daily composites are converted to degrees Celsius and then gap-filled using the approach outlined in Weiss et al (2014) to eliminate missing data caused by factors such as cloud cover. …
LST Night: Malaria Atlas Project Gap-Filled Nighttime Land Surface Temperature (Monthly 1km)
Nighttime Land Surface Temperature (LST) are derived from the ~1km MODIS MOD11A2 v6.1 products. The 8-daily composites are converted to degrees Celsius and then gap-filled using the approach outlined in Weiss et al (2014) to eliminate missing data caused by factors such as cloud cover. …
MACAv2-METDATA Monthly Summaries: University of Idaho, Multivariate Adaptive Constructed Analogs Applied to Global Climate Models
The MACAv2-METDATA dataset is a collection of 20 global climate models covering the conterminous USA. The Multivariate Adaptive Constructed Analogs (MACA) method is a statistical downscaling method which utilizes a training dataset (ie a meteorological observation dataset) to remove historical biases and match spatial patterns …
MACAv2-METDATA: University of Idaho, Multivariate Adaptive Constructed Analogs Applied to Global Climate Models
The MACAv2-METDATA dataset is a collection of 20 global climate models covering the conterminous USA. The Multivariate Adaptive Constructed Analogs (MACA) method is a statistical downscaling method which utilizes a training dataset (ie a meteorological observation dataset) to remove historical biases and match spatial patterns …
The MCD18A1 Version 6.2 is a Moderate Resolution Imaging Spectroradiometer (MODIS) Terra and Aqua combined Downward Shortwave Radiation (DSR) gridded Level 3 product produced daily at 1 kilometer pixel resolution with estimates of DSR every 3 hours. DSR is incident solar radiation over land surfaces …
MCD18C2.062 Photosynthetically Active Radiation Daily 3-Hour
The MCD18C2 Version 6.2 is a Moderate Resolution Imaging Spectroradiometer (MODIS) Terra and Aqua combined Photosynthetically Active Radiation (PAR) gridded Level 3 product produced daily at 0.05 degree (5,600 meters at the equator) resolution with estimates of PAR every 3 hours. PAR is incident solar …
M2T1NXFLX (or tavg1_2d_flx_Nx) is an hourly time-averaged data collection in Modern-Era Retrospective analysis for Research and Applications version 2 (MERRA-2). This collection consists of assimilated surface flux diagnostics, such as total precipitation, bias corrected total precipitation, surface air temperature, surface specific humidity, surface wind speed, …
MERRA-2 M2T1NXLND: Land Surface Diagnostics V5.12.4
M2T1NXLND (or tavg1_2d_lnd_Nx) is an hourly time-averaged data collection in Modern-Era Retrospective analysis for Research and Applications version 2 (MERRA-2). This collection consists of land surface diagnostics, such a baseflow flux, runoff, surface soil wetness, root zone soil wetness, water at surface layer, water at …
M2T1NXRAD (or tavg1_2d_rad_Nx) is an hourly time-averaged data collection in Modern-Era Retrospective analysis for Research and Applications version 2 (MERRA-2). This collection consists of radiation diagnostics, such as surface albedo, cloud area fraction, in cloud optical thickness, surface incoming shortwave flux (ie solar radiation), surface …
M2T1NXSLV (or tavg1_2d_slv_Nx) is an hourly time-averaged 2-dimensional data collection in Modern-Era Retrospective analysis for Research and Applications version 2 (MERRA-2). This collection consists of meteorology diagnostics at popularly used vertical levels, such as air temperature at 2-meter (or at 10-meter, 850hPa, 500 hPa, 250hPa), …
MOD08_M3.061 Terra Atmosphere Monthly Global Product
MOD08_M3 V6.1 is an atmosphere global product that contains monthly 1 x 1 degree grid average values of atmospheric parameters. These parameters are related to atmospheric aerosol particle properties, total ozone burden, atmospheric water vapor, cloud optical and physical properties, and atmospheric stability indices. The …
MOD11A1.061 Terra Land Surface Temperature and Emissivity Daily Global 1km
The MOD11A1 V6.1 product provides daily land surface temperature (LST) and emissivity values in a 1200 x 1200 kilometer grid. The temperature value is derived from the MOD11_L2 swath product. Above 30 degrees latitude, some pixels may have multiple observations where the criteria for clear-sky …
MOD11A2.061 Terra Land Surface Temperature and Emissivity 8-Day Global 1km
The MOD11A2 V6.1 product provides an average 8-day land surface temperature (LST) in a 1200 x 1200 kilometer grid. Each pixel value in MOD11A2 is a simple average of all the corresponding MOD11A1 LST pixels collected within that 8 day period. The MOD11A2 does a …
MOD21A1D.061 Terra Land Surface Temperature and 3-Band Emissivity Daily Global 1km
The MOD21A1D dataset is produced daily from daytime Level 2 Gridded (L2G) intermediate LST products at a spatial resolution of 1,000 meters. The L2G process maps the daily MOD21 swath granules onto a sinusoidal MODIS grid and stores all observations falling over a gridded cell …
MOD21A1N.061 Terra Land Surface Temperature and 3-Band Emissivity Daily Global 1km
The MOD21A1N dataset is produced daily from nighttime Level 2 Gridded (L2G) intermediate LST products at a spatial resolution of 1,000 meters. The L2G process maps the daily MOD21 swath granules onto a sinusoidal MODIS grid and stores all observations falling over a gridded cell …
MOD21C1.061 Terra Land Surface Temperature and 3-Band Emissivity Daily L3 Global 0.05 Deg CMG
The MOD21C1 dataset is produced daily in a 0.05 degree (5,600 meters at the equator) Climate Modeling Grid (CMG) from daytime Level 2 Gridded (L2G) intermediate LST products. The L2G process maps the daily MOD21 swath granules onto a sinusoidal MODIS grid and stores all …
MOD21C2.061 Terra Land Surface Temperature and 3-Band Emissivity 8-Day L3 Global 0.05 Deg CMG
The MOD21C2 dataset is an 8-day composite LST product that uses an algorithm based on a simple averaging method. The algorithm calculates the average from all the cloud free MOD21A1D and MOD21A1N daily acquisitions from the 8-day period. Unlike the MOD21A1 data sets where the …
MOD21C3.061 Terra Land Surface Temperature and 3-Band Emissivity Monthly L3 Global 0.05 Deg CMG
The MOD21C3 dataset is a monthly composite LST product that uses an algorithm based on a simple averaging method. The algorithm calculates the average from all the cloud free MOD21A1D and MOD21A1N daily acquisitions from the 8-day period. Unlike the MOD21A1 data sets where the …
MYD08_M3.061 Aqua Atmosphere Monthly Global Product
MYD08_M3 V6.1 is an atmosphere global product that contains monthly 1 x 1 degree grid average values of atmospheric parameters. These parameters are related to atmospheric aerosol particle properties, total ozone burden, atmospheric water vapor, cloud optical and physical properties, and atmospheric stability indices. The …
MYD11A1.061 Aqua Land Surface Temperature and Emissivity Daily Global 1km
The MYD11A1 V6.1 product provides daily land surface temperature (LST) and emissivity values in a 1200 x 1200 kilometer grid. The temperature value is derived from the MYD11_L2 swath product. Above 30 degrees latitude, some pixels may have multiple observations where the criteria for clear-sky …
MYD11A2.061 Aqua Land Surface Temperature and Emissivity 8-Day Global 1km
The MYD11A2 V6.1 product provides an average 8-day land surface temperature (LST) in a 1200 x 1200 kilometer grid. Each pixel value in MYD11A2 is a simple average of all the corresponding MYD11A1 LST pixels collected within that 8 day period. The MYD11A2 does a …
MYD21A1D.061 Aqua Land Surface Temperature and 3-Band Emissivity Daily Global 1km
The MYD21A1D dataset is produced daily from daytime Level 2 Gridded (L2G) intermediate LST products at a spatial resolution of 1,000 meters. The L2G process maps the daily MOD21 swath granules onto a sinusoidal MODIS grid and stores all observations falling over a gridded cell …
MYD21A1N.061 Aqua Land Surface Temperature and 3-Band Emissivity Daily Global 1km
The MYD21A1N dataset is produced daily from nighttime Level 2 Gridded (L2G) intermediate LST products at a spatial resolution of 1,000 meters. The L2G process maps the daily MOD21 swath granules onto a sinusoidal MODIS grid and stores all observations falling over a gridded cell …
MYD21C1.061 Aqua Land Surface Temperature and 3-Band Emissivity Daily L3 Global 0.05 Deg CMG
The MYD21C1 dataset is produced daily in a 0.05 degree (5,600 meters at the equator) Climate Modeling Grid (CMG) from daytime Level 2 Gridded (L2G) intermediate LST products. The L2G process maps the daily MYD21 swath granules onto a sinusoidal MODIS grid and stores all …
MYD21C2.061 Aqua Land Surface Temperature and 3-Band Emissivity 8-Day L3 Global 0.05 Deg CMG
The MYD21C2 dataset is an 8-day composite LST product that uses an algorithm based on a simple averaging method. The algorithm calculates the average from all the cloud free MYD21A1D and MYD21A1N daily acquisitions from the 8-day period. Unlike the MYD21A1 data sets where the …
MYD21C3.061 Aqua Land Surface Temperature and 3-Band Emissivity Monthly L3 Global 0.05 Deg CMG
The MYD21C3 dataset is a monthly composite LST product that uses an algorithm based on a simple averaging method. The algorithm calculates the average from all the cloud free MYD21A1D and MYD21A1N daily acquisitions from the 8-day period. Unlike the MYD21A1 data sets where the …
This dataset provides geospatial data for the total column dry air mole fraction of methane in the atmosphere, "XCH4", as observed by the MethaneAIR imaging spectrometer. XCH4 is defined as the total column amount (number of molecules) of methane ("CH4") divided by the total amount …
This dataset provides geospatial data for the total column dry air mole fraction of methane in the atmosphere, "XCH4", as observed by the MethaneAIR imaging spectrometer. XCH4 is defined as the total column amount (number of molecules) of methane ("CH4") divided by the total amount …
The area emissions model is still in development and not representative of a final product. This dataset provides spatially disaggregated methane emission fluxes (kg/hr) using measurements from MethaneAIR flights focused on oil and gas producing regions throughout the United States. Total emissions for the survey …
This dataset provides data for high-emitting methane point source detections (kg/hr) over 13 oil and gas or coal extraction areas from Colorado, New Mexico, and Texas in the west to Pennsylvania, Ohio, and West Virginia in the east, plus three urban areas (New York City, …
This dataset provides data for high-emitting methane point source detections (kg/hr) over 13 oil and gas or coal extraction areas from Colorado, New Mexico, and Texas in the west to Pennsylvania, Ohio, and West Virginia in the east, plus three urban areas (New York City, …
This early "Public Preview" dataset provides geospatial data for the column-averaged dry-air mole fraction of methane in the atmosphere, "XCH4", retrieved from measurements by the MethaneSAT imaging spectrometer. XCH4 is defined as the total column amount (number of molecules above a unit surface area) of …
The dispersed area emissions model is still in development and not representative of a final product. This early "Public Preview" dataset provides high precision data for methane emissions from dispersed area sources. These emissions data come from the Appalachian, Permian, and Uinta basins in the …
The dispersed area emissions model is still in development and not representative of a final product. This early "Public Preview" dataset provides high precision data for methane emissions from dispersed area sources. These novel measurements demonstrate the importance of quantifying total methane emissions with high …
This early "Public Preview" dataset provides high precision data for methane emissions from discrete point sources. These methane emission fluxes were produced using a point source detection and emissions quantification framework specialized to exploit the high spatial resolution, wide spatial coverage, and high precision of …
NCEP-DOE Reanalysis 2 (Gaussian Grid), Total Cloud Coverage
This collection is no longer being updated. The Model is no longer being updated at the source. NCEP-DOE Reanalysis 2 project is using a state-of-the-art analysis/forecast system to perform data assimilation using past data from 1979 through the previous year.
The NCEP/NCAR Reanalysis Project is a joint project between the National Centers for Environmental Prediction (NCEP, formerly "NMC") and the National Center for Atmospheric Research (NCAR). The goal of this joint effort is to produce new atmospheric analyses using historical data as well as to …
NCEP/NCAR Reanalysis Data, Surface Temperature [deprecated]
The NCEP/NCAR Reanalysis Project is a joint project between the National Centers for Environmental Prediction (NCEP, formerly "NMC") and the National Center for Atmospheric Research (NCAR). The goal of this joint effort is to produce new atmospheric analyses using historical data as well as to …
NCEP/NCAR Reanalysis Data, Water Vapor [deprecated]
The NCEP/NCAR Reanalysis Project is a joint project between the National Centers for Environmental Prediction (NCEP, formerly "NMC") and the National Center for Atmospheric Research (NCAR). The goal of this joint effort is to produce new atmospheric analyses using historical data as well as to …
NEX-DCP30: Ensemble Stats for NASA Earth Exchange Downscaled Climate Projections
The NASA NEX-DCP30 dataset is comprised of downscaled climate scenarios for the conterminous United States that are derived from the General Circulation Model (GCM) runs conducted under the Coupled Model Intercomparison Project Phase 5 (CMIP5, see Taylor et al. 2012) and across the four greenhouse …
NEX-DCP30: NASA Earth Exchange Downscaled Climate Projections
The NASA NEX-DCP30 dataset is comprised of downscaled climate scenarios for the conterminous United States that are derived from the General Circulation Model (GCM) runs conducted under the Coupled Model Intercomparison Project Phase 5 (CMIP5, see Taylor et al. 2012) and across the four greenhouse …
NEX-GDDP-CMIP6: NASA Earth Exchange Global Daily Downscaled Climate Projections
The NEX-GDDP-CMIP6 dataset is comprised of global downscaled climate scenarios derived from the General Circulation Model (GCM) runs conducted under the Coupled Model Intercomparison Project Phase 6 (CMIP6, see Thrasher et al. 2022) and across two of the four "Tier 1" greenhouse gas emissions scenarios …
NEX-GDDP: NASA Earth Exchange Global Daily Downscaled Climate Projections
The NASA NEX-GDDP dataset is comprised of downscaled climate scenarios for the globe that are derived from the General Circulation Model (GCM) runs conducted under the Coupled Model Intercomparison Project Phase 5 (CMIP5, see Taylor et al. 2012) and across two of the four greenhouse …
NLDAS-2: North American Land Data Assimilation System Forcing Fields
Land Data Assimilation System (LDAS) combines multiple sources of observations (such as precipitation gauge data, satellite data, and radar precipitation measurements) to produce estimates of climatological properties at or near the Earth''s surface. This dataset is the primary (default) forcing file (File A) for Phase …
NOAA CDR GRIDSAT-B1: Geostationary IR Channel Brightness Temperature
Note: This dataset has not been updated by the provider since 2024-03-31 due to ongoing infrastructure updates. There is no current timeline for when dataset updates will resume. This dataset provides a high quality Climate Data Record (CDR) of global infrared measurements from geostationary satellites. …
NOAA CDR PATMOSX: Cloud Properties, Reflectance, and Brightness Temperatures, Version 5.3
This dataset provides high quality Climate Data Record (CDR) of multiple cloud properties along with Advanced Very High Resolution Radiometer (AVHRR) Pathfinder Atmospheres Extended (PATMOS-x) brightness temperatures and reflectances. These data have been fitted to a 0.1 x 0.1 equal angle-grid with both ascending and …
Natural Forests of the World 2020, provides a global map of natural forest probability for the year 2020 at a 10-meter resolution. It was developed to support initiatives like the European Union's Deforestation Regulation (EUDR) and other efforts for forest conservation and monitoring. The map …
OpenLandMap Long-term Land Surface Temperature Daytime Monthly Median
Land Surface Temperature daytime monthly mean value 2000-2017. Derived using the data.table package and quantile function in R. For more info about the MODIS LST product see this page. Antarctica is not included. To access and visualize maps outside of Earth Engine, use this page. …
OpenLandMap Long-term Land Surface Temperature Daytime Monthly Standard Deviation
Long-term MODIS LST day-time and night-time temperatures standard deviation at 1 km based on the 2000-2017 time series. Derived using the data.table package and quantile function in R. For more info about the MODIS LST product see this page. Antarctica is not included. To access …
OpenLandMap Long-term Land Surface Temperature Monthly Day-Night Difference
Long-term MODIS LST day-time and night-time differences at 1 km based on the 2000-2017 time series Derived using the data.table package and quantile function in R. For more info about the MODIS LST product see this page. Antarctica is not included. To access and visualize …
Oya is a quasi-global, high-resolution precipitation estimation dataset derived from geostationary (GEO) satellite observations. The Oya model utilizes the full spectrum of visible and infrared (VIS-IR) channels from a constellation of GEO satellites — including GOES-16/18, Meteosat-9/10, and Himawari-8/9 — to generate precipitation estimates covering …
PERSIANN-CDR: Precipitation Estimation From Remotely Sensed Information Using Artificial Neural Networks-Climate Data Record
PERSIANN-CDR is a daily quasi-global precipitation product that spans the period from 1983-01-01 to present. The data is produced quarterly, with a typical lag of three months. The product is developed by the Center for Hydrometeorology and Remote Sensing at the University of California, Irvine …
The PRISM daily and monthly datasets are gridded climate datasets for the conterminous United States, produced by the PRISM Climate Group at Oregon State University. This collection contains both AN81 and AN91 data, indicated by the 'dataset_type' property. Grids are developed using PRISM (Parameter-elevation Regressions …
The PRISM daily and monthly datasets are gridded climate datasets for the conterminous United States, produced by the PRISM Climate Group at Oregon State University. Grids are developed using PRISM (Parameter-elevation Regressions on Independent Slopes Model). PRISM interpolation routines simulate how weather and climate vary …
The PRISM daily and monthly datasets are gridded climate datasets for the conterminous United States, produced by the PRISM Climate Group at Oregon State University. This collection contains both AN81 and AN91 data, as indicated by the 'dataset_type' property. Grids are developed using PRISM (Parameter-elevation …
The Real-Time Mesoscale Analysis (RTMA) is a high-spatial and temporal resolution analysis for near-surface weather conditions. This dataset includes hourly analyses at 2.5 km for CONUS.
Reprocessed GLDAS-2.0: Global Land Data Assimilation System
NASA Global Land Data Assimilation System Version 2 (GLDAS-2) has three components: GLDAS-2.0, GLDAS-2.1, and GLDAS-2.2. GLDAS-2.0 is forced entirely with the Princeton meteorological forcing input data and provides a temporally consistent series from 1948 through 2014. GLDAS-2.1 is forced with a combination of model …
SPEIbase: Standardised Precipitation-Evapotranspiration Index database, Version 2.11
The Global SPEI database (SPEIbase) offers long-time robust information about drought conditions at the global scale, with a 0.5 degree pixel size and monthly cadence. It provides SPEI time scales from 1 to 48 months. The Standardized Precipitation-Evapotranspiration Index (SPEI) expresses, as a standardized variate …
OFFL/L3_CH4 This dataset provides offline high-resolution imagery of methane concentrations. Methane (CH4) is, after carbon dioxide (CO2), the most important contributor to the anthropogenically enhanced greenhouse effect. Roughly three-quarters of methane emissions are anthropogenic and as such, it is important to continue the record of …
The Total Ozone Mapping Spectrometer (TOMS) data represent the primary long-term, continuous record of satellite-based observations available for use in monitoring global and regional trends in total ozone over the past 25 years. The data are produced by the Laboratory for Atmospheres at NASA's Goddard …
The Tropical Rainfall Measuring Mission (TRMM) is a joint mission between NASA and the Japan Aerospace Exploration Agency (JAXA) designed to monitor and study tropical rainfall. The 34B2 product contains a gridded, TRMM-adjusted, merged infrared precipitation (mm/hr) and RMS precipitation-error estimate, with a 3-hour temporal …
This collection is no longer being updated. See IMERG monthly This dataset algorithmically merges microwave data from multiple satellites, including SSMI, SSMIS, MHS, AMSU-B and AMSR-E, each inter-calibrated to the TRMM Combined Instrument. Algorithm 3B43 is executed once per calendar month to produce the single, …
TerraClimate: Monthly Climate and Climatic Water Balance for Global Terrestrial Surfaces, University of Idaho
TerraClimate is a dataset of monthly climate and climatic water balance for global terrestrial surfaces. It uses climatically aided interpolation, combining high-spatial resolution climatological normals from the WorldClim dataset, with coarser spatial resolution, but time-varying data from CRU Ts4.0 and the Japanese 55-year Reanalysis (JRA55). …
The Climate Hazards Center (CHC) Coupled Model Intercomparison Project Phase 6 (CHC-CMIP6)
CHC-CMIP6 was explicitly developed to support the analysis of climate-related hazards over the recent past and in the near-future. This climate projection dataset contains global, daily gridded data for the observational (1983-2016) and projection (2030 and 2050) periods to be used in the identification and …
The two related FAO datasets on Drained Organic Soils provide estimates of: DROSA-A: area of Organic Soils (in hectares) drained for agricultural activities (cropland and grazed grassland) DROSE-A: carbon (C) and nitrous oxide (N2O) estimates (in gigagrams) from the agricultural drainage of organic soils under …
VNP21A1D.002: Day Land Surface Temperature and Emissivity Daily 1km
The NASA Suomi National Polar-Orbiting Partnership (Suomi NPP) Visible Infrared Imaging Radiometer Suite (VIIRS) Land Surface Temperature and Emissivity (LST&E) Day Version 1 product (VNP21A1D) is compiled daily from daytime Level 2 Gridded (L2G) intermediate products. The L2G process maps the daily VNP21 swath granules …
VNP21A1N.002: Night Land Surface Temperature and Emissivity Daily 1km
The NASA Suomi National Polar-Orbiting Partnership (Suomi NPP) Visible Infrared Imaging Radiometer Suite (VIIRS) Land Surface Temperature and Emissivity (LST&E) Night Version 1 product (VNP21A1N) is compiled daily from nighttime Level 2 Gridded (L2G) intermediate products. The L2G process maps the daily VNP21 swath granules …
WeatherNext 2 یک مجموعه داده آزمایشی از پیشبینیهای آب و هوایی گروهی میانبرد جهانی است که توسط یک نسخه عملیاتی از مدل آب و هوایی مولد شبکه عملکردی گوگل دیپمایند تولید شده است. این مجموعه داده آزمایشی شامل دادههای بلادرنگ و دادههای تاریخی است. دادههای بلادرنگ هر دادهای است که مربوط به زمانی است که ...
میانگین WeatherNext 2 میانگین 64 گروه از یک مجموعه داده آزمایشی از پیشبینیهای آب و هوایی گروهی میانبرد جهانی است که توسط یک نسخه عملیاتی از مدل آب و هوایی مولد شبکه عملکردی گوگل دیپمایند تولید شده است. برای مجموعه دادهای که شامل همه اعضای گروه است، لطفاً به WeatherNext 2 (غیر میانگین) مراجعه کنید...
مجموعه داده WeatherNext 3 (0.05°) یک مجموعه داده آزمایشی از پیشبینیهای آب و هوایی گروهی میانبرد جهانی توسط Google DeepMind و Google Research است که توسط یک نسخه عملیاتی از مدل شرح داده شده در: WeatherNext 3: افزایش وضوح و عملکرد مدلهای آب و هوایی جهانی با مشاهدات خام تولید شده است. دسترسی به دادهها ...
مجموعه داده WeatherNext 3 (0.1°) یک مجموعه داده آزمایشی از پیشبینیهای آب و هوایی گروهی میانبرد جهانی توسط Google DeepMind و Google Research است که توسط یک نسخه عملیاتی از مدل شرح داده شده در: WeatherNext 3: افزایش وضوح و عملکرد مدلهای آب و هوایی جهانی با مشاهدات خام تولید شده است. دسترسی به دادهها ...
WorldClim V1 Bioclim provides bioclimatic variables that are derived from the monthly temperature and rainfall in order to generate more biologically meaningful values. The bioclimatic variables represent annual trends (eg, mean annual temperature, annual precipitation), seasonality (eg, annual range in temperature and precipitation), and extreme …
WorldClim version 1 has average monthly global climate data for minimum, mean, and maximum temperature and for precipitation. WorldClim version 1 was developed by Robert J. Hijmans, Susan Cameron, and Juan Parra, at the Museum of Vertebrate Zoology, University of California, Berkeley, in collaboration with …
This dataset contains annual, summertime, and wintertime surface urban heat island (SUHI) intensities for day and night for over 10,000 urban clusters throughout the world. The dataset was created using the MODIS 8-day TERRA and AQUA land surface temperature (LST) products, the Landscan urban extent …
YCEO Surface Urban Heat Islands: Pixel-Level Composites of Yearly Summertime Daytime and Nighttime Intensity
This dataset contains annual, summertime, and wintertime surface urban heat island (SUHI) intensities for day and night for over 10,000 urban clusters throughout the world. The dataset was created using the MODIS 8-day TERRA and AQUA land surface temperature (LST) products, the Landscan urban extent …
YCEO Surface Urban Heat Islands: Pixel-Level Yearly Composites of Wintertime Daytime and Nighttime Intensity
This dataset contains annual, summertime, and wintertime surface urban heat island (SUHI) intensities for day and night for over 10,000 urban clusters throughout the world. The dataset was created using the MODIS 8-day TERRA and AQUA land surface temperature (LST) products, the Landscan urban extent …
YCEO Surface Urban Heat Islands: Spatially-Averaged Daytime and Nighttime Intensity for Annual, Summer, and Winter
This dataset contains annual, summertime, and wintertime surface urban heat island (SUHI) intensities for day and night for over 10,000 urban clusters throughout the world. The dataset was created using the MODIS 8-day TERRA and AQUA land surface temperature (LST) products, the Landscan urban extent …
YCEO Surface Urban Heat Islands: Spatially-Averaged Monthly Composites of Daytime and Nighttime Intensity
This dataset contains annual, summertime, and wintertime surface urban heat island (SUHI) intensities for day and night for over 10,000 urban clusters throughout the world. The dataset was created using the MODIS 8-day TERRA and AQUA land surface temperature (LST) products, the Landscan urban extent …
YCEO Surface Urban Heat Islands: Spatially-Averaged Yearly Composites of Annual Daytime and Nighttime Intensity
This dataset contains annual, summertime, and wintertime surface urban heat island (SUHI) intensities for day and night for over 10,000 urban clusters throughout the world. The dataset was created using the MODIS 8-day TERRA and AQUA land surface temperature (LST) products, the Landscan urban extent …
Breathing Earth System Simulator (BESS) Radiation v1
Breathing Earth System Simulator (BESS) is a simplified process-based model that couples atmosphere and canopy radiative transfers, canopy photosynthesis, transpiration, and energy balance. It couples an atmospheric radiative transfer model and artificial neural network with forcings from MODIS atmospheric products to generate 5-km daily products. …
CFSR: Climate Forecast System Reanalysis Harmonized
The National Centers for Environmental Prediction (NCEP) Climate Forecast System Reanalysis (CFSR) was designed and executed as a global, high-resolution, coupled atmosphere-ocean-land surface-sea ice system to provide the best estimate of the state of these coupled domains over the 32-year period of record from January …
CFSV2: NCEP Climate Forecast System Version 2, 6-Hourly Products Harmonized
The National Centers for Environmental Prediction (NCEP) Climate Forecast System (CFS) is a fully coupled model representing the interaction between the Earth's atmosphere, oceans, land, and sea ice. CFS was developed at the Environmental Modeling Center (EMC) at NCEP. The operational CFS was upgraded to …
CHIRPS Precipitation Daily Near-Real-Time: Climate Hazards Center InfraRed Precipitation With Station Data (Version 3.0, IMERG-based)
The Climate Hazards Center Infrared Precipitation with Stations (CHIRPS v3) is a 40+ year, high-resolution quasi-global rainfall dataset. It spans 60°N to 60°S and covers all longitudes, providing data from 1981 to near-present. CHIRPS v3 combines satellite-based thermal infrared rainfall estimates with in-situ station observations …
CHIRPS Precipitation Daily Reanalysis: Climate Hazards Center InfraRed Precipitation With Station Data (Version 3.0, ERA5-based)
The Climate Hazards Center Infrared Precipitation with Stations (CHIRPS v3) is a 40+ year, high-resolution quasi-global rainfall dataset. It spans 60°N to 60°S and covers all longitudes, providing data from 1981 to near-present. CHIRPS v3 combines satellite-based thermal infrared rainfall estimates with in-situ station observations …
CHIRPS Precipitation Daily: Climate Hazards Center InfraRed Precipitation With Station Data (Version 2.0 Final)
Climate Hazards Center InfraRed Precipitation with Station data (CHIRPS) is a 30+ year quasi-global rainfall dataset. CHIRPS incorporates 0.05° resolution satellite imagery with in-situ station data to create gridded rainfall time series for trend analysis and seasonal drought monitoring.
CHIRPS Precipitation Pentad: Climate Hazards Center InfraRed Precipitation With Station Data (Version 2.0 Final)
Climate Hazards Center InfraRed Precipitation with Station data (CHIRPS) is a 30+ year quasi-global rainfall dataset. CHIRPS incorporates 0.05° resolution satellite imagery with in-situ station data to create gridded rainfall time series for trend analysis and seasonal drought monitoring.
CHIRPS Precipitation Pentad: Climate Hazards Center InfraRed Precipitation With Station Data (Version 3.0)
The Climate Hazards Center Infrared Precipitation with Stations (CHIRPS v3) is a 40+ year, high-resolution quasi-global rainfall dataset. It spans 60°N to 60°S and covers all longitudes, providing data from 1981 to near-present. CHIRPS v3 combines satellite-based thermal infrared rainfall estimates with in-situ station observations …
CHIRTS Temperature Daily: Climate Hazards Center InfraRed Temperature with Stations daily data product
The Climate Hazards Center InfraRed Temperature with Stations daily temperature data product (CHIRTS-daily; Verdin et al. 2020) is a quasi global, high-resolution gridded dataset (0.05° × 0.05° resolution, 60°S - 70°N) that provides daily minimum (Tmin) and maximum 2-meter temperatures (Tmax) and four derived variables: saturation vapor …
This dataset provides a gridded analysis of daily surface air temperature over global land areas, including daily maximum (Tmax), minimum (Tmin) temperatures. Spanning from 1979 to the present, the data is presented on 0.5-degree latitude/longitude grids, aligning with the resolution of CPC's gauge-based global daily …
Copernicus Atmosphere Monitoring Service (CAMS) Global Near-Real-Time
The Copernicus Atmosphere Monitoring Service provides the capacity to continuously monitor the composition of the Earth's atmosphere at global and regional scales. The main global near-real-time production system is a data assimilation and forecasting suite providing two 5-day forecasts per day for aerosols and chemical …
Daymet V4: Daily Surface Weather and Climatological Summaries
Daymet V4 provides gridded estimates of daily weather parameters for Continental North America, Hawaii, and Puerto Rico (Data for Puerto Rico is available starting in 1950). It is derived from selected meteorological station data and various supporting data sources. Compared to the previous version, Daymet …
The two related FAO datasets on Drained Organic Soils provide estimates of: DROSA-A: area of Organic Soils (in hectares) drained for agricultural activities (cropland and grazed grassland) DROSE-A: carbon (C) and nitrous oxide (N2O) estimates (in gigagrams) from the agricultural drainage of organic soils under …
This dataset contains 15-day forecasts of the atmospheric model variables generated by the ECMWF Integrated Forecasting System (IFS) at 0.25 degree resolution. We refer to these as Near-Realtime (NRT) because new products are released twice a day after the release of the ECMWF realtime forecast …
This dataset contains 6-day forecasts of the wave model fields generated by the ECMWF Integrated Forecasting System (IFS) at 0.25 degree resolution. We refer to these as Near-Realtime (NRT) because new products are released twice a day after the release of the ECMWF realtime forecast …
This dataset contains 15-day forecasts of the wave model fields generated by the ECMWF Integrated Forecasting System (IFS) at 0.25 degree resolution. We refer to these as Near-Realtime (NRT) because new products are released twice a day after the release of the ECMWF realtime forecast …
ERA5 Daily Aggregates - Latest Climate Reanalysis Produced by ECMWF / Copernicus Climate Change Service
ERA5 is the fifth generation ECMWF atmospheric reanalysis of the global climate. Reanalysis combines model data with observations from across the world into a globally complete and consistent dataset. ERA5 replaces its predecessor, the ERA-Interim reanalysis. ERA5 DAILY provides aggregated values for each day for …
ERA5 is the fifth generation ECMWF atmospheric reanalysis of the global climate. It is produced by the Copernicus Climate Change Service (C3S) at ECMWF. Reanalysis combines model data with observations from across the world into a globally complete and consistent dataset using the laws of …
ERA5 is the fifth generation ECMWF atmospheric reanalysis of the global climate. Reanalysis combines model data with observations from across the world into a globally complete and consistent dataset. ERA5 replaces its predecessor, the ERA-Interim reanalysis. This dataset contains 3D parameters at 37 pressure levels.
ERA5 Monthly Aggregates - Latest Climate Reanalysis Produced by ECMWF / Copernicus Climate Change Service
ERA5 is the fifth generation ECMWF atmospheric reanalysis of the global climate. Reanalysis combines model data with observations from across the world into a globally complete and consistent dataset. ERA5 replaces its predecessor, the ERA-Interim reanalysis. ERA5 MONTHLY provides aggregated values for each month for …
ERA5-Land is a reanalysis dataset providing a consistent view of the evolution of land variables over several decades at an enhanced resolution compared to ERA5. ERA5-Land has been produced by replaying the land component of the ECMWF ERA5 climate reanalysis. Reanalysis combines model data with …
ERA5-Land is a reanalysis dataset providing a consistent view of the evolution of land variables over several decades at an enhanced resolution compared to ERA5. ERA5-Land has been produced by replaying the land component of the ECMWF ERA5 climate reanalysis. Reanalysis combines model data with …
ERA5-Land is a reanalysis dataset providing a consistent view of the evolution of land variables over several decades at an enhanced resolution compared to ERA5. ERA5-Land has been produced by replaying the land component of the ECMWF ERA5 climate reanalysis. Reanalysis combines model data with …
ERA5-Land Monthly Averaged by Hour of Day - ECMWF Climate Reanalysis
ERA5-Land is a reanalysis dataset providing a consistent view of the evolution of land variables over several decades at an enhanced resolution compared to ERA5. ERA5-Land has been produced by replaying the land component of the ECMWF ERA5 climate reanalysis. Reanalysis combines model data with …
ERA5-Land is a reanalysis dataset providing a consistent view of the evolution of land variables over several decades at an enhanced resolution compared to ERA5. ERA5-Land has been produced by replaying the land component of the ECMWF ERA5 climate reanalysis. Reanalysis combines model data with …
FLDAS: Famine Early Warning Systems Network (FEWS NET) Land Data Assimilation System
The FLDAS dataset (McNally et al. 2017), was designed to assist with food security assessments in data-sparse, developing country settings. It includes information on many climate-related variables including moisture content, humidity, evapotranspiration, average soil temperature, total precipitation rate, etc. There are multiple different FLDAS datasets; …
The Farmscapes 2020 dataset provides high-resolution (25cm) probability maps for three key semi-natural features within England's agricultural landscapes: hedgerows, woodland, and stone walls. This dataset was developed in collaboration with the Leverhulme Centre for Nature Recovery at Oxford to serve as a baseline for applications …
This is the vectorised version of the Farmscapes 2020 raster dataset. It provides polygon geometries representing fine-scale semi-natural landscape features (specifically hedgerows, woodland, and stone walls) across England's agricultural landscapes. This dataset was developed in collaboration with the Oxford Leverhulme Centre for Nature Recovery to …
The Forest Typology (ForTy) v1 dataset consists of a global per-class probability map at 10 m resolution covering all land areas between 65°S and 84°N latitude for the year 2020. The six-class typology is aligned with FAO and EU Deforestation Regulation (EUDR) definitions: Class 1 …
This product is the temperature of terrestrial land surface. A newer version JAXA/GCOM-C/L3/LAND/LST/V3 is also available for this dataset which uses this algorithm for processing. GCOM-C conducts long-term and continuous global observation and data collection to elucidate the mechanism behind fluctuations in radiation budget and …
This product is the temperature of terrestrial land surface. For data after 2021-11-28, see the V3 dataset. GCOM-C conducts long-term and continuous global observation and data collection to elucidate the mechanism behind fluctuations in radiation budget and carbon cycle needed to make accurate projections regarding …
This product is the temperature of terrestrial land surface. This is an ongoing dataset with a latency of 3-4 days. GCOM-C conducts long-term and continuous global observation and data collection to elucidate the mechanism behind fluctuations in radiation budget and carbon cycle needed to make …
This product is the temperature of sea surface. A newer version JAXA/GCOM-C/L3/OCEAN/SST/V3 is also available for this dataset which uses this algorithm for processing. GCOM-C conducts long-term and continuous global observation and data collection to elucidate the mechanism behind fluctuations in radiation budget and carbon …
This product is the temperature of sea surface. For data after 2021-11-28, see the V3 dataset. GCOM-C conducts long-term and continuous global observation and data collection to elucidate the mechanism behind fluctuations in radiation budget and carbon cycle needed to make accurate projections regarding future …
This product is the temperature of sea surface. This is an ongoing dataset with a latency of 3-4 days. GCOM-C conducts long-term and continuous global observation and data collection to elucidate the mechanism behind fluctuations in radiation budget and carbon cycle needed to make accurate …
GFS: Global Forecast System 384-Hour Predicted Atmosphere Data
The Global Forecast System (GFS) is a weather forecast model produced by the National Centers for Environmental Prediction (NCEP). The GFS dataset consists of selected model outputs (described below) as gridded forecast variables. The 384-hour forecasts, with 1-hour (up to 120 hours) and 3-hour (after …
NASA Global Land Data Assimilation System Version 2 (GLDAS-2) has three components: GLDAS-2.0, GLDAS-2.1, and GLDAS-2.2. GLDAS-2.0 is forced entirely with the Princeton meteorological forcing input data and provides a temporally consistent series from 1948 through 2014. GLDAS-2.1 is forced with a combination of model …
NASA Global Land Data Assimilation System Version 2 (GLDAS-2) has three components: GLDAS-2.0, GLDAS-2.1, and GLDAS-2.2. GLDAS-2.0 is forced entirely with the Princeton meteorological forcing input data and provides a temporally consistent series from 1948 through 2014. GLDAS-2.1 is forced with a combination of model …
GPM: Global Precipitation Measurement (GPM) Release 07
Global Precipitation Measurement (GPM) is an international satellite mission to provide next-generation observations of rain and snow worldwide every three hours. The Integrated Multi-satellitE Retrievals for GPM (IMERG) is the unified algorithm that provides rainfall estimates combining data from all passive-microwave instruments in the GPM …
GPM: Monthly Global Precipitation Measurement (GPM) v6
IMERG-Final version "06" stopped being produced in September, 2021. Version "07" is expected to be released in September 2022 Global Precipitation Measurement (GPM) is an international satellite mission to provide next-generation observations of rain and snow worldwide every three hours. The Integrated Multi-satellitE Retrievals for …
GPM: Monthly Global Precipitation Measurement (GPM) vRelease 07
Global Precipitation Measurement (GPM) is an international satellite mission to provide next-generation observations of rain and snow worldwide every three hours. The Integrated Multi-satellitE Retrievals for GPM (IMERG) is the unified algorithm that provides rainfall estimates combining data from all passive-microwave instruments in the GPM …
This dataset contains drought indices derived from the 4-km daily Gridded Surface Meteorological (GRIDMET) dataset. The drought indices provided include the standardized precipitation index (SPI), the evaporative drought demand index (EDDI), the standardized precipitation evapotranspiration index (SPEI), the Palmer Drought Severity Index (PDSI) and Palmer …
GRIDMET: University of Idaho Gridded Surface Meteorological Dataset
The Gridded Surface Meteorological dataset provides high spatial resolution (~4-km) daily surface fields of temperature, precipitation, winds, humidity and radiation across the contiguous United States from 1979. The dataset blends the high resolution spatial data from PRISM with the high temporal resolution data from the …
GSMaP Operational: Global Satellite Mapping of Precipitation - V6
Global Satellite Mapping of Precipitation (GSMaP) provides a global hourly rain rate with a 0.1 x 0.1 degree resolution. GSMaP is a product of the Global Precipitation Measurement (GPM) mission, which provides global precipitation observations at three hour intervals. Values are estimated using multi-band passive …
GSMaP Operational: Global Satellite Mapping of Precipitation - V7
Global Satellite Mapping of Precipitation (GSMaP) provides a global hourly rain rate with a 0.1 x 0.1 degree resolution. GSMaP is a product of the Global Precipitation Measurement (GPM) mission, which provides global precipitation observations at three hour intervals. Values are estimated using multi-band passive …
GSMaP Operational: Global Satellite Mapping of Precipitation - V8
Global Satellite Mapping of Precipitation (GSMaP) provides a global hourly rain rate with a 0.1 x 0.1 degree resolution. GSMaP is a product of the Global Precipitation Measurement (GPM) mission, which provides global precipitation observations at three hour intervals. Values are estimated using multi-band passive …
GSMaP Reanalysis: Global Satellite Mapping of Precipitation
Global Satellite Mapping of Precipitation (GSMaP) provides a global hourly rain rate with a 0.1 x 0.1 degree resolution. GSMaP is a product of the Global Precipitation Measurement (GPM) mission, which provides global precipitation observations at three hour intervals. Values are estimated using multi-band passive …
Since their introduction in 2012, Local Climate Zones (LCZs) emerged as a new standard for characterizing urban landscapes, providing a holistic classification approach that takes into account micro-scale land-cover and associated physical properties. This global map of Local Climate Zones, at 100m pixel size and …
International Best Track Archive for Climate Stewardship Project
The International Best Track Archive for Climate Stewardship (IBTrACS) provides location and intensity for global tropical cyclones. The data span from the 1840s to present, generally providing data at 3-hour intervals. While the best track data is focused on position and intensity (maximum sustained wind …
LST Day: Malaria Atlas Project Gap-Filled Daytime Land Surface Temperature (8-Daily 1km)
Daytime Land Surface Temperature (LST) are derived from the ~1km MODIS MOD11A2 v6.1 products. The 8-daily composites are converted to degrees Celsius and then gap-filled using the approach outlined in Weiss et al (2014) to eliminate missing data caused by factors such as cloud cover. …
LST Day: Malaria Atlas Project Gap-Filled Daytime Land Surface Temperature (Annual 1km)
Daytime Land Surface Temperature (LST) are derived from the ~1km MODIS MOD11A2 v6.1 products. The 8-daily composites are converted to degrees Celsius and then gap-filled using the approach outlined in Weiss et al (2014) to eliminate missing data caused by factors such as cloud cover. …
LST Day: Malaria Atlas Project Gap-Filled Daytime Land Surface Temperature (Monthly 1km)
Daytime Land Surface Temperature (LST) are derived from the ~1km MODIS MOD11A2 v6.1 products. The 8-daily composites are converted to degrees Celsius and then gap-filled using the approach outlined in Weiss et al (2014) to eliminate missing data caused by factors such as cloud cover. …
LST Night: Malaria Atlas Project Gap-Filled Nighttime Land Surface Temperature (8-Daily 1km)
Nighttime Land Surface Temperature (LST) are derived from the ~1km MODIS MOD11A2 v6.1 products. The 8-daily composites are converted to degrees Celsius and then gap-filled using the approach outlined in Weiss et al (2014) to eliminate missing data caused by factors such as cloud cover. …
LST Night: Malaria Atlas Project Gap-Filled Nighttime Land Surface Temperature (Annual 1km)
Nighttime Land Surface Temperature (LST) are derived from the ~1km MODIS MOD11A2 v6.1 products. The 8-daily composites are converted to degrees Celsius and then gap-filled using the approach outlined in Weiss et al (2014) to eliminate missing data caused by factors such as cloud cover. …
LST Night: Malaria Atlas Project Gap-Filled Nighttime Land Surface Temperature (Monthly 1km)
Nighttime Land Surface Temperature (LST) are derived from the ~1km MODIS MOD11A2 v6.1 products. The 8-daily composites are converted to degrees Celsius and then gap-filled using the approach outlined in Weiss et al (2014) to eliminate missing data caused by factors such as cloud cover. …
MACAv2-METDATA Monthly Summaries: University of Idaho, Multivariate Adaptive Constructed Analogs Applied to Global Climate Models
The MACAv2-METDATA dataset is a collection of 20 global climate models covering the conterminous USA. The Multivariate Adaptive Constructed Analogs (MACA) method is a statistical downscaling method which utilizes a training dataset (ie a meteorological observation dataset) to remove historical biases and match spatial patterns …
MACAv2-METDATA: University of Idaho, Multivariate Adaptive Constructed Analogs Applied to Global Climate Models
The MACAv2-METDATA dataset is a collection of 20 global climate models covering the conterminous USA. The Multivariate Adaptive Constructed Analogs (MACA) method is a statistical downscaling method which utilizes a training dataset (ie a meteorological observation dataset) to remove historical biases and match spatial patterns …
The MCD18A1 Version 6.2 is a Moderate Resolution Imaging Spectroradiometer (MODIS) Terra and Aqua combined Downward Shortwave Radiation (DSR) gridded Level 3 product produced daily at 1 kilometer pixel resolution with estimates of DSR every 3 hours. DSR is incident solar radiation over land surfaces …
MCD18C2.062 Photosynthetically Active Radiation Daily 3-Hour
The MCD18C2 Version 6.2 is a Moderate Resolution Imaging Spectroradiometer (MODIS) Terra and Aqua combined Photosynthetically Active Radiation (PAR) gridded Level 3 product produced daily at 0.05 degree (5,600 meters at the equator) resolution with estimates of PAR every 3 hours. PAR is incident solar …
M2T1NXFLX (or tavg1_2d_flx_Nx) is an hourly time-averaged data collection in Modern-Era Retrospective analysis for Research and Applications version 2 (MERRA-2). This collection consists of assimilated surface flux diagnostics, such as total precipitation, bias corrected total precipitation, surface air temperature, surface specific humidity, surface wind speed, …
MERRA-2 M2T1NXLND: Land Surface Diagnostics V5.12.4
M2T1NXLND (or tavg1_2d_lnd_Nx) is an hourly time-averaged data collection in Modern-Era Retrospective analysis for Research and Applications version 2 (MERRA-2). This collection consists of land surface diagnostics, such a baseflow flux, runoff, surface soil wetness, root zone soil wetness, water at surface layer, water at …
M2T1NXRAD (or tavg1_2d_rad_Nx) is an hourly time-averaged data collection in Modern-Era Retrospective analysis for Research and Applications version 2 (MERRA-2). This collection consists of radiation diagnostics, such as surface albedo, cloud area fraction, in cloud optical thickness, surface incoming shortwave flux (ie solar radiation), surface …
M2T1NXSLV (or tavg1_2d_slv_Nx) is an hourly time-averaged 2-dimensional data collection in Modern-Era Retrospective analysis for Research and Applications version 2 (MERRA-2). This collection consists of meteorology diagnostics at popularly used vertical levels, such as air temperature at 2-meter (or at 10-meter, 850hPa, 500 hPa, 250hPa), …
MOD08_M3.061 Terra Atmosphere Monthly Global Product
MOD08_M3 V6.1 is an atmosphere global product that contains monthly 1 x 1 degree grid average values of atmospheric parameters. These parameters are related to atmospheric aerosol particle properties, total ozone burden, atmospheric water vapor, cloud optical and physical properties, and atmospheric stability indices. The …
MOD11A1.061 Terra Land Surface Temperature and Emissivity Daily Global 1km
The MOD11A1 V6.1 product provides daily land surface temperature (LST) and emissivity values in a 1200 x 1200 kilometer grid. The temperature value is derived from the MOD11_L2 swath product. Above 30 degrees latitude, some pixels may have multiple observations where the criteria for clear-sky …
MOD11A2.061 Terra Land Surface Temperature and Emissivity 8-Day Global 1km
The MOD11A2 V6.1 product provides an average 8-day land surface temperature (LST) in a 1200 x 1200 kilometer grid. Each pixel value in MOD11A2 is a simple average of all the corresponding MOD11A1 LST pixels collected within that 8 day period. The MOD11A2 does a …
MOD21A1D.061 Terra Land Surface Temperature and 3-Band Emissivity Daily Global 1km
The MOD21A1D dataset is produced daily from daytime Level 2 Gridded (L2G) intermediate LST products at a spatial resolution of 1,000 meters. The L2G process maps the daily MOD21 swath granules onto a sinusoidal MODIS grid and stores all observations falling over a gridded cell …
MOD21A1N.061 Terra Land Surface Temperature and 3-Band Emissivity Daily Global 1km
The MOD21A1N dataset is produced daily from nighttime Level 2 Gridded (L2G) intermediate LST products at a spatial resolution of 1,000 meters. The L2G process maps the daily MOD21 swath granules onto a sinusoidal MODIS grid and stores all observations falling over a gridded cell …
MOD21C1.061 Terra Land Surface Temperature and 3-Band Emissivity Daily L3 Global 0.05 Deg CMG
The MOD21C1 dataset is produced daily in a 0.05 degree (5,600 meters at the equator) Climate Modeling Grid (CMG) from daytime Level 2 Gridded (L2G) intermediate LST products. The L2G process maps the daily MOD21 swath granules onto a sinusoidal MODIS grid and stores all …
MOD21C2.061 Terra Land Surface Temperature and 3-Band Emissivity 8-Day L3 Global 0.05 Deg CMG
The MOD21C2 dataset is an 8-day composite LST product that uses an algorithm based on a simple averaging method. The algorithm calculates the average from all the cloud free MOD21A1D and MOD21A1N daily acquisitions from the 8-day period. Unlike the MOD21A1 data sets where the …
MOD21C3.061 Terra Land Surface Temperature and 3-Band Emissivity Monthly L3 Global 0.05 Deg CMG
The MOD21C3 dataset is a monthly composite LST product that uses an algorithm based on a simple averaging method. The algorithm calculates the average from all the cloud free MOD21A1D and MOD21A1N daily acquisitions from the 8-day period. Unlike the MOD21A1 data sets where the …
MYD08_M3.061 Aqua Atmosphere Monthly Global Product
MYD08_M3 V6.1 is an atmosphere global product that contains monthly 1 x 1 degree grid average values of atmospheric parameters. These parameters are related to atmospheric aerosol particle properties, total ozone burden, atmospheric water vapor, cloud optical and physical properties, and atmospheric stability indices. The …
MYD11A1.061 Aqua Land Surface Temperature and Emissivity Daily Global 1km
The MYD11A1 V6.1 product provides daily land surface temperature (LST) and emissivity values in a 1200 x 1200 kilometer grid. The temperature value is derived from the MYD11_L2 swath product. Above 30 degrees latitude, some pixels may have multiple observations where the criteria for clear-sky …
MYD11A2.061 Aqua Land Surface Temperature and Emissivity 8-Day Global 1km
The MYD11A2 V6.1 product provides an average 8-day land surface temperature (LST) in a 1200 x 1200 kilometer grid. Each pixel value in MYD11A2 is a simple average of all the corresponding MYD11A1 LST pixels collected within that 8 day period. The MYD11A2 does a …
MYD21A1D.061 Aqua Land Surface Temperature and 3-Band Emissivity Daily Global 1km
The MYD21A1D dataset is produced daily from daytime Level 2 Gridded (L2G) intermediate LST products at a spatial resolution of 1,000 meters. The L2G process maps the daily MOD21 swath granules onto a sinusoidal MODIS grid and stores all observations falling over a gridded cell …
MYD21A1N.061 Aqua Land Surface Temperature and 3-Band Emissivity Daily Global 1km
The MYD21A1N dataset is produced daily from nighttime Level 2 Gridded (L2G) intermediate LST products at a spatial resolution of 1,000 meters. The L2G process maps the daily MOD21 swath granules onto a sinusoidal MODIS grid and stores all observations falling over a gridded cell …
MYD21C1.061 Aqua Land Surface Temperature and 3-Band Emissivity Daily L3 Global 0.05 Deg CMG
The MYD21C1 dataset is produced daily in a 0.05 degree (5,600 meters at the equator) Climate Modeling Grid (CMG) from daytime Level 2 Gridded (L2G) intermediate LST products. The L2G process maps the daily MYD21 swath granules onto a sinusoidal MODIS grid and stores all …
MYD21C2.061 Aqua Land Surface Temperature and 3-Band Emissivity 8-Day L3 Global 0.05 Deg CMG
The MYD21C2 dataset is an 8-day composite LST product that uses an algorithm based on a simple averaging method. The algorithm calculates the average from all the cloud free MYD21A1D and MYD21A1N daily acquisitions from the 8-day period. Unlike the MYD21A1 data sets where the …
MYD21C3.061 Aqua Land Surface Temperature and 3-Band Emissivity Monthly L3 Global 0.05 Deg CMG
The MYD21C3 dataset is a monthly composite LST product that uses an algorithm based on a simple averaging method. The algorithm calculates the average from all the cloud free MYD21A1D and MYD21A1N daily acquisitions from the 8-day period. Unlike the MYD21A1 data sets where the …
This dataset provides geospatial data for the total column dry air mole fraction of methane in the atmosphere, "XCH4", as observed by the MethaneAIR imaging spectrometer. XCH4 is defined as the total column amount (number of molecules) of methane ("CH4") divided by the total amount …
This dataset provides geospatial data for the total column dry air mole fraction of methane in the atmosphere, "XCH4", as observed by the MethaneAIR imaging spectrometer. XCH4 is defined as the total column amount (number of molecules) of methane ("CH4") divided by the total amount …
The area emissions model is still in development and not representative of a final product. This dataset provides spatially disaggregated methane emission fluxes (kg/hr) using measurements from MethaneAIR flights focused on oil and gas producing regions throughout the United States. Total emissions for the survey …
This dataset provides data for high-emitting methane point source detections (kg/hr) over 13 oil and gas or coal extraction areas from Colorado, New Mexico, and Texas in the west to Pennsylvania, Ohio, and West Virginia in the east, plus three urban areas (New York City, …
This dataset provides data for high-emitting methane point source detections (kg/hr) over 13 oil and gas or coal extraction areas from Colorado, New Mexico, and Texas in the west to Pennsylvania, Ohio, and West Virginia in the east, plus three urban areas (New York City, …
This early "Public Preview" dataset provides geospatial data for the column-averaged dry-air mole fraction of methane in the atmosphere, "XCH4", retrieved from measurements by the MethaneSAT imaging spectrometer. XCH4 is defined as the total column amount (number of molecules above a unit surface area) of …
The dispersed area emissions model is still in development and not representative of a final product. This early "Public Preview" dataset provides high precision data for methane emissions from dispersed area sources. These emissions data come from the Appalachian, Permian, and Uinta basins in the …
The dispersed area emissions model is still in development and not representative of a final product. This early "Public Preview" dataset provides high precision data for methane emissions from dispersed area sources. These novel measurements demonstrate the importance of quantifying total methane emissions with high …
This early "Public Preview" dataset provides high precision data for methane emissions from discrete point sources. These methane emission fluxes were produced using a point source detection and emissions quantification framework specialized to exploit the high spatial resolution, wide spatial coverage, and high precision of …
NCEP-DOE Reanalysis 2 (Gaussian Grid), Total Cloud Coverage
This collection is no longer being updated. The Model is no longer being updated at the source. NCEP-DOE Reanalysis 2 project is using a state-of-the-art analysis/forecast system to perform data assimilation using past data from 1979 through the previous year.
The NCEP/NCAR Reanalysis Project is a joint project between the National Centers for Environmental Prediction (NCEP, formerly "NMC") and the National Center for Atmospheric Research (NCAR). The goal of this joint effort is to produce new atmospheric analyses using historical data as well as to …
NCEP/NCAR Reanalysis Data, Surface Temperature [deprecated]
The NCEP/NCAR Reanalysis Project is a joint project between the National Centers for Environmental Prediction (NCEP, formerly "NMC") and the National Center for Atmospheric Research (NCAR). The goal of this joint effort is to produce new atmospheric analyses using historical data as well as to …
NCEP/NCAR Reanalysis Data, Water Vapor [deprecated]
The NCEP/NCAR Reanalysis Project is a joint project between the National Centers for Environmental Prediction (NCEP, formerly "NMC") and the National Center for Atmospheric Research (NCAR). The goal of this joint effort is to produce new atmospheric analyses using historical data as well as to …
NEX-DCP30: Ensemble Stats for NASA Earth Exchange Downscaled Climate Projections
The NASA NEX-DCP30 dataset is comprised of downscaled climate scenarios for the conterminous United States that are derived from the General Circulation Model (GCM) runs conducted under the Coupled Model Intercomparison Project Phase 5 (CMIP5, see Taylor et al. 2012) and across the four greenhouse …
NEX-DCP30: NASA Earth Exchange Downscaled Climate Projections
The NASA NEX-DCP30 dataset is comprised of downscaled climate scenarios for the conterminous United States that are derived from the General Circulation Model (GCM) runs conducted under the Coupled Model Intercomparison Project Phase 5 (CMIP5, see Taylor et al. 2012) and across the four greenhouse …
NEX-GDDP-CMIP6: NASA Earth Exchange Global Daily Downscaled Climate Projections
The NEX-GDDP-CMIP6 dataset is comprised of global downscaled climate scenarios derived from the General Circulation Model (GCM) runs conducted under the Coupled Model Intercomparison Project Phase 6 (CMIP6, see Thrasher et al. 2022) and across two of the four "Tier 1" greenhouse gas emissions scenarios …
NEX-GDDP: NASA Earth Exchange Global Daily Downscaled Climate Projections
The NASA NEX-GDDP dataset is comprised of downscaled climate scenarios for the globe that are derived from the General Circulation Model (GCM) runs conducted under the Coupled Model Intercomparison Project Phase 5 (CMIP5, see Taylor et al. 2012) and across two of the four greenhouse …
NLDAS-2: North American Land Data Assimilation System Forcing Fields
Land Data Assimilation System (LDAS) combines multiple sources of observations (such as precipitation gauge data, satellite data, and radar precipitation measurements) to produce estimates of climatological properties at or near the Earth''s surface. This dataset is the primary (default) forcing file (File A) for Phase …
NOAA CDR GRIDSAT-B1: Geostationary IR Channel Brightness Temperature
Note: This dataset has not been updated by the provider since 2024-03-31 due to ongoing infrastructure updates. There is no current timeline for when dataset updates will resume. This dataset provides a high quality Climate Data Record (CDR) of global infrared measurements from geostationary satellites. …
NOAA CDR PATMOSX: Cloud Properties, Reflectance, and Brightness Temperatures, Version 5.3
This dataset provides high quality Climate Data Record (CDR) of multiple cloud properties along with Advanced Very High Resolution Radiometer (AVHRR) Pathfinder Atmospheres Extended (PATMOS-x) brightness temperatures and reflectances. These data have been fitted to a 0.1 x 0.1 equal angle-grid with both ascending and …
Natural Forests of the World 2020, provides a global map of natural forest probability for the year 2020 at a 10-meter resolution. It was developed to support initiatives like the European Union's Deforestation Regulation (EUDR) and other efforts for forest conservation and monitoring. The map …
OpenLandMap Long-term Land Surface Temperature Daytime Monthly Median
Land Surface Temperature daytime monthly mean value 2000-2017. Derived using the data.table package and quantile function in R. For more info about the MODIS LST product see this page. Antarctica is not included. To access and visualize maps outside of Earth Engine, use this page. …
OpenLandMap Long-term Land Surface Temperature Daytime Monthly Standard Deviation
Long-term MODIS LST day-time and night-time temperatures standard deviation at 1 km based on the 2000-2017 time series. Derived using the data.table package and quantile function in R. For more info about the MODIS LST product see this page. Antarctica is not included. To access …
OpenLandMap Long-term Land Surface Temperature Monthly Day-Night Difference
Long-term MODIS LST day-time and night-time differences at 1 km based on the 2000-2017 time series Derived using the data.table package and quantile function in R. For more info about the MODIS LST product see this page. Antarctica is not included. To access and visualize …
Oya is a quasi-global, high-resolution precipitation estimation dataset derived from geostationary (GEO) satellite observations. The Oya model utilizes the full spectrum of visible and infrared (VIS-IR) channels from a constellation of GEO satellites — including GOES-16/18, Meteosat-9/10, and Himawari-8/9 — to generate precipitation estimates covering …
PERSIANN-CDR: Precipitation Estimation From Remotely Sensed Information Using Artificial Neural Networks-Climate Data Record
PERSIANN-CDR is a daily quasi-global precipitation product that spans the period from 1983-01-01 to present. The data is produced quarterly, with a typical lag of three months. The product is developed by the Center for Hydrometeorology and Remote Sensing at the University of California, Irvine …
The PRISM daily and monthly datasets are gridded climate datasets for the conterminous United States, produced by the PRISM Climate Group at Oregon State University. This collection contains both AN81 and AN91 data, indicated by the 'dataset_type' property. Grids are developed using PRISM (Parameter-elevation Regressions …
The PRISM daily and monthly datasets are gridded climate datasets for the conterminous United States, produced by the PRISM Climate Group at Oregon State University. Grids are developed using PRISM (Parameter-elevation Regressions on Independent Slopes Model). PRISM interpolation routines simulate how weather and climate vary …
The PRISM daily and monthly datasets are gridded climate datasets for the conterminous United States, produced by the PRISM Climate Group at Oregon State University. This collection contains both AN81 and AN91 data, as indicated by the 'dataset_type' property. Grids are developed using PRISM (Parameter-elevation …
The Real-Time Mesoscale Analysis (RTMA) is a high-spatial and temporal resolution analysis for near-surface weather conditions. This dataset includes hourly analyses at 2.5 km for CONUS.
Reprocessed GLDAS-2.0: Global Land Data Assimilation System
NASA Global Land Data Assimilation System Version 2 (GLDAS-2) has three components: GLDAS-2.0, GLDAS-2.1, and GLDAS-2.2. GLDAS-2.0 is forced entirely with the Princeton meteorological forcing input data and provides a temporally consistent series from 1948 through 2014. GLDAS-2.1 is forced with a combination of model …
SPEIbase: Standardised Precipitation-Evapotranspiration Index database, Version 2.11
The Global SPEI database (SPEIbase) offers long-time robust information about drought conditions at the global scale, with a 0.5 degree pixel size and monthly cadence. It provides SPEI time scales from 1 to 48 months. The Standardized Precipitation-Evapotranspiration Index (SPEI) expresses, as a standardized variate …
OFFL/L3_CH4 This dataset provides offline high-resolution imagery of methane concentrations. Methane (CH4) is, after carbon dioxide (CO2), the most important contributor to the anthropogenically enhanced greenhouse effect. Roughly three-quarters of methane emissions are anthropogenic and as such, it is important to continue the record of …
The Total Ozone Mapping Spectrometer (TOMS) data represent the primary long-term, continuous record of satellite-based observations available for use in monitoring global and regional trends in total ozone over the past 25 years. The data are produced by the Laboratory for Atmospheres at NASA's Goddard …
The Tropical Rainfall Measuring Mission (TRMM) is a joint mission between NASA and the Japan Aerospace Exploration Agency (JAXA) designed to monitor and study tropical rainfall. The 34B2 product contains a gridded, TRMM-adjusted, merged infrared precipitation (mm/hr) and RMS precipitation-error estimate, with a 3-hour temporal …
This collection is no longer being updated. See IMERG monthly This dataset algorithmically merges microwave data from multiple satellites, including SSMI, SSMIS, MHS, AMSU-B and AMSR-E, each inter-calibrated to the TRMM Combined Instrument. Algorithm 3B43 is executed once per calendar month to produce the single, …
TerraClimate: Monthly Climate and Climatic Water Balance for Global Terrestrial Surfaces, University of Idaho
TerraClimate is a dataset of monthly climate and climatic water balance for global terrestrial surfaces. It uses climatically aided interpolation, combining high-spatial resolution climatological normals from the WorldClim dataset, with coarser spatial resolution, but time-varying data from CRU Ts4.0 and the Japanese 55-year Reanalysis (JRA55). …
The Climate Hazards Center (CHC) Coupled Model Intercomparison Project Phase 6 (CHC-CMIP6)
CHC-CMIP6 was explicitly developed to support the analysis of climate-related hazards over the recent past and in the near-future. This climate projection dataset contains global, daily gridded data for the observational (1983-2016) and projection (2030 and 2050) periods to be used in the identification and …
The two related FAO datasets on Drained Organic Soils provide estimates of: DROSA-A: area of Organic Soils (in hectares) drained for agricultural activities (cropland and grazed grassland) DROSE-A: carbon (C) and nitrous oxide (N2O) estimates (in gigagrams) from the agricultural drainage of organic soils under …
VNP21A1D.002: Day Land Surface Temperature and Emissivity Daily 1km
The NASA Suomi National Polar-Orbiting Partnership (Suomi NPP) Visible Infrared Imaging Radiometer Suite (VIIRS) Land Surface Temperature and Emissivity (LST&E) Day Version 1 product (VNP21A1D) is compiled daily from daytime Level 2 Gridded (L2G) intermediate products. The L2G process maps the daily VNP21 swath granules …
VNP21A1N.002: Night Land Surface Temperature and Emissivity Daily 1km
The NASA Suomi National Polar-Orbiting Partnership (Suomi NPP) Visible Infrared Imaging Radiometer Suite (VIIRS) Land Surface Temperature and Emissivity (LST&E) Night Version 1 product (VNP21A1N) is compiled daily from nighttime Level 2 Gridded (L2G) intermediate products. The L2G process maps the daily VNP21 swath granules …
WeatherNext 2 یک مجموعه داده آزمایشی از پیشبینیهای آب و هوایی گروهی میانبرد جهانی است که توسط یک نسخه عملیاتی از مدل آب و هوایی مولد شبکه عملکردی گوگل دیپمایند تولید شده است. این مجموعه داده آزمایشی شامل دادههای بلادرنگ و دادههای تاریخی است. دادههای بلادرنگ هر دادهای است که مربوط به زمانی است که ...
میانگین WeatherNext 2 میانگین 64 گروه از یک مجموعه داده آزمایشی از پیشبینیهای آب و هوایی گروهی میانبرد جهانی است که توسط یک نسخه عملیاتی از مدل آب و هوایی مولد شبکه عملکردی گوگل دیپمایند تولید شده است. برای مجموعه دادهای که شامل همه اعضای گروه است، لطفاً به WeatherNext 2 (غیر میانگین) مراجعه کنید...
مجموعه داده WeatherNext 3 (0.05°) یک مجموعه داده آزمایشی از پیشبینیهای آب و هوایی گروهی میانبرد جهانی توسط Google DeepMind و Google Research است که توسط یک نسخه عملیاتی از مدل شرح داده شده در: WeatherNext 3: افزایش وضوح و عملکرد مدلهای آب و هوایی جهانی با مشاهدات خام تولید شده است. دسترسی به دادهها ...
مجموعه داده WeatherNext 3 (0.1°) یک مجموعه داده آزمایشی از پیشبینیهای آب و هوایی گروهی میانبرد جهانی توسط Google DeepMind و Google Research است که توسط یک نسخه عملیاتی از مدل شرح داده شده در: WeatherNext 3: افزایش وضوح و عملکرد مدلهای آب و هوایی جهانی با مشاهدات خام تولید شده است. دسترسی به دادهها ...
WorldClim V1 Bioclim provides bioclimatic variables that are derived from the monthly temperature and rainfall in order to generate more biologically meaningful values. The bioclimatic variables represent annual trends (eg, mean annual temperature, annual precipitation), seasonality (eg, annual range in temperature and precipitation), and extreme …
WorldClim version 1 has average monthly global climate data for minimum, mean, and maximum temperature and for precipitation. WorldClim version 1 was developed by Robert J. Hijmans, Susan Cameron, and Juan Parra, at the Museum of Vertebrate Zoology, University of California, Berkeley, in collaboration with …
This dataset contains annual, summertime, and wintertime surface urban heat island (SUHI) intensities for day and night for over 10,000 urban clusters throughout the world. The dataset was created using the MODIS 8-day TERRA and AQUA land surface temperature (LST) products, the Landscan urban extent …
YCEO Surface Urban Heat Islands: Pixel-Level Composites of Yearly Summertime Daytime and Nighttime Intensity
This dataset contains annual, summertime, and wintertime surface urban heat island (SUHI) intensities for day and night for over 10,000 urban clusters throughout the world. The dataset was created using the MODIS 8-day TERRA and AQUA land surface temperature (LST) products, the Landscan urban extent …
YCEO Surface Urban Heat Islands: Pixel-Level Yearly Composites of Wintertime Daytime and Nighttime Intensity
This dataset contains annual, summertime, and wintertime surface urban heat island (SUHI) intensities for day and night for over 10,000 urban clusters throughout the world. The dataset was created using the MODIS 8-day TERRA and AQUA land surface temperature (LST) products, the Landscan urban extent …
YCEO Surface Urban Heat Islands: Spatially-Averaged Daytime and Nighttime Intensity for Annual, Summer, and Winter
This dataset contains annual, summertime, and wintertime surface urban heat island (SUHI) intensities for day and night for over 10,000 urban clusters throughout the world. The dataset was created using the MODIS 8-day TERRA and AQUA land surface temperature (LST) products, the Landscan urban extent …
YCEO Surface Urban Heat Islands: Spatially-Averaged Monthly Composites of Daytime and Nighttime Intensity
This dataset contains annual, summertime, and wintertime surface urban heat island (SUHI) intensities for day and night for over 10,000 urban clusters throughout the world. The dataset was created using the MODIS 8-day TERRA and AQUA land surface temperature (LST) products, the Landscan urban extent …
YCEO Surface Urban Heat Islands: Spatially-Averaged Yearly Composites of Annual Daytime and Nighttime Intensity
This dataset contains annual, summertime, and wintertime surface urban heat island (SUHI) intensities for day and night for over 10,000 urban clusters throughout the world. The dataset was created using the MODIS 8-day TERRA and AQUA land surface temperature (LST) products, the Landscan urban extent …
[[["درک آسان","easyToUnderstand","thumb-up"],["مشکلم را برطرف کرد","solvedMyProblem","thumb-up"],["غیره","otherUp","thumb-up"]],[["اطلاعاتی که نیاز دارم وجود ندارد","missingTheInformationINeed","thumb-down"],["بیشازحد پیچیده/ مراحل بسیار زیاد","tooComplicatedTooManySteps","thumb-down"],["قدیمی","outOfDate","thumb-down"],["مشکل ترجمه","translationIssue","thumb-down"],["مشکل کد / نمونهها","samplesCodeIssue","thumb-down"],["غیره","otherDown","thumb-down"]],[],[],["The datasets encompass climate, atmospheric, and environmental monitoring, sourced from institutions like Copernicus, ECMWF, JAXA, and the University of Idaho. Key categories include methane monitoring, featuring high-resolution concentration and emission data from MethaneAIR and Sentinel-5P. Climate reanalysis is provided through ERA5 aggregates. Drought and precipitation are covered by datasets like SPEIbase, GRIDMET, and GSMaP. Atmospheric composition is monitored by CAMS, and climate modeling includes MACAv2-METDATA and TerraClimate. GCOM-C/SGLI measures land and sea surface temperatures. Moreover, there are others datasets, like CHIRPS and WorldClim, that focus on rainfall, temperature, and urban heat island, and datasets provided by NCEP and NASA related to land and atmosphere.\n"]]