Page Summary
-
The U.S. Drought Monitor provides a weekly map of drought conditions across the U.S.
-
It uses five classifications ranging from abnormally dry (D0) to exceptional drought (D4).
-
The dataset is a collaborative effort by the National Drought Mitigation Center, NOAA, and USDA.
-
This dataset is part of a Community Catalog and not managed by Google Earth Engine.
-
Data is available from 2000 to 2025 and is licensed under an Open data license.
- Catalog Owner
- Awesome GEE Community Catalog
- Dataset Availability
- 2000-01-04T00:00:00Z–2026-05-05T00:00:00Z
- Dataset Producer
- National Drought Mitigation Center
- Tags
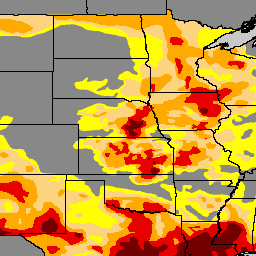
Description
The U.S. Drought Monitor is a map released every Thursday, showing parts of the U.S. that are in drought. The map uses five classifications: abnormally dry (D0), showing areas that may be going into or are coming out of drought, and four levels of drought: moderate (D1), severe (D2), extreme (D3) and exceptional (D4). The Drought Monitor has been a team effort since its inception in 1999, produced jointly by the National Drought Mitigation Center (NDMC) at the University of Nebraska-Lincoln, the National Oceanic and Atmospheric Administration (NOAA), and the U.S. Department of Agriculture (USDA). The NDMC hosts the web site of the drought monitor and the associated data, and provides the map and data to NOAA, USDA and other agencies. It is freely available at droughtmonitor.unl.edu.
Bands
Bands
Pixel size: 250 meters (all bands)
| Name | Min | Max | Pixel Size | Description |
|---|---|---|---|---|
DM |
0 | 4 | 250 meters | Drought classes |
Terms of Use
Terms of Use
The work is licensed under an Open data license for use. The U.S. Drought Monitor is jointly produced by the National Drought Mitigation Center at the University of Nebraska-Lincoln, the United States Department of Agriculture and the National Oceanic and Atmospheric Administration. Map courtesy of NDMC.
Citations
National Drought Mitigation Center; U.S. Department of Agriculture; National Oceanic and Atmospheric Administration (2023). United States Drought Monitor. University of Nebraska-Lincoln. https://droughtmonitor.unl.edu/. Accessed 2023-09-17
Explore with Earth Engine
Code Editor (JavaScript)
var usdm = ee.ImageCollection(
  "projects/sat-io/open-datasets/us-drought-monitor"
);
/*
Category	Description
DO	Abnormally Dry
D1	Moderate Drought
D2	Severe Drought
D3	Extreme Drought
D4	Exceptional Drought
*/

var usdm = ee.Image(usdm.toList(usdm.size()).get(-1));

// Define a dictionary which will be used to make legend and visualize image on map
var dict = {
  names: [
    "DO	Abnormally Dry", //1
    "D1 Moderate Drought", //2
    "D2 Severe Drought", //3
    "D3 Extreme Drought", //4
    "D4 Exceptional Drought", //5
  ],
  colors: ["FFFF00", "FCD37F", "FFAA00", "E60000", "730000"],
};

// Create a panel to hold the legend widget
var legend = ui.Panel({
  style: {
    position: "bottom-left",
    padding: "8px 15px",
  },
});

// Function to generate the legend
function addCategoricalLegend(panel, dict, title) {
  // Create and add the legend title.
  var legendTitle = ui.Label({
    value: title,
    style: {
      fontWeight: "bold",
      fontSize: "18px",
      margin: "0 0 4px 0",
      padding: "0",
    },
  });
  panel.add(legendTitle);

  var loading = ui.Label("Loading legend...", { margin: "2px 0 4px 0" });
  panel.add(loading);

  // Creates and styles 1 row of the legend.
  var makeRow = function (color, name) {
    // Create the label that is actually the colored box.
    var colorBox = ui.Label({
      style: {
        backgroundColor: color,
        // Use padding to give the box height and width.
        padding: "8px",
        margin: "0 0 4px 0",
      },
    });

    // Create the label filled with the description text.
    var description = ui.Label({
      value: name,
      style: { margin: "0 0 4px 6px" },
    });

    return ui.Panel({
      widgets: [colorBox, description],
      layout: ui.Panel.Layout.Flow("horizontal"),
    });
  };

  // Get the list of palette colors and class names from the image.
  var palette = dict["colors"];
  var names = dict["names"];
  loading.style().set("shown", false);

  for (var i = 0; i < names.length; i++) {
    panel.add(makeRow(palette[i], names[i]));
  }

  Map.add(panel);
}

/*
  // Display map and legend ///////////////////////////////////////////////////////////////////////////////
*/

// Add the legend to the map
addCategoricalLegend(legend, dict, "US Drought Monitor");

// Add USDM Image image to the map
Map.addLayer(
  usdm,
  { min: 0, max: 4, palette: dict["colors"] },
  usdm.get("system:index").getInfo()
);