Page Summary
-
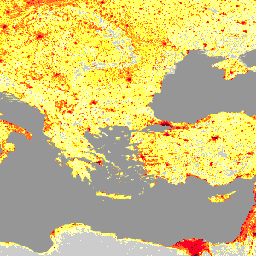
The LandScan dataset provides a high-resolution global population distribution from 2000 to 2023.
-
Provided by the Oak Ridge National Laboratory (ORNL), it offers detailed population counts and density at a 30 arc-second resolution.
-
This dataset is valuable for applications like urban planning, disaster response, epidemiology, and environmental research.
-
Landscan datasets are available under the Creative Commons Attribution 4.0 International License with required source attribution.
- Catalog Owner
- Awesome GEE Community Catalog
- Dataset Availability
- 2000-01-01T00:00:00Z–2023-12-31T00:00:00Z
- Dataset Producer
- Oak Ridge National Laboratory
- Tags
Description
The LandScan dataset, provided by the Oak Ridge National Laboratory (ORNL), offers a comprehensive and high-resolution global population distribution dataset that serves as a valuable resource for a wide range of applications. Leveraging state-of-the-art spatial modeling techniques and advanced geospatial data sources, LandScan provides detailed information on population counts and density at a 30 arc-second resolution, enabling precise and up-to-date insights into human settlement patterns across the globe. With its accuracy and granularity, LandScan supports diverse fields such as urban planning, disaster response, epidemiology, and environmental research, making it an essential tool for decision-makers and researchers seeking to understand and address various societal and environmental challenges on a global scale.
Bands
Bands
Pixel size: 1000 meters (all bands)
| Name | Min | Max | Pixel Size | Description |
|---|---|---|---|---|
b1 |
0* | 21171* | 1000 meters | Estimated Population count |
Terms of Use
Terms of Use
Landscan datasets are licensed under the Creative Commons Attribution 4.0 International License. Users are free to use, copy, distribute, transmit, and adapt the work for commercial and non-commercial purposes, without restriction, as long as clear attribution of the source is provided.
Citations
Sims, K., Reith, A., Bright, E., Kaufman, J., Pyle, J., Epting, J., Gonzales, J., Adams, D., Powell, E., Urban, M., & Rose, A. (2023). LandScan Global 2022 [Data set]. Oak Ridge National Laboratory. https://doi.org/10.48690/1529167
DOIs
Explore with Earth Engine
Code Editor (JavaScript)
var landscan_global =
    ee.ImageCollection('projects/sat-io/open-datasets/ORNL/LANDSCAN_GLOBAL');
var popcount_intervals = '<RasterSymbolizer>' +
    ' <ColorMap type="intervals" extended="false" >' +
    '<ColorMapEntry color="#CCCCCC" quantity="0" label="No Data"/>' +
    '<ColorMapEntry color="#FFFFBE" quantity="5" label="Population Count (Estimate)"/>' +
    '<ColorMapEntry color="#FEFF73" quantity="25" label="Population Count (Estimate)"/>' +
    '<ColorMapEntry color="#FEFF2C" quantity="50" label="Population Count (Estimate)"/>' +
    '<ColorMapEntry color="#FFAA27" quantity="100" label="Population Count (Estimate)"/>' +
    '<ColorMapEntry color="#FF6625" quantity="500" label="Population Count (Estimate)"/>' +
    '<ColorMapEntry color="#FF0023" quantity="2500" label="Population Count (Estimate)"/>' +
    '<ColorMapEntry color="#CC001A" quantity="5000" label="Population Count (Estimate)"/>' +
    '<ColorMapEntry color="#730009" quantity="185000" label="Population Count (Estimate)"/>' +
    '</ColorMap>' +
    '</RasterSymbolizer>';

// Define a dictionary which will be used to make legend and visualize image on
// map
var dict = {
  'names': [
    '0', '1-5', '6-25', '26-50', '51-100', '101-500', '501-2500', '2501-5000',
    '5001-185000'
  ],
  'colors': [
    '#CCCCCC', '#FFFFBE', '#FEFF73', '#FEFF2C', '#FFAA27', '#FF6625', '#FF0023',
    '#CC001A', '#730009'
  ]
};

// Create a panel to hold the legend widget
var legend = ui.Panel({style: {position: 'bottom-left', padding: '8px 15px'}});

// Function to generate the legend
function addCategoricalLegend(panel, dict, title) {
  // Create and add the legend title.
  var legendTitle = ui.Label({
    value: title,
    style: {
      fontWeight: 'bold',
      fontSize: '18px',
      margin: '0 0 4px 0',
      padding: '0'
    }
  });
  panel.add(legendTitle);

  var loading = ui.Label('Loading legend...', {margin: '2px 0 4px 0'});
  panel.add(loading);

  // Creates and styles 1 row of the legend.
  var makeRow = function(color, name) {
    // Create the label that is actually the colored box.
    var colorBox = ui.Label({
      style: {
        backgroundColor: color,
        // Use padding to give the box height and width.
        padding: '8px',
        margin: '0 0 4px 0'
      }
    });

    // Create the label filled with the description text.
    var description = ui.Label({value: name, style: {margin: '0 0 4px 6px'}});

    return ui.Panel({
      widgets: [colorBox, description],
      layout: ui.Panel.Layout.Flow('horizontal')
    });
  };

  // Get the list of palette colors and class names from the image.
  var palette = dict['colors'];
  var names = dict['names'];
  loading.style().set('shown', false);

  for (var i = 0; i < names.length; i++) {
    panel.add(makeRow(palette[i], names[i]));
  }

  Map.add(panel);
}

addCategoricalLegend(legend, dict, 'Population Count(estimate)');

Map.addLayer(
    landscan_global.sort('system:time_start')
        .first()
        .sldStyle(popcount_intervals),
    {}, 'Population Count Estimate 2000');
Map.addLayer(
    landscan_global.sort('system:time_start', false)
        .first()
        .sldStyle(popcount_intervals),
    {}, 'Population Count Estimate 2022');