- Catalog Owner
- National Ecological Observatory Network
- Dataset Availability
- 2013-01-01T00:00:00Z–2021-07-18T16:36:45Z
- Dataset Producer
- NEON
- Tags
Description
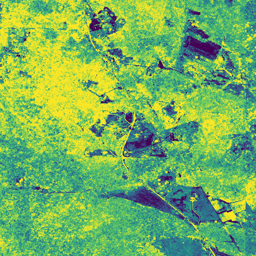
Modelled canopy nitrogen concentration calibrated with NEON plant foliar chemistry observations and predicted with L1 surface directional reflectance, derived from the NEON Imaging Spectrometer (NIS). Bands include 1) canopy nitrogen percent, 2) canopy nitrogen model uncertainty, 3) classification result for needle vs. non-needle model and 4) valid pixel mask based on NDVI threshold.
The canopy nitrogen data product provides an estimate of canopy nitrogen percent per pixel. Modelled results are generated by training a random forest model which leverages directional reflectance spectra as predictor variables and field collected canopy foliar chemistry measurements for model calibration and validation. Both a pine-needle and non-needle nitrogen model are used, due to the significant difference in final model parameters of these distinct plant functional types. Models were trained with samples collected across the history of the NEON observatory, and appropriately filtered for data quality issues. Values were only trained on vegetative samples, therefore models may be inaccurate in other landscape types. Although all pixels are provided, an NDVI threshold mask was derived to isolate pixels with vegetation.
Availability in GEE may not represent full availability in the NEON Data Portal (linked below). Additional sites and years can be added to GEE upon request by emailing listaopgee@battelleecology.org.
See NEON Data Product DP3.30018.002 for more details.
Documentation: Canopy nitrogen - mosaic (DP3.30018.002) Quick Start Guide
Get started by exploring the Intro to AOP Data in Google Earth Engine Tutorial Series
Browse and interact with AOP data in the NEON AOP GEE Data Viewer App
Bands
Bands
Pixel size: 1 meter (all bands)
| Name | Units | Min | Max | Pixel Size | Description |
|---|---|---|---|---|---|
Nitrogen_Percent |
% | 0 | 5 | 1 meter | Canopy Nitrogen Percent |
Nitrogen_Uncertainty |
% | 0 | 5 | 1 meter | Uncertainty associated with the %N predictions; calculated by taking the standard deviation of the %N predictions from each decision tree in the random forest model. |
Needle_Non-needle_Classification |
1 meter | A binary map created using Support Vector Machine (SVM) classification. The non-needle class includes all vegetation types that are not needle leaf, such as broadleaf trees, shrubs, herbaceous cover, and so forth. Separate random forest regression models were developed to predict foliar nitrogen values for needle and non-needle vegetation types. |
|||
Valid_Pixel_Classification |
1 meter | A binary map based on NDVI threshold of 0.2, where pixels with NDVI < 0.2 are set to 0 (invalid). Intended to enable exclusion of non-vegetated areas, such as roads, water bodies, built-up areas, and so forth. |
Needle_Non-needle_Classification Class Table
| Value | Color | Description |
|---|---|---|
| 0 | #ffffff | needle leaf |
| 1 | #a9a9a9 | non-needle leaf |
Valid_Pixel_Classification Class Table
| Value | Color | Description |
|---|---|---|
| 0 | #ffffff | invalid |
| 1 | #a9a9a9 | valid |
Image Properties
Image Properties
| Name | Type | Description |
|---|---|---|
| AOP_VISIT_NUMBER | INT | Unique visit number to the NEON site. |
| CITATION | STRING | Data citation. See NEON Data Policies and Citation Guidelines. |
| DOI | STRING | Digital Object Identifier. NEON data that have been released are assigned a DOI. |
| FLIGHT_YEAR | INT | Year the data were collected. |
| NEON_DOMAIN | STRING | NEON eco-climatic domain code, "D01" to "D20". See NEON Field Sites and Domains. |
| NEON_SITE | STRING | NEON four-digit site code. See NEON Field Sites. |
| NEON_SITE_NAME | STRING | Full name of the NEON site. See NEON Field Sites. |
| NEON_DATA_PROD_URL | STRING | NEON data product url. Always set to: https://data.neonscience.org/data-products/DP3.30018.002. |
| SENSOR_ID | STRING | ID of NEON Imaging Spectrometer (NIS), or Global Airborne Observatory (GAO): "NIS1", "NIS2", "NIS3", "GAO". |
| PROVISIONAL_RELEASED | STRING | Whether the data are Provisional or Released. See https://www.neonscience.org/data-samples/data-management/data-revisions-releases. |
| RELEASE_YEAR | INT | If data are released, the year of the NEON Release Tag. |
Terms of Use
Terms of Use
All data collected by NEON and provided as data products, with the exception of data related to rare, threatened, or endangered (RTE) species, are released to the public domain under Creative Commons CC0 1.0 "No Rights Reserved". No copyright has been applied to NEON data; any person may copy, modify, or distribute the data, for commercial or non-commercial purposes, without asking for permission. NEON data may still be subject to other laws or rights such as for privacy, and NEON makes no warranties about the data and disclaims all liability. When using or citing NEON data, no implication should be made about endorsement by NEON. In most countries, data and facts are not copyrightable. By putting NEON data into the public domain, we encourage broad use, particularly in scientific analyses and data aggregations. However, please be aware of the following scholarly norms: NEON data should be used in a way that is mindful of the limitations of the data, using the documentation associated with the data packages as a guide. Please refer to NEON Data Guidelines and Policies for detailed information on how to properly use and cite NEON data, as well as best practices for publishing research that uses NEON data.
Citations
Explore with Earth Engine
Code Editor (JavaScript)
// Read in the NEON AOP CNC Image Collection
var cnc = ee.ImageCollection(
  'projects/neon-prod-earthengine/assets/CNC/002');

// Display available images in the CNC Image Collection
print('NEON Canopy Nitrogen Images')
print(cnc.aggregate_array('system:index'))

// Filter by specific image index
var cnc_harv2019 = cnc.filter(ee.Filter.eq('system:index', '2019_HARV_6')).first();

// Mask nitrogen band using valid pixel band
var cnc_valid = cnc_harv2019.select('Valid_Pixel_Classification');
var cnc_masked = cnc_harv2019.updateMask(cnc_valid);

// Read in the uncertainty band and mask using valid pixel band
var cnc_unc = cnc_harv2019.select('Nitrogen_Uncertainty');
var cnc_unc_masked = cnc_unc.updateMask(cnc_valid);

// Define the visualization parameters
// The min/max values below use a 2 sigma (~95%) stretch
var visParamsNit = {bands: ['Nitrogen_Percent'], min: 1.6, max: 2.14, palette: ['440154', '3b528b', '21908c', '5dc963', 'fde725']};
var visParamsUnc = {min: 0.4, max: 0.7, palette: ['0d0887', '7e03a8', 'cc4778', 'f89540', 'f0f921']};

// Add the masked nitrogen and uncertainty layers to the map and center on the site
Map.addLayer(cnc_unc_masked, visParamsUnc, 'HARV 2019 Nitrogen Uncertainty (%)');
Map.addLayer(cnc_masked, visParamsNit, 'HARV 2019 Nitrogen (%)');
Map.centerObject(cnc_harv2019, 11);