
- Catalog Owner
- Global Pasture Watch
- Dataset Availability
- 2000-01-01T00:00:00Z–2022-12-31T00:00:00Z
- Dataset Producer
- Land and Carbon Lab Global Pasture Watch
- Contact
- Land & Carbon Lab
- Cadence
- 1 Year
- Tags
Description
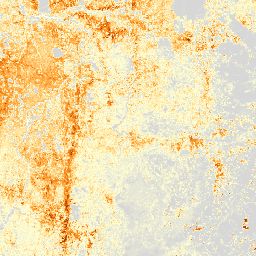
This dataset provides global livestock headcount from 2000 to 2022 at 1-km spatial resolution. Produced by the Land & Carbon Lab’s Global Pasture Watch initiative, the current dataset provides global headcount predictions adjusted to FAOSTAT national statistics. The dataset is based on the largest known compilation of subnational livestock census data (harmonized from 55,336 administrative units across 147 countries) and is modeled via machine learning (Random Forest), using 128 environmental, socioeconomic, and anthropogenic spatial layers (including terrain elevation, MODIS data, aridity index, accessibility metrics, religious population distribution, etc). Modeling areas were restricted to annual layer of potential land for livestock production, derived from Landsat-based cropland and grassland extents from 2000 to 2022.
The dataset is designed to support environmental and agricultural applications (refining GHG emission estimates, modeling nutrient cycles, estimating soil carbon sequestration rates, informing national livestock policies, etc). The final predictions were adjusted using a linear country-by-country scaling approach so that aggregated national totals match the statistics provided by FAOSTAT. This adjustment constrains national totals to FAOSTAT but does not validate where within a country livestock are placed; the subnational allocation is modeled and should be treated as such. For subnational applications requiring high precision, users are encouraged to apply local calibration factors from national agencies rather than relying entirely on the FAOSTAT-adjusted estimates.
Estimates of 95% probability prediction interval values (lower and upper boundaries around mean predictions; 2.5th & 97.5th percentiles) and raw densities and headcount predictions are available in Zenodo:
- Annual cattle densities
- Annual goat densities
- Annual sheep densities
- Annual horse densities
- Annual buffalo densities
The dataset is also available in OpenLandMap STAC.
Limitations:
Modeled 1 km allocation, not observed livestock locations: The pixels represent a statistical redistribution of coarse subnational census counts across annual layer of potential land for livestock production; they do not mark observed herds or farms. Model accuracy was evaluated on held-out census polygons using polygon-mean covariates. As the mean census unit is ~2,900 km² (SD ~21,500), these metrics describe agreement at the administrative-unit level and do not characterize the accuracy of the 1 km detail. Treat the fine-scale pattern as a plausible disaggregation, not an independently validated 1 km estimate.
FAOSTAT consistency is not local accuracy: The country-by-country rescaling guarantees that national totals match FAOSTAT by construction; it does not constrain or validate where within a country animals are placed. National totals can therefore be correct while subnational allocation remains uncertain.
Discontinuities at national borders: Because headcounts are rescaled to FAOSTAT national totals separately for each country, abrupt changes can appear across international boundaries — for example between Mongolia and its neighbours, where reported national totals differ strongly. These are artifacts of the adjustment, not real density gradients.
Irregular and incomplete census data: Livestock census data are often irregular, incomplete, and can be overestimated due to double counting caused by animal mobility across census boundaries or changes in farm ownership. Furthermore, spatial availability varies widely; many developing countries only provide data at coarse administrative scales (state/county level), which may lead to systematic underestimation of undocumented livestock.
Mismatched input scales and unrealistic densities: Livestock densities are derived by combining administrative headcount estimates with the annual layer of potential land for livestock production. In regions dominated by landless livestock systems or feedlots, the high number of livestock may not match the mapped potential land, resulting in unrealistically high density values (locally exceeding 2,500 cattle heads km⁻²).
Uniform allocation across livestock species: The intermediate layer representing potential land for livestock production is applied uniformly as an input for all modeled livestock species. The current model does not account for the complexities of different livestock management systems (dairy vs. cow-calf vs. finishing systems) or distinct species-specific behaviors, such as goats acting primarily as browsers.
Underestimation of high-density areas and unreliable prediction intervals: The selected machine learning models struggle to predict areas with very high livestock density, likely underestimating intense livestock hotspots. The prediction intervals are much narrower than their nominal 95% level implies and understate the true uncertainty. Although labeled as 95% intervals, Prediction Interval Coverage Probability (PICP) was found to be 30-45%, meaning that held-out census-polygon observations fell inside the prediction intervals only about 30-45% of the time. These intervals should not be used as probabilistic bounds for risk thresholds, exceedance probabilities, or downstream error propagation without independent recalibration.
Temporal coverage vs. validated dynamics: The layers span 2000–2022 annually, but there is no temporal hold-out validation. Much of the inter-annual signal derives from FAOSTAT national totals and the annually varying land-cover inputs, while the per-pixel density model relies substantially on static and long-term covariates; some socioeconomic inputs are held constant and carried forward (e.g., HDI to 2015, nighttime lights to ~2020). Interpret short-term (year-to-year) change cautiously.
Interrupted Goode Homolosine projection caveats: To ensure precise spatial alignment and minimize distortions, all modeling was conducted in an equal-area coordinate system, specifically the Interrupted Goode Homolosine projection (used for all layers in Zenodo). Prior to GEE ingestion, the dataset was converted to the EPSG:4326 coordinate system. Because the original headcount data represents absolute values per 1 km², a spatial redistribution approach was used to correct for projection-induced distortions (see Github). This adjustment preserves total national values for consistency with FAOSTAT statistics, though it may slightly shift the local allocation of headcounts within country borders.
For more information see Parente et. al, 2026, Zenodo and Global Pasture Watch GitHub site
Bands
Bands
Pixel size: 1000 meters (all bands)
| Name | Min | Max | Pixel Size | Description |
|---|---|---|---|---|
cattle |
0* | 160* | 1000 meters | Cattle headcount considering available land for livestock production per km² |
buffalo |
0* | 160* | 1000 meters | Buffalo headcount considering available land for livestock production per km² |
horse |
0* | 10* | 1000 meters | Horse headcount considering available land for livestock production per km² |
goat |
0* | 160* | 1000 meters | Goat headcount considering available land for livestock production per km² |
sheep |
0* | 160* | 1000 meters | Sheep headcount considering available land for livestock production per km² |
Image Properties
Image Properties
| Name | Type | Description |
|---|---|---|
| version | INT | Product version |
Terms of Use
Terms of Use
Citations
Parente, L., Ehrmann, S., Hengl, T., Fritz, S., Bonannella, C., et al. (2026). Global Pasture Watch - Annual livestock headcount layers for livestock, goats, sheep, horses, and buffaloes at 1-km 2000–2022 (FAOSTAT-adjusted) (Version v1) [Data set]. Zenodo. doi:https://doi.org/10.5281/zenodo.20396303
Parente, L., Ehrmann, S., Hengl, T., Fritz, S., Bonannella, C., et al. (2026). Global distribution of livestock, horses, goats, sheep and buffaloes at 1 km resolution for 2000–2022 based on subnational census data and spatiotemporal machine learning. PeerJ. doi: 10.7717/peerj.21494
DOIs
Explore with Earth Engine
Code Editor (JavaScript)
Map.setCenter(0, 0, 3);

var sld160 =
'<RasterSymbolizer>' +
'  <ColorMap type="ramp">' +
'    <ColorMapEntry color="#a9a9a9" quantity="0" label="0"/>' +
'    <ColorMapEntry color="#ffffd4" quantity="1" label="1"/>' +
'    <ColorMapEntry color="#ffe5a3" quantity="12" label="12"/>' +
'    <ColorMapEntry color="#fec168" quantity="24" label="24"/>' +
'    <ColorMapEntry color="#fe9828" quantity="48" label="48"/>' +
'    <ColorMapEntry color="#f1851f" quantity="64" label="64"/>' +
'    <ColorMapEntry color="#e57116" quantity="72" label="72"/>' +
'    <ColorMapEntry color="#d95f0d" quantity="84" label="84"/>' +
'    <ColorMapEntry color="#ce570c" quantity="96" label="96"/>' +
'    <ColorMapEntry color="#c4500a" quantity="112" label="112"/>' +
'    <ColorMapEntry color="#b94909" quantity="124" label="124"/>' +
'    <ColorMapEntry color="#ae4207" quantity="136" label="136"/>' +
'    <ColorMapEntry color="#a43b05" quantity="148" label="148"/>' +
'    <ColorMapEntry color="#993404" quantity="160" label="160"/>' +
'  </ColorMap>' +
'</RasterSymbolizer>'

var sld10 =
'<RasterSymbolizer>' +
'  <ColorMap type="ramp">' +
'    <ColorMapEntry color="#a9a9a9" quantity="0" label="0"/>' +
'    <ColorMapEntry color="#ffffd4" quantity="1" label="1"/>' +
'    <ColorMapEntry color="#ffefb5" quantity="2" label="2"/>' +
'    <ColorMapEntry color="#ffde96" quantity="3" label="2"/>' +
'    <ColorMapEntry color="#fec46c" quantity="4" label="4"/>' +
'    <ColorMapEntry color="#fea73f" quantity="5" label="5"/>' +
'    <ColorMapEntry color="#f68c23" quantity="6" label="6"/>' +
'    <ColorMapEntry color="#e67217" quantity="7" label="7"/>' +
'    <ColorMapEntry color="#d25a0c" quantity="8" label="8"/>' +
'    <ColorMapEntry color="#b64708" quantity="9" label="9"/>' +
'    <ColorMapEntry color="#993404" quantity="10" label="10"/>' +
'  </ColorMap>' +
'</RasterSymbolizer>'

var gld = ee.ImageCollection(
  "projects/global-pasture-watch/assets/gld-1km/v1/livestock-headcount-faostat_m"
)

var gld_2000 = gld.filterDate('2000-01-01', '2001-01-01').first();
var gld_2022 = gld.filterDate('2022-01-01', '2023-01-01').first();

Map.addLayer(gld_2000.select('buffalo').sldStyle(sld160), {}, 'Buffalo headcount (2000)', false);
Map.addLayer(gld_2022.select('buffalo').sldStyle(sld160), {}, 'Buffalo headcount (2022)');

Map.addLayer(gld_2000.select('horse').sldStyle(sld10), {}, 'Horse headcount (2000)', false);
Map.addLayer(gld_2022.select('horse').sldStyle(sld10), {}, 'Horse headcount (2022)');

Map.addLayer(gld_2000.select('goat').sldStyle(sld160), {}, 'Goat headcount (2000)', false);
Map.addLayer(gld_2022.select('goat').sldStyle(sld160), {}, 'Goat headcount (2022)');

Map.addLayer(gld_2000.select('sheep').sldStyle(sld160), {}, 'Sheep headcount (2000)', false);
Map.addLayer(gld_2022.select('sheep').sldStyle(sld160), {}, 'Sheep headcount (2022)');

Map.addLayer(gld_2000.select('cattle').sldStyle(sld160), {}, 'Cattle headcount (2000)', false);
Map.addLayer(gld_2022.select('cattle').sldStyle(sld160), {}, 'Cattle headcount (2022)');