Page Summary
-
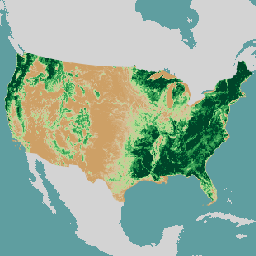
This dataset contains modeled Tree Canopy Cover (TCC), standard error (SE), and National Land Cover Database's (NLCD) TCC data for each year from 2008 to 2021.
-
The data was produced by the USDA Forest Service (USFS) and is part of the National Land Cover Database (NLCD) project managed by the USGS.
-
The product aims to provide a consistent and "best available" map of TCC across the Conterminous United States (CONUS) and other selected areas (OCONUS).
-
The dataset includes both raw Science TCC outputs with standard error and a post-processed NLCD TCC product.
- Dataset Availability
- 2008-06-01T00:00:00Z–2021-09-30T00:00:00Z
- Dataset Producer
- USDA Forest Service (USFS) Geospatial Technology and Applications Center (GTAC)
- Tags
Description
This product is part of the Tree Canopy Cover (TCC) data suite. It includes modeled TCC, standard error (SE), and National Land Cover Database's (NLCD) TCC data for each year. TCC data produced by the the United States Department of Agriculture, Forest Service (USFS) are included in the Multi-Resolution Land Characteristics (MRLC) consortium that is part of the National Land Cover Database (NLCD) project managed by the United States (US) Geological Survey (USGS).
The Science TCC product and NLCD TCC are remote sensing-based map output produced by the USFS. The objecive of TCC Science and NLCD TCC are to develop a consistent approach using the latest technology and advancements in TCC mapping to produce a "best available" map of TCC across the Conterminous United States (CONUS) and southeast Alaska, Hawaii and Puerto Rico-US Virgin Islands (OCONUS).
Model outputs include Science TCC, Science SE and NLCD TCC. Science TCC and SE include data from 2008 through 2021. NLCD TCC include data from 2011 through 2021, with data fully masked in 2008, 2009 and 2010.
*Science TCC is the raw direct model outputs.
*Science SE is the model standard deviation of the predicted values from all regression trees. *The NLCD TCC product undergoes further post processing applied to the annual Science TCC images, which includes several masking (water and non-tree agriculture), filtering, and minimum-mapping unit (MMU) routines, as well as processes that reduce interannual noise and return longer duration trends.
Each image includes a data mask band that has three values representing areas of no data (0), mapped tree canopy cover(1), and non-processing area (2). The non-processing areas are pixels in the study area with no cloud or cloud shadow-free data. No data and non-processing area pixels are masked in TCC and SE images.
Due to CONUS size and wide variety of ecotones, CONUS modeling was broken up into 54 480x480 km tiles. For each tile, a unique random forest model was built using 2011 fitted LandTrendr, 2011 CDL, and terrain data. All reference data that were part of the 70% available for model calibration that intersected tiles within a 5x5 window around the center tile were used to train the random forest model. That model was then applied to the center tile. For OCONUS, one model was applied to each study area, and no tiles were used.
Predictor layers for the TCC model include outputs from the LandTrendr and terrain information. These components are all accessed and processed using Google Earth Engine (Gorelick et al., 2017).
To produce annual composites for LandTrendr, USGS Collection 2 Landsat Tier 1 and Sentinel 2A, 2B Level-1C top of atmosphere reflectance data were used. The cFmask cloud masking algorithm (Foga et al., 2017), which is an implementation of Fmask 2.0 (Zhu and Woodcock, 2012) (Landsat-only), cloudScore (Chastain et al., 2019) (Landsat-only), and s2cloudless (Sentinel-Hub, 2021) (Sentinel 2-only) are used to mask clouds, while TDOM (Chastain et al., 2019) is used to mask cloud shadows (Landsat and Sentinel 2). For LandTrendr, the annual medoid is then computed to summarize cloud and cloud shadow-free values from each year into a single composite.
The composite time series is temporally segmented using LandTrendr (Kennedy et al., 2010; Kennedy et al., 2018; Cohen et al., 2018).
The raw composite values, LandTrendr fitted values, pair-wise differences, segment duration, change magnitude, and slope, along with elevation, slope, sine of aspect, and cosine of aspect from the 10 m USGS 3D. Elevation Program (3DEP) data (U.S. Geological Survey, 2019), are used as independent predictor variables in a Random Forest (Breiman, 2001) model.
Reference data are collected from USFS Forest Inventory and Analysis (FIA) photo-interpreted TCC data, and used to make wall-to wall TCC predictions on a pixel-wise basis.
Additional Resources
Please see the TCC Methods Brief for more detailed information regarding methods and accuracy assessment, or the TCC Geodata Clearinghouse for data downloads, metadata, and support documents.
Contact sm.fs.tcc@usda.gov with any questions or specific data requests.
Breiman, L., 2001. Random Forests. In Machine Learning. Springer, 45: 5-32 doi:10.1023/A:1010933404324
Chastain, R., Housman, I., Goldstein, J., Finco, M., and Tenneson, K., 2019. Empirical cross sensor comparison of Sentinel-2A and 2B MSI, Landsat-8 OLI, and Landsat-7 ETM top of atmosphere spectral characteristics over the conterminous United States. In Remote Sensing of Environment. Science Direct, 221: 274-285 doi:10.1016/j.rse.2018.11.012
Cohen, W. B., Yang, Z., Healey, S. P., Kennedy, R. E., and Gorelick, N., 2018. A LandTrendr multispectral ensemble for forest disturbance detection. In Remote Sensing of Environment. Science Direct, 205: 131-140 doi:10.1016/j.rse.2017.11.015
Foga, S., Scaramuzza, P.L., Guo, S., Zhu, Z., Dilley, R.D., Beckmann, T., Schmidt, G.L., Dwyer, J.L., Hughes, M.J., Laue, B., 2017. Cloud detection algorithm comparison and validation for operational Landsat data products. In Remote Sensing of Environment. Science Direct, 194: 379-390 doi:10.1016/j.rse.2017.03.026
U.S. Geological Survey, 2019. USGS 3D Elevation Program Digital Elevation Model, accessed August 2022 at https://developers.google.com/earth-engine/datasets/catalog/USGS_3DEP_10m
Kennedy, R. E., Yang, Z., and Cohen, W. B., 2010. Detecting trends in forest disturbance and recovery using yearly Landsat time series: 1. LandTrendr - Temporal segmentation algorithms. In Remote Sensing of Environment. Science Direct, 114(12): 2897-2910 doi:10.1016/j.rse.2010.07.008
Kennedy, R., Yang, Z., Gorelick, N., Braaten, J., Cavalcante, L., Cohen, W., and Healey, S., 2018. Implementation of the LandTrendr Algorithm on Google Earth Engine. In Remote Sensing. MDPI, 10(5): 691 doi:10.3390/rs10050691
Sentinel-Hub, 2021. Sentinel 2 Cloud Detector. [Online]. Available at: https://github.com/sentinel-hub/sentinel2-cloud-detector
Zhu, Z., and Woodcock, C. E., 2012.. Object-based cloud and cloud shadow detection in Landsat imagery. In Remote Sensing of Environment. Science Direct, 118: 83-94 doi:10.1016/j.rse.2011.10.028
Bands
Bands
Pixel size: 30 meters (all bands)
| Name | Units | Pixel Size | Description | ||||||||||||||||||||||||||||||||||||||||||||||||||||||||||||||||||||||||||||||||||||||||||||||||
|---|---|---|---|---|---|---|---|---|---|---|---|---|---|---|---|---|---|---|---|---|---|---|---|---|---|---|---|---|---|---|---|---|---|---|---|---|---|---|---|---|---|---|---|---|---|---|---|---|---|---|---|---|---|---|---|---|---|---|---|---|---|---|---|---|---|---|---|---|---|---|---|---|---|---|---|---|---|---|---|---|---|---|---|---|---|---|---|---|---|---|---|---|---|---|---|---|---|---|---|
Science_Percent_Tree_Canopy_Cover |
% | 30 meters | The raw direct model outputs. Each pixel has a mean predicted tree canopy cover value for each year. |
||||||||||||||||||||||||||||||||||||||||||||||||||||||||||||||||||||||||||||||||||||||||||||||||
Science_Percent_Tree_Canopy_Cover_Standard_Error |
% | 30 meters | The standard deviation of the predicted values from all regression trees we refer to as standard error. Each pixel has a standard error for each year. |
||||||||||||||||||||||||||||||||||||||||||||||||||||||||||||||||||||||||||||||||||||||||||||||||
NLCD_Percent_Tree_Canopy_Cover |
% | 30 meters | To produce NLCD tree canopy cover, a post-processing workflow is applied to the direct model output that identifies and sets non-treed pixel values to zero percent tree canopy cover. NLCD tree canopy cover data are fully masked in 2008, 2009 and 2010. |
||||||||||||||||||||||||||||||||||||||||||||||||||||||||||||||||||||||||||||||||||||||||||||||||
data_mask |
30 meters | Three values representing areas of no data, mapped tree canopy cover, and non-processing area. The non-processing area is where pixels within the study area have no cloud or cloud shadow-free data available to produce an output. |
|||||||||||||||||||||||||||||||||||||||||||||||||||||||||||||||||||||||||||||||||||||||||||||||||
Image Properties
Image Properties
| Name | Type | Description |
|---|---|---|
| study_area | STRING | TCC currently covers CONUS, Southeastern Alaska, Puerto Rico-US Virgin Islands and Hawaii. This version contains all study areas. Possible values: 'CONUS, SEAK, PRUSVI, HI' |
| version | STRING | This is the fourth version of the TCC product released in the MRLC consortium that is part of the National Land Cover Database (NLCD)' |
| startYear | INT | 'Start year of the product' |
| endYear | INT | 'End year of the product' |
| year | INT | 'Year of the product' |
Terms of Use
Terms of Use
The USDA Forest Service makes no warranty, expressed or implied, including the warranties of merchantability and fitness for a particular purpose, nor assumes any legal liability or responsibility for the accuracy, reliability, completeness or utility of these geospatial data, or for the improper or incorrect use of these geospatial data. These geospatial data and related maps or graphics are not legal documents and are not intended to be used as such. The data and maps may not be used to determine title, ownership, legal descriptions or boundaries, legal jurisdiction, or restrictions that may be in place on either public or private land. Natural hazards may or may not be depicted on the data and maps, and land users should exercise due caution. The data are dynamic and may change over time. The user is responsible to verify the limitations of the geospatial data and to use the data accordingly.
These data were collected using funding from the U.S. Government and can be used without additional permissions or fees. If you use these data in a publication, presentation, or other research product please use the following citation:
USDA Forest Service. 2023. USFS Tree Canopy Cover v2021.4 (Conterminous United States and Southeastern Alaska). Salt Lake City, Utah.
Citations
USDA Forest Service. 2023. USFS Tree Canopy Cover v2021.4 (Conterminous United States and Southeastern Alaska). Salt Lake City, Utah.
Explore with Earth Engine
Code Editor (JavaScript)
// Import the tree canopy cover collection
var dataset = ee.ImageCollection('USGS/NLCD_RELEASES/2021_REL/TCC/v2021-4');

//Filter collection to 2021 and CONUS study area
var tcc = dataset.filter(ee.Filter.calendarRange(2021, 2021,'year'))  // range: [2008, 2021]
               .filter('study_area == "CONUS"')  // or "AK", "PRUSVI", "HAWAII"
               .first();

// TCC palette
var tcc_palette = [
    'CDA066',
    'D7C29E',
    'C2D096',
    'B7D692',
    'ADDD8E',
    '78C679',
    '5CB86B',
    '41AB5D',
    '39A156',
    '329750',
    '238443',
    '11763D',
    '006837',
    '004529'
  ]

// SE palette
var se_palette = [
    '000000',
    'FFFFFF',
    ]


// Display images on map
Map.addLayer(tcc.select('data_mask'), {min:0,max:2}, 'Data Mask',false);
Map.addLayer(tcc.select('Science_Percent_Tree_Canopy_Cover'), {min:0,max:60,palette:tcc_palette}, 'Science Percent Tree Canopy Cover');
Map.addLayer(tcc.select('Science_Percent_Tree_Canopy_Cover_Standard_Error'), {min:0,max:4000,palette:se_palette}, 'Science Percent Tree Canopy Cover Standard Error');
Map.addLayer(tcc.select('NLCD_Percent_Tree_Canopy_Cover'), {min:0,max:60,palette:tcc_palette}, 'NLCD Percent Tree Canopy Cover');

Map.setCenter(-98.58, 38.14, 4);