Page Summary
-
The Large Scale International Boundary (LSIB) dataset is provided by the United States Office of the Geographer and reflects U.S. government policies on boundaries.
-
The dataset is derived from a LSIB line vector file and the World Vector Shorelines (WVS) from the National Geospatial-Intelligence Agency (NGA).
-
Each feature in the dataset represents a polygonal area defined by interior boundaries and exterior coastlines, with many countries consisting of multiple features.
-
The dataset contains 180,741 features, each being part of the geometry of one of the 284 countries described.
-
The data is in the US public domain with no restrictions on its use.
- Dataset Availability
- 2017-12-29T00:00:00Z–2017-12-29T00:00:00Z
- Dataset Producer
- United States Department of State, Office of the Geographer
- Tags
Description
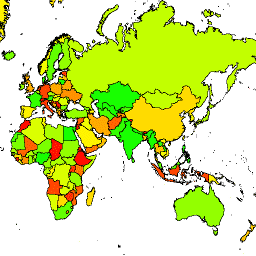
The United States Office of the Geographer provides the Large Scale International Boundary (LSIB) dataset. It is derived from two other datasets: a LSIB line vector file and the World Vector Shorelines (WVS) from the National Geospatial-Intelligence Agency (NGA). The interior boundaries reflect U.S. government policies on boundaries, boundary disputes, and sovereignty. The exterior boundaries are derived from the WVS; however, the WVS coastline data is outdated and generally shifted from between several hundred meters to over a kilometer. Each feature is the polygonal area enclosed by interior boundaries and exterior coastlines where applicable, and many countries consist of multiple features, one per disjoint region. Each of the 180,741 features is a part of the geometry of one of the 284 countries described in this dataset.
Table Schema
Table Schema
| Name | Type | Description |
|---|---|---|
| OBJECTID | STRING | Object ID |
| COUNTRY_NA | STRING | US-recognized country name |
Terms of Use
Terms of Use
There are no restrictions on use of this US public domain data.
Explore with Earth Engine
Code Editor (JavaScript)
var dataset = ee.FeatureCollection('USDOS/LSIB/2017');
var styleParams = {
  fillColor: 'b5ffb4',
  color: '00909F',
  width: 3,
};
var countries = dataset.style(styleParams);
Map.setCenter(16.35, 48.83, 4);
Map.addLayer(countries, {}, 'USDOS/LSIB/2017', true, 0.8);
Visualize as a FeatureView
A FeatureView is a view-only, accelerated representation of a
FeatureCollection. For more details, visit the
FeatureView documentation.
Code Editor (JavaScript)
var fvLayer = ui.Map.FeatureViewLayer('USDOS/LSIB/2017_FeatureView');

var visParams = {
  color: '00909F',
  fillColor: 'b5ffb4',
  width: 3,
  opacity: 1
};

fvLayer.setVisParams(visParams);
fvLayer.setName('USDOS/LSIB/2017');

Map.setCenter(16.35, 48.83, 4);
Map.add(fvLayer);