- ความพร้อมใช้งานของชุดข้อมูล
- 1998-01-01T00:00:00Z–2019-12-01T00:00:00Z
- ผู้ผลิตชุดข้อมูล
- NASA GES DISC ที่ศูนย์การบินอวกาศ Goddard ของ NASA
- ความถี่การบันทึก
- 1 เดือน
- แท็ก
คำอธิบาย
คอลเล็กชันนี้จะไม่มีการอัปเดตอีกต่อไป ดู รายเดือนของ IMERG
อัลกอริทึมชุดข้อมูลนี้ผสานข้อมูลไมโครเวฟจากดาวเทียมหลายดวง ซึ่งรวมถึง SSMI, SSMIS, MHS, AMSU-B และ AMSR-E โดยแต่ละดวงจะได้รับการปรับเทียบร่วมกับเครื่องมือรวมของ TRMM
อัลกอริทึม 3B43 จะทำงานเดือนละครั้งเพื่อสร้างฟิลด์อัตราการตกของหยาดน้ำฟ้าแบบค่าประมาณเดียวที่ดีที่สุดและฟิลด์ค่าประมาณข้อผิดพลาดของหยาดน้ำฟ้า RMS (3B43) โดยการรวมค่าประมาณ IR/คุณภาพสูงที่ผสานรวมทุก 3 ชั่วโมง (3B42) เข้ากับการวิเคราะห์มาตรวัดน้ำฝนของ Global Precipitation Climatology Centre (GPCC) ที่สะสมรายเดือน
ชุดข้อมูลปริมาณน้ำฝนทั่วโลกทั้งหมดมีแหล่งข้อมูลการปรับเทียบ ซึ่งจำเป็นต่อการควบคุมความแตกต่างของอคติระหว่างดาวเทียมที่ให้ข้อมูล ข้อมูลจากดาวเทียมหลายดวงจะนำมาหาค่าเฉลี่ยในระดับรายเดือนและ รวมกับการวิเคราะห์เกจวัดปริมาณน้ำฝนบนพื้นผิวรายเดือนของ Global Precipitation Climatology Centre (GPCC) ในแต่ละกรณี ระบบจะปรับข้อมูลจากดาวเทียมหลายดวง ให้เป็นค่าเฉลี่ยในพื้นที่ขนาดใหญ่ของการวิเคราะห์เกจวัดเมื่อมีข้อมูล (ส่วนใหญ่อยู่เหนือพื้นดิน) จากนั้นจะรวมเข้ากับการวิเคราะห์เกจวัดโดยใช้ การถ่วงน้ำหนักความแปรปรวนของข้อผิดพลาดแบบสุ่มที่ประมาณค่าผกผันอย่างง่าย ภูมิภาคที่มีความครอบคลุมของสถานีตรวจวัดไม่ดี เช่น แอฟริกากลางและมหาสมุทร จะมีน้ำหนักที่สูงกว่า ในข้อมูลจากดาวเทียม
ดูรายละเอียดได้ที่คำอธิบายอัลกอริทึม และข้อกำหนดของไฟล์
ย่านความถี่
ย่านความถี่
ขนาดพิกเซล: 27830 เมตร (ทุกแถบ)
| ชื่อ | หน่วย | ต่ำสุด | สูงสุด | ขนาดพิกเซล | คำอธิบาย |
|---|---|---|---|---|---|
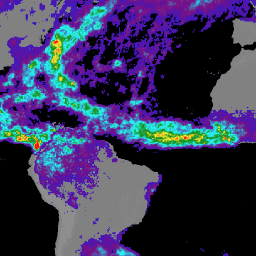
precipitation |
มม./ชม. | 0* | 6.73* | 27830 เมตร | ค่าประมาณหยาดน้ำฟ้าจากไมโครเวฟ/IR ที่ผสานแล้ว |
relativeError |
มม./ชม. | 0.001* | 16.36* | 27830 เมตร | ค่าประมาณข้อผิดพลาดแบบสุ่มของปริมาณหยาดน้ำฟ้าจากไมโครเวฟ/IR ที่ผสานรวม |
gaugeRelativeWeighting |
% | 0* | 100* | 27830 เมตร | การให้น้ำหนักสัมพัทธ์ของมาตรวัดน้ำฝนที่ใช้ในการปรับเทียบ |
ข้อกำหนดในการใช้งาน
ข้อกำหนดในการใช้งาน
ชุดข้อมูลนี้เป็นสาธารณสมบัติและพร้อมให้ใช้งาน โดยไม่มีข้อจำกัดในการใช้งานและการเผยแพร่ ดูข้อมูลเพิ่มเติมได้ที่นโยบายข้อมูลและสารสนเทศด้านวิทยาศาสตร์โลกของ NASA
การอ้างอิง
Adler, R.F., G.J. Huffman, A. Chang, R. Ferraro, P. Xie, J. Janowiak, B. Rudolf, U. Schneider, S. Curtis, D. Bolvin, A. Gruber, J. Susskind, P. Arkin, E.J. Nelkin, 2003: The Version 2 Global Precipitation Climatology Project (GPCP) Monthly Precipitation Analysis (1979-Present) J. Hydrometeor., 4(6), 1147-1167.
Huffman, G.J., 1997: ค่าประมาณของข้อผิดพลาดแบบสุ่มของสแควรูทของความคลาดเคลื่อนกำลังสองเฉลี่ย สำหรับตัวอย่างแบบจำกัดของปริมาณน้ำฝนโดยประมาณ, J. Appl. Meteor., 1191-1201
Huffman, G.J., 2012: เอกสารพื้นฐานทางทฤษฎีของอัลกอริทึม (ATBD) เวอร์ชัน 3.0 สำหรับการวัดปริมาณน้ำฝนทั่วโลก (GPM) ของ NASA การดึงข้อมูลแบบหลายดาวเทียมที่ผสานรวมสำหรับ GPM (I-MERG) GPM Project, Greenbelt, MD, 29 pp.
Huffman, G.J., R.F. Adler, P. Arkin, A. Chang, R. Ferraro, A. Gruber, J. Janowiak, A. McNab, B. Rudolph และ U. Schneider, 1997: The Global Precipitation Climatology Project (GPCP) Combined Precipitation Dataset, Bul. Amer. Meteor. Soc., 78, 5-20
Huffman, G.J., R.F. Adler, D.T. Bolvin, G. Gu, E.J. Nelkin, K.P. Bowman, Y. Hong, E.F. Stocker, D.B. Wolff, 2007: The TRMM Multi-satellite Precipitation Analysis: Quasi-Global, Multi-Year, Combined-Sensor Precipitation Estimates at Fine Scale. J. Hydrometeor., 8(1), 38-55.
Huffman, G.J., R.F. Adler, M. Morrissey, D.T. Bolvin, S. Curtis, R. Joyce, B McGavock, J. Susskind, 2001: Global Precipitation at One-Degree Daily Resolution from Multi-Satellite Observations J. Hydrometeor., 2(1), 36-50.
Huffman, G.J., R.F. Adler, B. Rudolph, U. Schneider และ P. Keehn, 1995: Global Precipitation Estimates Based on a Technique for Combining Satellite-Based Estimates, Rain Gauge Analysis, and NWP Model Precipitation Information, J. Clim., 8, 1284-1295.
สำรวจด้วย Earth Engine
ตัวแก้ไขโค้ด (JavaScript)
var dataset = ee.ImageCollection('TRMM/3B43V7')
                  .filter(ee.Filter.date('2018-04-01', '2018-05-01'));
var precipitation = dataset.select('precipitation');
var precipitationVis = {
  min: 0.1,
  max: 1.2,
  palette: ['blue', 'purple', 'cyan', 'green', 'yellow', 'red'],
};
Map.setCenter(6.746, 46.529, 3);
Map.addLayer(precipitation, precipitationVis, 'Precipitation');