Page Summary
-
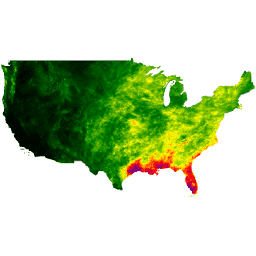
This dataset, covering 1981-2010, provides gridded climate data for the contiguous United States from the PRISM Climate Group at Oregon State University.
-
The dataset includes bands for average monthly precipitation, mean temperature, minimum temperature, maximum temperature, mean dew point temperature, minimum vapor pressure deficit, and maximum vapor pressure deficit.
-
The data is produced using the PRISM model, which accounts for elevation, coastal effects, temperature inversions, and terrain barriers.
-
This dataset has been superseded by OREGONSTATE/PRISM/Norm91m.
-
The dataset is available without restriction, but users should provide attribution to PRISM.
- Dataset Availability
- 1981-01-01T00:00:00Z–2010-12-31T00:00:00Z
- Dataset Producer
- PRISM / OREGONSTATE
- Climatological Interval
- 1 Month
- Tags
Description
The PRISM daily and monthly datasets are gridded climate datasets for the conterminous United States, produced by the PRISM Climate Group at Oregon State University.
Grids are developed using PRISM (Parameter-elevation Regressions on Independent Slopes Model). PRISM interpolation routines simulate how weather and climate vary with elevation, and account for coastal effects, temperature inversions, and terrain barriers that can cause rain shadows. Station data are assimilated from many networks across the country. For more information, see the Descriptions of PRISM Spatial Climate Datasets.
Bands
Bands
Pixel size: 4638.3 meters (all bands)
| Name | Units | Min | Max | Pixel Size | Description |
|---|---|---|---|---|---|
ppt |
mm | 0.03* | 1046.09* | 4638.3 meters | 30 Year average of monthly total precipitation (including rain and melted snow) |
tmean |
°C | -16.15* | 37.88* | 4638.3 meters | 30 Year average of monthly mean temperature (calculated as (tmin+tmax)/2) |
tmin |
°C | -21.9* | 29.79* | 4638.3 meters | 30 Year average of monthly minimum temperature |
tmax |
°C | -10.78* | 46.63* | 4638.3 meters | 30 Year average of monthly maximum temperature |
tdmean |
°C | -19.07* | 25.22* | 4638.3 meters | 30 Year average of monthly mean dew point temperature |
vpdmin |
hPa | 0* | 33.11* | 4638.3 meters | 30 Year average of monthly minimum vapor pressure deficit |
vpdmax |
hPa | 0.37* | 94.11* | 4638.3 meters | 30 Year average of monthly maximum vapor pressure deficit |
Image Properties
Image Properties
| Name | Type | Description |
|---|---|---|
| PRISM_CREATION_DATE | STRING_LIST | List of original creation dates for each band, e.g: the first element is for the first band "ppt", the second element is for the second band "tmean" |
| PRISM_DATASET | STRING_LIST | List of dataset types per-band |
| PRISM_VERSION | STRING_LIST | List of code versions per-band |
| PRISM_FILENAME | STRING_LIST | List of original filenames per-band |
Terms of Use
Terms of Use
These PRISM datasets are available without restriction on use or distribution. PRISM Climate Group does request that the user give proper attribution and identify PRISM, where applicable, as the source of the data. https://prism.oregonstate.edu/terms/
Citations
Daly, C., Halbleib, M., Smith, J.I., Gibson, W.P., Doggett, M.K., Taylor, G.H., Curtis, J., and Pasteris, P.A. 2008. Physiographically-sensitive mapping of temperature and precipitation across the conterminous United States. International Journal of Climatology, 28: 2031-2064 doi:10.1002/joc.1688 pdf
[Daly, C., J.I. Smith, and K.V. Olson. 2015. Mapping atmospheric moisture climatologies across the conterminous United States. PloS ONE 10(10):e0141140. doi:10.1371/journal.pone.0141140.
DOIs
Explore with Earth Engine
Code Editor (JavaScript)
var dataset = ee.ImageCollection('OREGONSTATE/PRISM/Norm81m');
var precipitation = dataset.select('ppt');
var precipitationVis = {
  min: 0.0,
  max: 300.0,
  palette: ['red', 'yellow', 'green', 'cyan', 'purple'],
};
Map.setCenter(-100.55, 40.71, 0);
Map.addLayer(precipitation, precipitationVis, 'Precipitation');