Page Summary
-
The NASA GLDAS-2.0 dataset provides a temporally consistent series of land surface data from 1948 through 2014, forced entirely with Princeton meteorological input.
-
This dataset is a component of the larger GLDAS Version 2, which also includes GLDAS-2.1 and GLDAS-2.2, with varying forcing data and data assimilation schemes.
-
Key variables available in the dataset include surface and soil temperatures, soil moisture, various radiation fluxes, and precipitation rates, among others.
-
Data from the GES DISC archive, including this dataset, are available free to the user community as funded by NASA's Science Mission Directorate.
- Dataset Availability
- 1948-01-01T03:00:00Z–2014-12-31T21:00:00Z
- Dataset Producer
- NASA GES DISC at NASA Goddard Space Flight Center
- Cadence
- 3 Hours
- Tags
Description
NASA Global Land Data Assimilation System Version 2 (GLDAS-2) has three components: GLDAS-2.0, GLDAS-2.1, and GLDAS-2.2. GLDAS-2.0 is forced entirely with the Princeton meteorological forcing input data and provides a temporally consistent series from 1948 through 2014. GLDAS-2.1 is forced with a combination of model and observation data from 2000 to present. GLDAS-2.2 product suites use data assimilation (DA), whereas the GLDAS-2.0 and GLDAS-2.1 products are "open-loop" (i.e., no data assimilation). The choice of forcing data, as well as DA observation source, variable, and scheme, vary for different GLDAS-2.2 products.GLDAS-2.0 is one of two components of the GLDAS Version 2 (GLDAS-2) dataset, the second being GLDAS-2.1. GLDAS-2.0 is reprocessed with the updated Princeton Global Meteorological Forcing Dataset (Sheffield et al., 2006) and upgraded Land Information System Version 7 (LIS-7). It covers the period 1948-2010, and will be extended to more recent years as corresponding forcing data become available.
The model simulation was initialized on January 1, 1948, using soil moisture and other state fields from the LSM climatology for that day of the year. The simulation used the common GLDAS datasets for land cover (MCD12Q1: Friedl et al., 2010), land water mask (MOD44W: Carroll et al., 2009), soil texture (Reynolds, 1999), and elevation (GTOPO30). The MODIS based land surface parameters are used in the current GLDAS-2.x products while the AVHRR base parameters were used in GLDAS-1 and previous GLDAS-2 products (prior to October 2012).
Documentation:
Provider's Note: the names with extension _tavg are variables averaged over the past 3-hours, the names with extension '_acc' are variables accumulated over the past 3-hours, the names with extension '_inst' are instantaneous variables, and the names with '_f' are forcing variables.
Bands
Bands
Pixel size: 27830 meters (all bands)
| Name | Units | Min | Max | Pixel Size | Description |
|---|---|---|---|---|---|
Albedo_inst |
% | 4.99* | 82.25* | 27830 meters | Albedo |
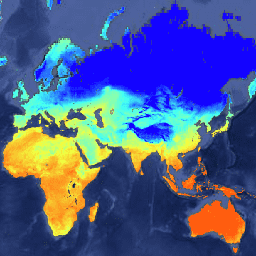
AvgSurfT_inst |
K | 194.55* | 351.63* | 27830 meters | Average surface skin temperature |
CanopInt_inst |
kg/m^2 | 0* | 0.5* | 27830 meters | Plant canopy surface water |
ECanop_tavg |
W/m^2 | 0* | 671.88* | 27830 meters | Canopy water evaporation |
ESoil_tavg |
W/m^2 | 0* | 592.64* | 27830 meters | Direct evaporation from bare soil |
Evap_tavg |
kg/m^2/s | 0* | 0.0002* | 27830 meters | Evapotranspiration |
LWdown_f_tavg |
W/m^2 | 44.62* | 561.46* | 27830 meters | Downward long-wave radiation flux |
Lwnet_tavg |
W/m^2 | -359.07* | 130.59* | 27830 meters | Net long-wave radiation flux |
PotEvap_tavg |
W/m^2 | -241.88* | 1513.78* | 27830 meters | Potential evaporation rate |
Psurf_f_inst |
Pa | 47824.1* | 109036* | 27830 meters | Pressure |
Qair_f_inst |
Mass fraction | 0* | 0.06* | 27830 meters | Specific humidity |
Qg_tavg |
W/m^2 | -517.58* | 485.13* | 27830 meters | Heat flux |
Qh_tavg |
W/m^2 | -872.46* | 797.71* | 27830 meters | Sensible heat net flux |
Qle_tavg |
W/m^2 | -243.71* | 716.69* | 27830 meters | Latent heat net flux |
Qs_acc |
kg/m^2 | 0* | 131.39* | 27830 meters | Storm surface runoff |
Qsb_acc |
kg/m^2 | 0* | 42.3* | 27830 meters | Baseflow-groundwater runoff |
Qsm_acc |
kg/m^2 | 0* | 27.58* | 27830 meters | Snow melt |
Rainf_f_tavg |
kg/m^2/s | 0* | 0.01* | 27830 meters | Total precipitation rate |
Rainf_tavg |
kg/m^2/s | 0* | 0.01* | 27830 meters | Rain precipitation rate |
RootMoist_inst |
kg/m^2 | 2* | 943.52* | 27830 meters | Root zone soil moisture |
SWE_inst |
kg/m^2 | 0* | 117284* | 27830 meters | Snow depth water equivalent |
SWdown_f_tavg |
W/m^2 | 0* | 1329.22* | 27830 meters | Downward short-wave radiation flux |
SnowDepth_inst |
m | 0* | 293.2* | 27830 meters | Snow depth |
Snowf_tavg |
kg/m^2/s | 0* | 0.004* | 27830 meters | Snow precipitation rate |
SoilMoi0_10cm_inst |
kg/m^2 | 1.99* | 47.59* | 27830 meters | Soil moisture |
SoilMoi10_40cm_inst |
kg/m^2 | 5.99* | 142.8* | 27830 meters | Soil moisture |
SoilMoi40_100cm_inst |
kg/m^2 | 11.99* | 285.6* | 27830 meters | Soil moisture |
SoilMoi100_200cm_inst |
kg/m^2 | 20* | 476* | 27830 meters | Soil moisture |
SoilTMP0_10cm_inst |
K | 218.75* | 329.55* | 27830 meters | Soil temperature |
SoilTMP10_40cm_inst |
K | 227.3* | 317.08* | 27830 meters | Soil temperature |
SoilTMP40_100cm_inst |
K | 232.59* | 313.47* | 27830 meters | Soil temperature |
SoilTMP100_200cm_inst |
K | 234.5* | 311.86* | 27830 meters | Soil temperature |
Swnet_tavg |
W/m^2 | 0* | 1128.86* | 27830 meters | Net short wave radiation flux |
Tair_f_inst |
K | 197.03* | 326.2* | 27830 meters | Air temperature |
Tveg_tavg |
W/m^2 | 0* | 611.89* | 27830 meters | Transpiration |
Wind_f_inst |
m/s | 0.06* | 30.31* | 27830 meters | Wind speed |
Image Properties
Image Properties
| Name | Type | Description |
|---|---|---|
| end_hour | DOUBLE | End hour |
| start_hour | DOUBLE | Start hour |
Terms of Use
Terms of Use
Distribution of data from the Goddard Earth Sciences Data and Information Services Center (GES DISC) is funded by NASA's Science Mission Directorate (SMD). Consistent with NASA Earth Science Data and Information Policy, data from the GES DISC archive are available free to the user community. For more information visit the GES DISC Data Policy page.
Citations
Rodell, M., P.R. Houser, U. Jambor, J. Gottschalck, K. Mitchell, C.-J. Meng, K. Arsenault, B. Cosgrove, J. Radakovich, M. Bosilovich, J.K. Entin, J.P. Walker, D. Lohmann, and D. Toll, The Global Land Data Assimilation System, Bull. Amer. Meteor. Soc., 85(3), 381-394, 2004.
Explore with Earth Engine
Code Editor (JavaScript)
var dataset = ee.ImageCollection('NASA/GLDAS/V20/NOAH/G025/T3H')
                  .filter(ee.Filter.date('2010-06-01', '2010-06-02'));
var averageSurfaceSkinTemperatureK = dataset.select('AvgSurfT_inst');
var averageSurfaceSkinTemperatureKVis = {
  min: 250.0,
  max: 300.0,
  palette: ['1303ff', '42fff6', 'f3ff40', 'ff5d0f'],
};
Map.setCenter(71.72, 52.48, 3.0);
Map.addLayer(
    averageSurfaceSkinTemperatureK, averageSurfaceSkinTemperatureKVis,
    'Average Surface Skin Temperature [K]');