Page Summary
-
This dataset has been superseded by LANDSAT/COMPOSITES/C02/T1_L2_8DAY_EVI.
-
The dataset contains Landsat 4 TM Collection 1 Tier 1 8-Day EVI composites.
-
The composites are made from Tier 1 orthorectified scenes using computed top-of-atmosphere reflectance.
-
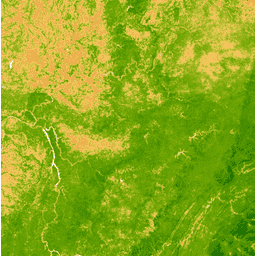
The Enhanced Vegetation Index (EVI) is generated from Near-IR, Red, and Blue bands and ranges from -1.0 to 1.0.
-
Landsat datasets are public domain and may be used without copyright restriction, with credit to USGS as the data source.
- Dataset Availability
- 1982-08-21T00:00:00Z–1993-12-11T00:00:00Z
- Dataset Producer
- Tags
Description
These Landsat 4 TM Collection 1 Tier 1 composites are made from Tier 1 orthorectified scenes, using the computed top-of-atmosphere (TOA) reflectance. See Chander et al. (2009) for details on the TOA computation.
The Enhanced Vegetation Index (EVI) is generated from the Near-IR, Red and Blue bands of each scene, and ranges in value from -1.0 to 1.0. See Huete et al. (2002) for details.
These composites are created from all the scenes in each 8-day period beginning from the first day of the year and continuing to the 360th day of the year. The last composite of the year, beginning on day 361, will overlap the first composite of the following year by 3 days. All the images from each 8-day period are included in the composite, with the most recent pixel as the composite value.
Bands
Bands
| Name | Pixel Size | Description |
|---|---|---|
EVI |
30 meters | Enhanced Vegetation Index |
Terms of Use
Terms of Use
Landsat datasets are federally created data and therefore reside in the public domain and may be used, transferred, or reproduced without copyright restriction.
Acknowledgement or credit of the USGS as data source should be provided by including a line of text citation such as the example shown below.
(Product, Image, Photograph, or Dataset Name) courtesy of the U.S. Geological Survey
Example: Landsat-7 image courtesy of the U.S. Geological Survey
See the USGS Visual Identity System Guidance for further details on proper citation and acknowledgement of USGS products.