Page Summary
-
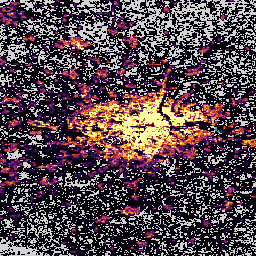
This dataset shows the spatial distribution of residential population from 1975 to 2030, expressed as the absolute number of inhabitants per cell.
-
Population estimates and projections were derived from CIESIN GPWv4.11 and disaggregated to grid cells based on built-up areas from GHSL layers.
-
The dataset has a pixel size of 100 meters and includes a
population_countband. -
The GHSL data is open and free to use, requiring source acknowledgement according to European Commission reuse conditions.
- Dataset Availability
- 1975-01-01T00:00:00Z–2030-12-31T00:00:00Z
- Dataset Producer
- EC JRC
- Tags
Description
This raster dataset depicts the spatial distribution of residential population, expressed as the absolute number of inhabitants of the cell. Residential population estimates between 1975 and 2020 in 5-year intervals and projections to 2025 and 2030 derived from CIESIN GPWv4.11 were disaggregated from census or administrative units to grid cells, informed by the distribution, volume, and classification of built-up area as mapped in the global GHSL built-up surface layers per epoch.
More information about the GHSL main products can be found in the GHSL Data Package 2023 report
The Global Human Settlement Layer (GHSL) project is supported by the European Commission, Joint Research Center, and Directorate-General for Regional and Urban Policy.
Bands
Bands
Pixel size: 100 meters (all bands)
| Name | Pixel Size | Description |
|---|---|---|
population_count |
100 meters | Population count by epoch |
Terms of Use
Terms of Use
The GHSL has been produced by the European Commission Joint Research Centre as open and free data. Reuse is authorised, provided the source is acknowledged. For more information, please read the use conditions (European Commission Reuse and Copyright Notice).
Citations
Dataset : Schiavina, Marcello; Freire, Sergio; Alessandra Carioli; MacManus, Kytt (2023): GHS-POP R2023A - GHS population grid multitemporal (1975-2030). European Commission, Joint Research Centre (JRC) PID: http://data.europa.eu/89h/2ff68a52-5b5b-4a22-8f40-c41da8332cfe doi:10.2905/2FF68A52-5B5B-4A22-8F40-C41DA8332CFE
Methodology : Pesaresi, Martino, Marcello Schiavina, Panagiotis Politis, Sergio Freire, Katarzyna Krasnodebska, Johannes H. Uhl, Alessandra Carioli, et al. (2024). Advances on the Global Human Settlement Layer by Joint Assessment of Earth Observation and Population Survey Data. International Journal of Digital Earth 17(1). doi:10.1080/17538947.2024.2390454.
DOIs
Explore with Earth Engine
Code Editor (JavaScript)
var baseChange =
    [{featureType: 'all', stylers: [{saturation: -100}, {lightness: 45}]}];
Map.setOptions('baseChange', {'baseChange': baseChange});
var image1975 = ee.Image('JRC/GHSL/P2023A/GHS_POP/1975');
var image1990 = ee.Image('JRC/GHSL/P2023A/GHS_POP/1990');
var image2020 = ee.Image('JRC/GHSL/P2023A/GHS_POP/2020');
var populationCountVis = {
  min: 0.0,
  max: 100.0,
  palette:
      ['000004', '320A5A', '781B6C', 'BB3654', 'EC6824', 'FBB41A', 'FCFFA4']
};
Map.setCenter(8, 48, 7);
image1975 = image1975.updateMask(image1975.gt(0));
image1990 = image1990.updateMask(image1990.gt(0));
image2020 = image2020.updateMask(image2020.gt(0));
Map.addLayer(image1975, populationCountVis, 'Population count, 1975');
Map.addLayer(image1990, populationCountVis, 'Population count, 1990');
Map.addLayer(image2020, populationCountVis, 'Population count, 2020');