Page Summary
-
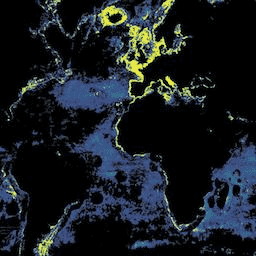
This dataset from Global Fishing Watch provides fishing vessel presence data measured in hours per square km.
-
Data is available daily from 2012 to 2017 and includes presence for different gear types.
-
The dataset is licensed under a Creative Commons Attribution-ShareAlike 4.0 International license.
- Dataset Availability
- 2012-01-01T00:00:00Z–2017-01-01T00:00:00Z
- Dataset Producer
- Global Fishing Watch
- Cadence
- 1 Day
- Tags
Description
Fishing vessel presence, measured in hours per square km. Each asset is the vessel presence for a given flag state and day, with one band for the presence of each gear type.
See sample Earth Engine scripts. Also see the main GFW site for program information, fully interactive visualization maps, and impacts.
Bands
Bands
Pixel size: 1113.2 meters (all bands)
| Name | Units | Pixel Size | Description |
|---|---|---|---|
drifting_longlines |
h/km^2 | 1113.2 meters | Hours per sq. km of fishing vessel presence with drifting longlines. |
fixed_gear |
h/km^2 | 1113.2 meters | Hours per sq. km of fishing vessel presence with fixed gear. |
other_fishing |
h/km^2 | 1113.2 meters | Hours per sq. km of fishing vessel presence with other gear types. |
purse_seines |
h/km^2 | 1113.2 meters | Hours per sq. km of fishing vessel presence with purse seines. |
squid_jigger |
h/km^2 | 1113.2 meters | Hours per sq. km of fishing vessel presence with squid jiggers. |
trawlers |
h/km^2 | 1113.2 meters | Hours per sq. km of fishing vessel presence with trawlers. |
Image Properties
Image Properties
| Name | Type | Description |
|---|---|---|
| country | STRING | ISO3 country code of the vessel flag state. For all countries, use "WLD". |
Terms of Use
Terms of Use
This work is licensed under a Creative Commons Attribution-ShareAlike 4.0 International license. (CC-BY-SA)
Citations
Global Fishing Watch, "Tracking the Global Footprint of Fisheries." Science 361.6378 (2018).
Explore with Earth Engine
Code Editor (JavaScript)
var dataset = ee.ImageCollection('GFW/GFF/V1/vessel_hours')
                  .filter(ee.Filter.date('2016-12-01', '2017-01-01'));
var trawlers = dataset.select('trawlers');
var trawlersVis = {
  min: 0.0,
  max: 5.0,
};
Map.setCenter(130.61, 34.287, 8);
Map.addLayer(trawlers.max(), trawlersVis, 'Trawlers');