- Dataset Availability
- 2019-12-01T00:00:00Z–2020-12-01T00:00:00Z
- Dataset Producer
- Earth Big Data LLC Alaska Satellite Facility
- Tags
Description
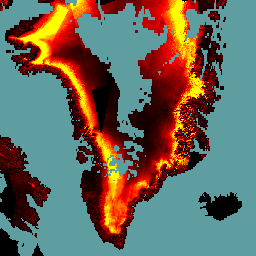
This data set is the first-of-its-kind spatial representation of multi-seasonal, global C-band Synthetic Aperture Radar (SAR) interferometric repeat-pass coherence and backscatter signatures. Coverage comprises land masses and ice sheets from 82 degrees Northern to 79 degrees Southern latitudes. The data set is derived from multi-temporal repeat-pass interferometric processing of about 205,000 Sentinel-1 C-band SAR images acquired in Interferometric Wide-Swath Mode from 1-Dec-2019 to 30-Nov-2020.
This dataset contains mean Radiometrically Terrain Corrected (RTC) backscatter. The raw signal intensity has been adjusted to account for the influence of local topography (like hills and slopes) on the measured radar cross-section. This correction is performed to produce a terrain-flattened backscatter value that is more representative of the intrinsic scattering properties of the surface itself.
If you would like to do calculations using the digital numbers from the original rasters, load Earth_Big_Data/GLOBAL_SEASONAL_S1/V2019/BACKSCATTER_RAW instead.
Other datasets derived from Sentinel-1 observations over the same time period include:
Bands
Bands
Pixel size: 92.7 meters (all bands)
| Name | Units | Pixel Size | Description |
|---|---|---|---|
fall_hh_AMP |
dB | 92.7 meters | Fall (Sep-Nov 2020) HH backscatter amplitude. |
fall_hv_AMP |
dB | 92.7 meters | Fall (Sep-Nov 2020) HV backscatter amplitude. |
fall_vh_AMP |
dB | 92.7 meters | Fall (Sep-Nov 2020) VH backscatter amplitude. |
fall_vv_AMP |
dB | 92.7 meters | Fall (Sep-Nov 2020) VV backscatter amplitude. |
spring_hh_AMP |
dB | 92.7 meters | Spring (Mar-May 2020) HH backscatter amplitude. |
spring_hv_AMP |
dB | 92.7 meters | Spring (Mar-May 2020) HV backscatter amplitude. |
spring_vh_AMP |
dB | 92.7 meters | Spring (Mar-May 2020) VH backscatter amplitude. |
spring_vv_AMP |
dB | 92.7 meters | Spring (Mar-May 2020) VV backscatter amplitude. |
summer_hh_AMP |
dB | 92.7 meters | Summer (Jun-Aug 2020) HH backscatter amplitude. |
summer_hv_AMP |
dB | 92.7 meters | Summer (Jun-Aug 2020) HV backscatter amplitude. |
summer_vh_AMP |
dB | 92.7 meters | Summer (Jun-Aug 2020) VH backscatter amplitude. |
summer_vv_AMP |
dB | 92.7 meters | Summer (Jun-Aug 2020) VV backscatter amplitude. |
winter_hh_AMP |
dB | 92.7 meters | Winter (Dec 2019-Feb 2020) HH backscatter amplitude. |
winter_hv_AMP |
dB | 92.7 meters | Winter (Dec 2019-Feb 2020) HV backscatter amplitude. |
winter_vh_AMP |
dB | 92.7 meters | Winter (Dec 2019-Feb 2020) VH backscatter amplitude. |
winter_vv_AMP |
dB | 92.7 meters | Winter (Dec 2019-Feb 2020) VV backscatter amplitude. |
Image Properties
Image Properties
| Name | Type | Description |
|---|---|---|
| tile_id | STRING | Tile ID |
Terms of Use
Terms of Use
Citations
Kellndorfer, J., Cartus, O., Lavalle, M. et al. Global seasonal Sentinel-1 interferometric coherence and backscatter data set. Sci Data 9, 73 (2022). doi:10.1038/s41597-022-01189-6.
DOIs
Explore with Earth Engine
Code Editor (JavaScript)
var dataset =
    ee.ImageCollection('Earth_Big_Data/GLOBAL_SEASONAL_S1/V2019/BACKSCATTER');
var visParams = {
  bands: ['fall_hh_AMP'],
  min: 0,
  max: 1.25,
};
Map.setCenter(-45.2, 64.177, 5);
Map.addLayer(dataset, visParams, 'Fall HH AMP');