- در دسترس بودن مجموعه دادهها
- ۱۹۴۰-۰۱-۰۱T۰۰:۰۰:۰۰Z–۲۰۲۶-۰۵-۱۲T۲۳:۰۰:۰۰Z
- تولیدکننده مجموعه داده
- سرویس تغییرات اقلیمی کوپرنیک (C3S)
- کادانس
- ۱ ساعت
- برچسبها
توضیحات
ERA5 نسل پنجم بازتحلیل جوی ECMWF از آب و هوای جهانی است. این بازتحلیل توسط سرویس تغییرات اقلیمی کوپرنیک (C3S) در ECMWF تولید میشود. بازتحلیل، دادههای مدل را با مشاهدات از سراسر جهان در یک مجموعه داده کامل و سازگار جهانی با استفاده از قوانین فیزیک ترکیب میکند. ERA5 تخمینهای ساعتی برای تعداد زیادی از کمیتهای جوی، امواج اقیانوسی و سطح زمین ارائه میدهد. این دادهها زمین را در یک شبکه تقریباً ۳۱ کیلومتری پوشش میدهند و جو را با استفاده از ۱۳۷ سطح از سطح تا ارتفاع ۸۰ کیلومتری تجزیه و تحلیل میکنند. این مجموعه دادهها نشاندهنده دادههای «سطوح واحد» است که شامل پارامترهای دوبعدی است. دادهها از سال ۱۹۴۰ تا به امروز در دسترس هستند.
باندها
باندها
اندازه پیکسل: ۲۷۸۳۰ متر (همه باندها)
| نام | واحدها | اندازه پیکسل | توضیحات |
|---|---|---|---|
dewpoint_temperature_2m | ک | ۲۷۸۳۰ متر | این پارامتر دمایی است که هوا در ارتفاع ۲ متری بالای سطح زمین باید تا آن دما خنک شود تا اشباع رخ دهد. این معیاری از رطوبت هوا است. همراه با دما، میتوان از آن برای محاسبه رطوبت نسبی استفاده کرد. دمای نقطه شبنم ۲ متری با درونیابی بین پایینترین سطح مدل و سطح زمین، با در نظر گرفتن شرایط جوی، محاسبه میشود. |
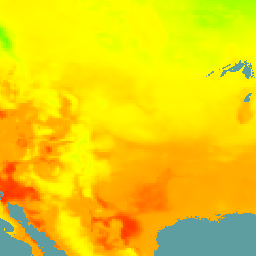
temperature_2m | ک | ۲۷۸۳۰ متر | این پارامتر دمای هوا در ارتفاع ۲ متری بالای سطح زمین، دریا یا آبهای داخلی است. دمای ۲ متری با درونیابی بین پایینترین سطح مدل و سطح زمین، با در نظر گرفتن شرایط جوی محاسبه میشود. |
ice_temperature_layer_1 | ک | ۲۷۸۳۰ متر | این پارامتر، دمای یخ دریا در لایه ۱ (۰ تا ۷ سانتیمتر) است. سیستم پیشبینی یکپارچه ECMWF (IFS) دارای یک صفحه یخ دریا چهار لایه است: لایه ۱: ۰-۷ سانتیمتر، لایه ۲: ۷-۲۸ سانتیمتر، لایه ۳: ۲۸-۱۰۰ سانتیمتر، لایه ۴: ۱۰۰-۱۵۰ سانتیمتر. دمای یخ دریا در هر لایه با انتقال گرما بین لایههای یخ دریا و جو بالا و اقیانوس پایین تغییر میکند. این پارامتر در کل کره زمین، حتی در جایی که اقیانوس یا یخ دریا وجود ندارد، تعریف میشود. مناطقی که یخ دریا ندارند را میتوان تنها با در نظر گرفتن نقاط شبکهای که پوشش یخ دریا مقدار گمشدهای ندارد و بزرگتر از ۰.۰ است، پنهان کرد. |
ice_temperature_layer_2 | ک | ۲۷۸۳۰ متر | این پارامتر، دمای یخ دریا در لایه ۲ (۷ تا ۲۸ سانتیمتر) است. سیستم پیشبینی یکپارچه ECMWF (IFS) دارای یک صفحه یخ دریا چهار لایه است: لایه ۱: ۰-۷ سانتیمتر، لایه ۲: ۷-۲۸ سانتیمتر، لایه ۳: ۲۸-۱۰۰ سانتیمتر، لایه ۴: ۱۰۰-۱۵۰ سانتیمتر. دمای یخ دریا در هر لایه با انتقال گرما بین لایههای یخ دریا و جو بالا و اقیانوس پایین تغییر میکند. این پارامتر در کل کره زمین، حتی در جایی که اقیانوس یا یخ دریا وجود ندارد، تعریف میشود. مناطقی که یخ دریا ندارند را میتوان تنها با در نظر گرفتن نقاط شبکهای که پوشش یخ دریا مقدار گمشدهای ندارد و بزرگتر از ۰.۰ است، پنهان کرد. |
ice_temperature_layer_3 | ک | ۲۷۸۳۰ متر | این پارامتر، دمای یخ دریا در لایه ۳ (۲۸ تا ۱۰۰ سانتیمتر) است. سیستم پیشبینی یکپارچه ECMWF (IFS) دارای یک صفحه یخ دریا چهار لایه است: لایه ۱: ۰-۷ سانتیمتر، لایه ۲: ۷-۲۸ سانتیمتر، لایه ۳: ۲۸-۱۰۰ سانتیمتر، لایه ۴: ۱۰۰-۱۵۰ سانتیمتر. دمای یخ دریا در هر لایه با انتقال گرما بین لایههای یخ دریا و جو بالا و اقیانوس پایین تغییر میکند. این پارامتر در کل کره زمین، حتی در جایی که اقیانوس یا یخ دریا وجود ندارد، تعریف میشود. مناطقی که یخ دریا ندارند را میتوان تنها با در نظر گرفتن نقاط شبکهای که پوشش یخ دریا مقدار گمشدهای ندارد و بزرگتر از ۰.۰ است، پنهان کرد. |
ice_temperature_layer_4 | ک | ۲۷۸۳۰ متر | این پارامتر، دمای یخ دریا در لایه ۴ (۱۰۰ تا ۱۵۰ سانتیمتر) است. سیستم پیشبینی یکپارچه ECMWF (IFS) دارای یک صفحه یخ دریا چهار لایه است: لایه ۱: ۰-۷ سانتیمتر، لایه ۲: ۷-۲۸ سانتیمتر، لایه ۳: ۲۸-۱۰۰ سانتیمتر، لایه ۴: ۱۰۰-۱۵۰ سانتیمتر. دمای یخ دریا در هر لایه با انتقال گرما بین لایههای یخ دریا و جو بالا و اقیانوس پایین تغییر میکند. این پارامتر در کل کره زمین، حتی در جایی که اقیانوس یا یخ دریا وجود ندارد، تعریف میشود. مناطقی که یخ دریا ندارند را میتوان تنها با در نظر گرفتن نقاط شبکهای که پوشش یخ دریا مقدار گمشدهای ندارد و بزرگتر از ۰.۰ است، پنهان کرد. |
mean_sea_level_pressure | پا | ۲۷۸۳۰ متر | این پارامتر، فشار (نیرو بر واحد سطح) جو در سطح زمین است که با ارتفاع سطح متوسط دریا تنظیم شده است. این پارامتر، معیاری از وزنی است که تمام هوای موجود در یک ستون عمودی بالای یک نقطه روی سطح زمین، در صورتی که آن نقطه در سطح متوسط دریا قرار داشته باشد، خواهد داشت. این پارامتر در تمام سطوح - خشکی، دریا و آبهای داخلی - محاسبه میشود. نقشههای فشار سطح متوسط دریا برای شناسایی مکان سیستمهای آب و هوایی کمفشار و پرفشار، که اغلب به عنوان سیکلونها و آنتیسیکلونها شناخته میشوند، استفاده میشوند. خطوط منحنی فشار سطح متوسط دریا همچنین نشاندهنده قدرت باد هستند. خطوط منحنی فشرده، بادهای قویتر را نشان میدهند. |
sea_surface_temperature | ک | ۲۷۸۳۰ متر | این پارامتر (SST) دمای آب دریا در نزدیکی سطح است. در ERA5، این پارامتر یک SST پایه است، به این معنی که هیچ تغییری به دلیل چرخه روزانه خورشید (تغییرات روزانه) وجود ندارد. SST، در ERA5، توسط دو ارائه دهنده خارجی ارائه میشود. قبل از سپتامبر ۲۰۰۷، SST از مجموعه داده HadISST2 استفاده میشود و از سپتامبر ۲۰۰۷ به بعد، از مجموعه داده OSTIA استفاده میشود. |
skin_temperature | ک | ۲۷۸۳۰ متر | این پارامتر دمای سطح زمین است. دمای پوست، دمای نظری مورد نیاز برای برآوردن تعادل انرژی سطحی است. این دما، دمای بالاترین لایه سطحی را نشان میدهد که ظرفیت گرمایی ندارد و بنابراین میتواند فوراً به تغییرات شارهای سطحی پاسخ دهد. دمای پوست در خشکی و دریا به طور متفاوتی محاسبه میشود. |
surface_pressure | پا | ۲۷۸۳۰ متر | این پارامتر، فشار (نیرو بر واحد سطح) جو در سطح خشکی، دریا و آبهای داخلی است. این پارامتر، معیاری از وزن تمام هوای موجود در یک ستون عمودی بالای یک نقطه روی سطح زمین است. فشار سطح اغلب در ترکیب با دما برای محاسبه چگالی هوا استفاده میشود. تغییرات شدید فشار با ارتفاع، مشاهده سیستمهای آب و هوایی کم فشار و پرفشار را بر فراز مناطق کوهستانی دشوار میکند، بنابراین معمولاً از میانگین فشار سطح دریا، به جای فشار سطح، برای این منظور استفاده میشود. |
u_component_of_wind_100m | اماس | ۲۷۸۳۰ متر | این پارامتر، مؤلفهی شرقی باد ۱۰۰ متری است. این پارامتر، سرعت افقی هوای در حال حرکت به سمت شرق، در ارتفاع ۱۰۰ متری بالای سطح زمین، بر حسب متر بر ثانیه است. هنگام مقایسهی پارامترهای مدل با مشاهدات باید دقت کرد، زیرا مشاهدات اغلب به صورت محلی و مربوط به یک نقطهی خاص در فضا و زمان هستند، نه اینکه میانگینهایی را در یک شبکهی مدل نشان دهند. این پارامتر را میتوان با مؤلفهی شمالی ترکیب کرد تا سرعت و جهت باد افقی ۱۰۰ متری را به دست آورد. |
v_component_of_wind_100m | اماس | ۲۷۸۳۰ متر | این پارامتر، مؤلفهی رو به شمال باد ۱۰۰ متری است. این پارامتر، سرعت افقی هوای در حال حرکت به سمت شمال، در ارتفاع ۱۰۰ متری بالای سطح زمین، بر حسب متر بر ثانیه است. هنگام مقایسهی پارامترهای مدل با مشاهدات باید دقت کرد، زیرا مشاهدات اغلب به صورت محلی و مربوط به یک نقطهی خاص در فضا و زمان هستند، نه اینکه میانگینهایی را در یک شبکهی مدل نشان دهند. این پارامتر را میتوان با مؤلفهی رو به شرق ترکیب کرد تا سرعت و جهت باد افقی ۱۰۰ متری را به دست آورد. |
u_component_of_neutral_wind_10m | اماس | ۲۷۸۳۰ متر | این پارامتر، مؤلفهی شرقی «باد خنثی» در ارتفاع ۱۰ متری از سطح زمین است. باد خنثی با فرض اینکه هوا به صورت خنثی لایهبندی شده است، از تنش سطحی و طول ناهمواری مربوطه محاسبه میشود. باد خنثی در شرایط پایدار کندتر از باد واقعی و در شرایط ناپایدار سریعتر است. باد خنثی، طبق تعریف، در جهت تنش سطحی است. اندازهی طول ناهمواری به خواص سطح زمین یا وضعیت دریا بستگی دارد. |
u_component_of_wind_10m | اماس | ۲۷۸۳۰ متر | این پارامتر، مؤلفه شرقی باد ۱۰ متری است. این سرعت افقی هوا است که در ارتفاع ده متری از سطح زمین، به سمت شرق حرکت میکند و واحد آن متر بر ثانیه است. هنگام مقایسه این پارامتر با مشاهدات باید دقت کرد، زیرا مشاهدات باد در مقیاسهای مکانی و زمانی کوچک متفاوت است و تحت تأثیر عوارض محلی، پوشش گیاهی و ساختمانهایی قرار میگیرد که فقط به طور متوسط در سیستم پیشبینی یکپارچه ECMWF (IFS) نشان داده میشوند. این پارامتر را میتوان با مؤلفه V باد ۱۰ متری ترکیب کرد تا سرعت و جهت باد افقی ۱۰ متری را به دست آورد. |
v_component_of_neutral_wind_10m | اماس | ۲۷۸۳۰ متر | این پارامتر، مؤلفه شمالی «باد خنثی» در ارتفاع ۱۰ متری از سطح زمین است. باد خنثی با فرض اینکه هوا به صورت خنثی لایهبندی شده است، از تنش سطحی و طول ناهمواری مربوطه محاسبه میشود. باد خنثی در شرایط پایدار کندتر از باد واقعی و در شرایط ناپایدار سریعتر است. باد خنثی، طبق تعریف، در جهت تنش سطحی است. اندازه طول ناهمواری به خواص سطح زمین یا وضعیت دریا بستگی دارد. |
v_component_of_wind_10m | اماس | ۲۷۸۳۰ متر | این پارامتر، مؤلفه شمالی باد ۱۰ متری است. این سرعت افقی هوا است که در ارتفاع ده متری از سطح زمین، به سمت شمال حرکت میکند و واحد آن متر بر ثانیه است. هنگام مقایسه این پارامتر با مشاهدات باید دقت کرد، زیرا مشاهدات باد در مقیاسهای مکانی و زمانی کوچک متفاوت است و تحت تأثیر عوارض محلی، پوشش گیاهی و ساختمانهایی قرار میگیرد که فقط به طور متوسط در سیستم پیشبینی یکپارچه ECMWF (IFS) نشان داده میشوند. این پارامتر را میتوان با مؤلفه U باد ۱۰ متری ترکیب کرد تا سرعت و جهت باد افقی ۱۰ متری را به دست آورد. |
instantaneous_10m_wind_gust | اماس | ۲۷۸۳۰ متر | این پارامتر حداکثر وزش باد در زمان مشخص شده، در ارتفاع ده متری از سطح زمین است. سازمان جهانی هواشناسی (WMO) وزش باد را به عنوان حداکثر میانگین باد در فواصل ۳ ثانیهای تعریف میکند. این مدت زمان کوتاهتر از یک گام زمانی مدل است و بنابراین سیستم پیشبینی یکپارچه ECMWF (IFS) بزرگی یک وزش باد را در هر گام زمانی از میانگین تنش سطحی، اصطکاک سطحی، برش باد و پایداری در گام زمانی استنباط میکند. هنگام مقایسه پارامترهای مدل با مشاهدات باید دقت کرد، زیرا مشاهدات اغلب محلی و مربوط به یک نقطه خاص در فضا و زمان هستند، نه اینکه میانگینها را در یک جعبه شبکه مدل نشان دهند. |
mean_boundary_layer_dissipation | وات بر متر مربع | ۲۷۸۳۰ متر | این پارامتر، میانگین نرخ تبدیل انرژی جنبشی در جریان متوسط به گرما، در کل ستون اتمسفر، در واحد سطح است که به دلیل اثرات تنش مرتبط با پیچکهای آشفته نزدیک سطح و نیروی پسای فرم کوهنگاری آشفته ایجاد میشود. این پارامتر توسط طرحهای انتشار آشفته و نیروی پسای فرم کوهنگاری آشفته سیستم پیشبینی یکپارچه ECMWF محاسبه میشود. پیچکهای آشفته نزدیک سطح به ناهمواری سطح مربوط میشوند. نیروی پسای فرم کوهنگاری آشفته، تنش ناشی از درهها، تپهها و کوهها در مقیاسهای افقی زیر 5 کیلومتر است که از دادههای سطح زمین با وضوح حدود 1 کیلومتر مشخص میشوند. (اتلاف مرتبط با ویژگیهای کوهنگاری با مقیاسهای افقی بین 5 کیلومتر و مقیاس شبکه مدل توسط طرح کوهنگاری زیرشبکهای در نظر گرفته میشود.) این پارامتر میانگینی در یک دوره زمانی خاص (دوره پردازش) است که به دادههای استخراج شده بستگی دارد. برای تحلیل مجدد، دوره پردازش بیش از 1 ساعت است که در تاریخ و زمان اعتبار پایان مییابد. برای اعضای گروه، میانگین گروه و اسپرد گروه، دوره پردازش بیش از ۳ ساعت است که در تاریخ و زمان اعتبار به پایان میرسد. |
mean_convective_precipitation_rate | کیلوگرم بر متر مربع بر ثانیه | ۲۷۸۳۰ متر | این پارامتر، نرخ بارش در سطح زمین است که توسط طرحواره همرفت در سیستم پیشبینی یکپارچه ECMWF (IFS) تولید میشود. طرحواره همرفت، همرفت را در مقیاسهای مکانی کوچکتر از جعبه شبکه نشان میدهد. بارش همچنین میتواند توسط طرحواره ابر در IFS تولید شود که نشان دهنده تشکیل و پراکندگی ابرها و بارش در مقیاس بزرگ به دلیل تغییرات در کمیتهای جوی (مانند فشار، دما و رطوبت) است که مستقیماً در مقیاسهای مکانی جعبه شبکه یا بزرگتر پیشبینی میشوند. در IFS، بارش شامل باران و برف است. این پارامتر میانگینی در یک دوره زمانی خاص (دوره پردازش) است که به دادههای استخراج شده بستگی دارد. برای تحلیل مجدد، دوره پردازش در طول ۱ ساعت منتهی به تاریخ و زمان اعتبار است. برای اعضای گروه، میانگین گروه و پراکندگی گروه، دوره پردازش در طول ۳ ساعت منتهی به تاریخ و زمان اعتبار است. این نرخی است که بارش در صورت پخش یکنواخت در جعبه شبکه خواهد داشت. ۱ کیلوگرم آب که روی ۱ متر مربع از سطح پخش شده باشد، ۱ میلیمتر عمق دارد (با صرف نظر از اثرات دما بر چگالی آب)، بنابراین واحدها معادل میلیمتر (از آب مایع) در ثانیه هستند. هنگام مقایسه پارامترهای مدل با مشاهدات باید دقت کرد، زیرا مشاهدات اغلب به جای اینکه میانگینها را در یک جعبه شبکه مدل نشان دهند، به یک نقطه خاص در فضا و زمان محلی هستند. |
mean_convective_snowfall_rate | کیلوگرم بر متر مربع بر ثانیه | ۲۷۸۳۰ متر | این پارامتر، نرخ بارش برف (شدت بارش برف) در سطح زمین است که توسط طرحواره همرفت در سیستم پیشبینی یکپارچه ECMWF (IFS) تولید میشود. طرحواره همرفت، همرفت را در مقیاسهای مکانی کوچکتر از جعبه شبکه نشان میدهد. بارش برف همچنین میتواند توسط طرحواره ابر در IFS تولید شود که نشان دهنده تشکیل و پراکندگی ابرها و بارش در مقیاس بزرگ به دلیل تغییرات در کمیتهای جوی (مانند فشار، دما و رطوبت) است که مستقیماً در مقیاسهای مکانی جعبه شبکه یا بزرگتر پیشبینی میشوند. در IFS، بارش شامل باران و برف است. این پارامتر میانگینی در یک دوره زمانی خاص (دوره پردازش) است که به دادههای استخراج شده بستگی دارد. برای تحلیل مجدد، دوره پردازش در طول ۱ ساعت منتهی به تاریخ و زمان اعتبار است. برای اعضای گروه، میانگین گروه و پراکندگی گروه، دوره پردازش در طول ۳ ساعت منتهی به تاریخ و زمان اعتبار است. این نرخی است که بارش برف در صورت پخش شدن یکنواخت در جعبه شبکه خواهد داشت. از آنجایی که ۱ کیلوگرم آب پخش شده روی ۱ متر مربع سطح، ۱ میلیمتر ضخامت دارد (با صرف نظر از اثرات دما بر چگالی آب)، واحدها معادل میلیمتر (از آب مایع) در ثانیه هستند. هنگام مقایسه پارامترهای مدل با مشاهدات باید دقت کرد، زیرا مشاهدات اغلب به جای اینکه میانگینها را در یک جعبه شبکه مدل نشان دهند، در یک نقطه خاص در فضا و زمان محلی هستند. |
mean_eastward_gravity_wave_surface_stress | N/m^2 | ۲۷۸۳۰ متر | جریان هوا بر روی یک سطح، تنشی (کشش) ایجاد میکند که تکانه را به سطح منتقل کرده و باد را کند میکند. این پارامتر، مؤلفه میانگین تنش سطحی در جهت شرق است که با امواج گرانشی کوهنوردی و انسداد کوهنوردی در سطح پایین مرتبط است. این پارامتر توسط طرح کوهنوردی زیرشبکهای سیستم پیشبینی یکپارچه ECMWF محاسبه میشود که نشان دهنده تنش ناشی از درهها، تپهها و کوههای حل نشده با مقیاس افقی بین ۵ کیلومتر و مقیاس شبکه مدل است. (تنش مرتبط با ویژگیهای کوهنوردی با مقیاس افقی کوچکتر از ۵ کیلومتر توسط طرح کشش فرم کوهنوردی آشفته در نظر گرفته میشود). امواج گرانشی کوهنوردی، نوساناتی در جریان هستند که توسط شناوری بستههای هوای جابجا شده حفظ میشوند و زمانی تولید میشوند که هوا توسط تپهها و کوهها به سمت بالا منحرف میشود. این فرآیند میتواند تنشی را بر جو در سطح زمین و در سایر سطوح جو ایجاد کند. مقادیر مثبت (منفی) نشان دهنده تنش بر سطح زمین در جهت شرق (غرب) است. این پارامتر، میانگینی در یک دوره زمانی خاص (دوره پردازش) است که به دادههای استخراجشده بستگی دارد. برای تحلیل مجدد، دوره پردازش در طول ۱ ساعت و در تاریخ و زمان اعتبار پایان مییابد. برای اعضای گروه، میانگین گروه و پراکندگی گروه، دوره پردازش در طول ۳ ساعت و در تاریخ و زمان اعتبار پایان مییابد. |
mean_eastward_turbulent_surface_stress | N/m^2 | ۲۷۸۳۰ متر | جریان هوا بر روی یک سطح، تنشی (درگ) اعمال میکند که تکانه را به سطح منتقل کرده و سرعت باد را کاهش میدهد. این پارامتر، مؤلفهای از تنش سطحی متوسط در جهت شرق است که با پیچکهای آشفته نزدیک سطح و درگ فرم کوهنگاری آشفته مرتبط است. این پارامتر توسط طرحهای انتشار آشفته و درگ فرم کوهنگاری آشفته سیستم پیشبینی یکپارچه ECMWF محاسبه میشود. پیچکهای آشفته نزدیک سطح با ناهمواری سطح مرتبط هستند. درگ فرم کوهنگاری آشفته، تنش ناشی از درهها، تپهها و کوهها در مقیاسهای افقی زیر 5 کیلومتر است که از دادههای سطح زمین با وضوح حدود 1 کیلومتر مشخص میشوند. (تنش مرتبط با ویژگیهای کوهنگاری با مقیاسهای افقی بین 5 کیلومتر و مقیاس شبکه مدل توسط طرح کوهنگاری زیرشبکهای در نظر گرفته میشود.) مقادیر مثبت (منفی) نشان دهنده تنش روی سطح زمین در جهت شرق (غرب) است. این پارامتر، میانگینی در یک دوره زمانی خاص (دوره پردازش) است که به دادههای استخراج شده بستگی دارد. برای تحلیل مجدد، دوره پردازش بیش از ۱ ساعت است که در تاریخ و زمان اعتبار پایان مییابد. برای اعضای گروه، میانگین گروه و پراکندگی گروه، دوره پردازش بیش از ۳ ساعت است که در تاریخ و زمان اعتبار پایان مییابد. |
mean_evaporation_rate | کیلوگرم بر متر مربع بر ثانیه | ۲۷۸۳۰ متر | این پارامتر مقدار آبی است که از سطح زمین تبخیر شده است، از جمله نمایش ساده شده تعرق (از پوشش گیاهی)، و به بخار در هوای بالا تبدیل شده است. این پارامتر میانگینی در یک دوره زمانی خاص (دوره پردازش) است که به دادههای استخراج شده بستگی دارد. برای تحلیل مجدد، دوره پردازش در طول ۱ ساعت منتهی به تاریخ و زمان اعتبار است. برای اعضای گروه، میانگین گروه و پراکندگی گروه، دوره پردازش در طول ۳ ساعت منتهی به تاریخ و زمان اعتبار است. قرارداد سیستم پیشبینی یکپارچه ECMWF (IFS) این است که شارهای رو به پایین مثبت هستند. بنابراین، مقادیر منفی نشان دهنده تبخیر و مقادیر مثبت نشان دهنده تراکم هستند. |
mean_gravity_wave_dissipation | وات بر متر مربع | ۲۷۸۳۰ متر | این پارامتر، میانگین نرخ تبدیل انرژی جنبشی در جریان متوسط به گرما، در کل ستون جوی، در واحد سطح است که ناشی از اثرات تنش مرتبط با انسداد کوهشناسی در سطح پایین و امواج گرانش کوهشناسی است. این پارامتر توسط طرح کوهشناسی زیرشبکهای سیستم پیشبینی یکپارچه ECMWF محاسبه میشود که نشان دهنده تنش ناشی از درهها، تپهها و کوههای حل نشده با مقیاسهای افقی بین ۵ کیلومتر و مقیاس شبکه مدل است. (اتلاف مرتبط با ویژگیهای کوهشناسی با مقیاسهای افقی کوچکتر از ۵ کیلومتر توسط طرح کشش فرم کوهشناسی آشفته در نظر گرفته میشود). امواج گرانش کوهشناسی، نوساناتی در جریان هستند که توسط شناوری بستههای هوای جابجا شده حفظ میشوند و زمانی تولید میشوند که هوا توسط تپهها و کوهها به سمت بالا منحرف میشود. این فرآیند میتواند تنشی را بر جو در سطح زمین و در سایر سطوح جو ایجاد کند. این پارامتر میانگینی در یک دوره زمانی خاص (دوره پردازش) است که به دادههای استخراج شده بستگی دارد. برای تحلیل مجدد، دوره پردازش بیش از ۱ ساعت است که در تاریخ و زمان اعتبار پایان مییابد. برای اعضای گروه، میانگین گروه و پراکندگی گروه، دوره پردازش بیش از ۳ ساعت است که در تاریخ و زمان اعتبار پایان مییابد. |
mean_large_scale_precipitation_fraction | بیبعد | ۲۷۸۳۰ متر | این پارامتر میانگین کسری از کادر شبکه (0-1) است که توسط بارش در مقیاس بزرگ پوشانده شده است. این پارامتر میانگینی در یک دوره زمانی خاص (دوره پردازش) است که به دادههای استخراج شده بستگی دارد. برای تحلیل مجدد، دوره پردازش در طول 1 ساعت منتهی به تاریخ و زمان اعتبار است. برای اعضای گروه، میانگین گروه و پراکندگی گروه، دوره پردازش در طول 3 ساعت منتهی به تاریخ و زمان اعتبار است. |
mean_large_scale_precipitation_rate | کیلوگرم بر متر مربع بر ثانیه | ۲۷۸۳۰ متر | این پارامتر، نرخ بارش در سطح زمین است که توسط طرحواره ابر در سیستم پیشبینی یکپارچه ECMWF (IFS) تولید میشود. طرحواره ابر، تشکیل و پراکندگی ابرها و بارش در مقیاس بزرگ را به دلیل تغییرات در کمیتهای جوی (مانند فشار، دما و رطوبت) که مستقیماً در مقیاسهای مکانی جعبه شبکه یا بزرگتر پیشبینی میشوند، نشان میدهد. بارش همچنین میتواند توسط طرحواره همرفت در IFS تولید شود که نشان دهنده همرفت در مقیاسهای مکانی کوچکتر از جعبه شبکه است. در IFS، بارش شامل باران و برف است. این پارامتر میانگینی در یک دوره زمانی خاص (دوره پردازش) است که به دادههای استخراج شده بستگی دارد. برای تحلیل مجدد، دوره پردازش در طول ۱ ساعت منتهی به تاریخ و زمان اعتبار است. برای اعضای گروه، میانگین گروه و پراکندگی گروه، دوره پردازش در طول ۳ ساعت منتهی به تاریخ و زمان اعتبار است. این نرخی است که بارش در صورت پخش یکنواخت در جعبه شبکه خواهد داشت. از آنجایی که ۱ کیلوگرم آب پخش شده در ۱ متر مربع سطح، ۱ میلیمتر عمق دارد (با صرف نظر از اثرات دما بر چگالی آب)، واحدها معادل میلیمتر (از آب مایع) در ثانیه هستند. هنگام مقایسه پارامترهای مدل با مشاهدات باید دقت کرد، زیرا مشاهدات اغلب به جای اینکه میانگینها را در یک جعبه شبکه مدل نشان دهند، در یک نقطه خاص از فضا و زمان محلی هستند. |
mean_large_scale_snowfall_rate | کیلوگرم بر متر مربع بر ثانیه | ۲۷۸۳۰ متر | این پارامتر، نرخ بارش برف (شدت بارش برف) در سطح زمین است که توسط طرحواره ابر در سیستم پیشبینی یکپارچه ECMWF (IFS) تولید میشود. طرحواره ابر، تشکیل و پراکندگی ابرها و بارش در مقیاس بزرگ را به دلیل تغییرات در کمیتهای جوی (مانند فشار، دما و رطوبت) که مستقیماً در مقیاسهای مکانی جعبه شبکه یا بزرگتر پیشبینی میشوند، نشان میدهد. بارش برف همچنین میتواند توسط طرحواره همرفت در IFS تولید شود که نشان دهنده همرفت در مقیاسهای مکانی کوچکتر از جعبه شبکه است. در IFS، بارش شامل باران و برف است. این پارامتر میانگینی در یک دوره زمانی خاص (دوره پردازش) است که به دادههای استخراج شده بستگی دارد. برای تحلیل مجدد، دوره پردازش در طول ۱ ساعت منتهی به تاریخ و زمان اعتبار است. برای اعضای گروه، میانگین گروه و پراکندگی گروه، دوره پردازش در طول ۳ ساعت منتهی به تاریخ و زمان اعتبار است. این نرخی است که بارش برف در صورت پخش شدن یکنواخت در جعبه شبکه خواهد داشت. از آنجایی که ۱ کیلوگرم آب پخش شده در ۱ متر مربع سطح، ۱ میلیمتر عمق دارد (با صرف نظر از اثرات دما بر چگالی آب)، واحدها معادل میلیمتر (از آب مایع) در ثانیه هستند. هنگام مقایسه پارامترهای مدل با مشاهدات باید دقت کرد، زیرا مشاهدات اغلب به جای اینکه میانگینها را در یک جعبه شبکه مدل نشان دهند، در یک نقطه خاص از فضا و زمان محلی هستند. |
mean_northward_gravity_wave_surface_stress | N/m^2 | ۲۷۸۳۰ متر | جریان هوا بر روی یک سطح، تنشی (کشش) ایجاد میکند که تکانه را به سطح منتقل کرده و باد را کند میکند. این پارامتر، مؤلفهای از تنش متوسط سطحی در جهت شمال است که با امواج گرانشی کوهنوردی و انسداد کوهنوردی در سطح پایین مرتبط است. این پارامتر توسط طرح کوهنوردی زیرشبکهای سیستم پیشبینی یکپارچه ECMWF محاسبه میشود که نشان دهنده تنش ناشی از درهها، تپهها و کوههای حل نشده با مقیاس افقی بین ۵ کیلومتر و مقیاس شبکه مدل است. (تنش مرتبط با ویژگیهای کوهنوردی با مقیاس افقی کوچکتر از ۵ کیلومتر توسط طرح کشش فرم کوهنوردی آشفته در نظر گرفته میشود). امواج گرانشی کوهنوردی، نوساناتی در جریان هستند که توسط شناوری بستههای هوای جابجا شده حفظ میشوند و زمانی تولید میشوند که هوا توسط تپهها و کوهها به سمت بالا منحرف میشود. این فرآیند میتواند تنشی را بر جو در سطح زمین و در سایر سطوح جو ایجاد کند. مقادیر مثبت (منفی) نشان دهنده تنش بر سطح زمین در جهت شمال (جنوب) است. این پارامتر، میانگینی در یک دوره زمانی خاص (دوره پردازش) است که به دادههای استخراجشده بستگی دارد. برای تحلیل مجدد، دوره پردازش در طول ۱ ساعت و در تاریخ و زمان اعتبار پایان مییابد. برای اعضای گروه، میانگین گروه و پراکندگی گروه، دوره پردازش در طول ۳ ساعت و در تاریخ و زمان اعتبار پایان مییابد. |
mean_northward_turbulent_surface_stress | N/m^2 | ۲۷۸۳۰ متر | جریان هوا بر روی یک سطح، تنشی (کشش) اعمال میکند که تکانه را به سطح منتقل کرده و سرعت باد را کاهش میدهد. این پارامتر، مؤلفهای از تنش سطحی متوسط در جهت شمال است که با پیچکهای آشفته نزدیک سطح و کشش فرم کوهنگاری آشفته مرتبط است. این پارامتر توسط طرحهای انتشار آشفته و کشش فرم کوهنگاری آشفته سیستم پیشبینی یکپارچه ECMWF محاسبه میشود. پیچکهای آشفته نزدیک سطح با ناهمواری سطح مرتبط هستند. کشش فرم کوهنگاری آشفته، تنش ناشی از درهها، تپهها و کوهها در مقیاسهای افقی زیر 5 کیلومتر است که از دادههای سطح زمین با وضوح حدود 1 کیلومتر مشخص میشوند. (تنش مرتبط با ویژگیهای کوهنگاری با مقیاسهای افقی بین 5 کیلومتر و مقیاس شبکه مدل توسط طرح کوهنگاری زیرشبکهای در نظر گرفته میشود.) مقادیر مثبت (منفی) نشان دهنده تنش روی سطح زمین در جهت شمال (جنوب) است. این پارامتر، میانگینی در یک دوره زمانی خاص (دوره پردازش) است که به دادههای استخراج شده بستگی دارد. برای تحلیل مجدد، دوره پردازش بیش از ۱ ساعت است که در تاریخ و زمان اعتبار پایان مییابد. برای اعضای گروه، میانگین گروه و پراکندگی گروه، دوره پردازش بیش از ۳ ساعت است که در تاریخ و زمان اعتبار پایان مییابد. |
mean_potential_evaporation_rate | کیلوگرم بر متر مربع بر ثانیه | ۲۷۸۳۰ متر | این پارامتر معیاری است که نشان میدهد شرایط جوی نزدیک به سطح زمین تا چه حد برای فرآیند تبخیر مساعد است. معمولاً به عنوان میزان تبخیر، تحت شرایط جوی موجود، از سطح آب خالص که دمای پایینترین لایه جو را دارد و نشاندهنده حداکثر تبخیر ممکن است، در نظر گرفته میشود. تبخیر بالقوه در سیستم پیشبینی یکپارچه ECMWF فعلی (IFS) بر اساس محاسبات تعادل انرژی سطحی با پارامترهای پوشش گیاهی تنظیم شده روی "کشاورزی زراعی/مخلوط" و با فرض "عدم تنش از رطوبت خاک" است. به عبارت دیگر، تبخیر برای زمینهای کشاورزی طوری محاسبه میشود که گویی به خوبی آبیاری میشوند و با فرض اینکه جو تحت تأثیر این شرایط مصنوعی سطح قرار نمیگیرد. مورد دوم ممکن است همیشه واقعبینانه نباشد. اگرچه تبخیر بالقوه برای ارائه تخمینی از نیازهای آبیاری در نظر گرفته شده است، اما این روش میتواند در شرایط خشک به دلیل تبخیر بیش از حد شدید ناشی از هوای خشک، نتایج غیرواقعی ارائه دهد. این پارامتر میانگینی در یک دوره زمانی خاص (دوره پردازش) است که به دادههای استخراج شده بستگی دارد. برای تجزیه و تحلیل مجدد، دوره پردازش بیش از 1 ساعت است که در تاریخ و زمان اعتبار پایان مییابد. برای اعضای گروه، میانگین گروه و اسپرد گروه، دوره پردازش بیش از ۳ ساعت است که در تاریخ و زمان اعتبار به پایان میرسد. |
mean_runoff_rate | کیلوگرم بر متر مربع بر ثانیه | ۲۷۸۳۰ متر | مقداری آب ناشی از بارندگی، ذوب برف یا در اعماق خاک، در خاک ذخیره میشود. در غیر این صورت، آب یا روی سطح (رواناب سطحی) یا زیر زمین (رواناب زیرسطحی) تخلیه میشود و مجموع این دو، رواناب نامیده میشود. این پارامتر، میانگینی در یک دوره زمانی خاص (دوره پردازش) است که به دادههای استخراج شده بستگی دارد. برای تحلیل مجدد، دوره پردازش در طول ۱ ساعت منتهی به تاریخ و زمان اعتبار است. برای اعضای گروه، میانگین گروه و پراکندگی گروه، دوره پردازش در طول ۳ ساعت منتهی به تاریخ و زمان اعتبار است. این نرخی است که رواناب در صورت پخش یکنواخت در کادر شبکه خواهد داشت. هنگام مقایسه پارامترهای مدل با مشاهدات باید دقت کرد، زیرا مشاهدات اغلب به جای میانگینگیری در یک کادر شبکه، در یک نقطه خاص محلی هستند. رواناب معیاری از میزان آب موجود در خاک است و به عنوان مثال، میتواند به عنوان شاخص خشکسالی یا سیل استفاده شود. |
mean_snow_evaporation_rate | کیلوگرم بر متر مربع بر ثانیه | ۲۷۸۳۰ متر | این پارامتر، میانگین نرخ تبخیر برف از ناحیه پوشیده از برف یک جعبه شبکه به بخار در هوای بالا است. سیستم پیشبینی یکپارچه ECMWF (IFS) برف را به عنوان یک لایه اضافی واحد روی بالاترین سطح خاک نشان میدهد. برف ممکن است تمام یا بخشی از جعبه شبکه را بپوشاند. این پارامتر میانگینی در یک دوره زمانی خاص (دوره پردازش) است که به دادههای استخراج شده بستگی دارد. برای تحلیل مجدد، دوره پردازش در طول ۱ ساعت منتهی به تاریخ و زمان اعتبار است. برای اعضای گروه، میانگین گروه و پراکندگی گروه، دوره پردازش در طول ۳ ساعت منتهی به تاریخ و زمان اعتبار است. این نرخی است که تبخیر برف در صورت پخش یکنواخت روی جعبه شبکه خواهد داشت. ۱ کیلوگرم آب پخش شده روی ۱ متر مربع از سطح، ۱ میلیمتر عمق دارد (با صرف نظر از اثرات دما بر چگالی آب)، بنابراین واحدها معادل میلیمتر (از آب مایع) در ثانیه هستند. قرارداد IFS این است که شارهای رو به پایین مثبت هستند. بنابراین، مقادیر منفی نشان دهنده تبخیر و مقادیر مثبت نشان دهنده رسوب هستند. |
mean_snowfall_rate | کیلوگرم بر متر مربع بر ثانیه | ۲۷۸۳۰ متر | این پارامتر، نرخ بارش برف در سطح زمین است. این مجموع بارش برف در مقیاس بزرگ و همرفتی است. بارش برف در مقیاس بزرگ توسط طرحواره ابری در سیستم پیشبینی یکپارچه ECMWF (IFS) تولید میشود. طرحواره ابری نشان دهنده تشکیل و پراکندگی ابرها و بارش در مقیاس بزرگ به دلیل تغییرات در کمیتهای جوی (مانند فشار، دما و رطوبت) است که مستقیماً در مقیاسهای مکانی جعبه شبکه یا بزرگتر پیشبینی میشوند. بارش برف همرفتی توسط طرحواره همرفت در IFS تولید میشود که نشان دهنده همرفت در مقیاسهای مکانی کوچکتر از جعبه شبکه است. در IFS، بارش شامل باران و برف است. این پارامتر میانگینی در یک دوره زمانی خاص (دوره پردازش) است که به دادههای استخراج شده بستگی دارد. برای تحلیل مجدد، دوره پردازش بیش از ۱ ساعت تا پایان تاریخ و زمان اعتبار است. برای اعضای گروه، میانگین گروه و پراکندگی گروه، دوره پردازش بیش از ۳ ساعت تا پایان تاریخ و زمان اعتبار است. این نرخ، نرخی است که اگر برف به طور یکنواخت روی جعبه شبکه پخش شود، بارش خواهد داشت. ۱ کیلوگرم آب پخش شده روی ۱ متر مربع سطح، ۱ میلیمتر عمق دارد (با صرف نظر از اثرات دما بر چگالی آب)، بنابراین واحدها معادل میلیمتر (از آب مایع) در ثانیه هستند. هنگام مقایسه پارامترهای مدل با مشاهدات باید دقت کرد، زیرا مشاهدات اغلب به صورت محلی و در یک نقطه خاص در فضا و زمان هستند، نه اینکه میانگینها را در یک جعبه شبکه مدل نشان دهند. |
mean_snowmelt_rate | کیلوگرم بر متر مربع بر ثانیه | ۲۷۸۳۰ متر | این پارامتر، نرخ ذوب برف در ناحیه پوشیده از برف یک جعبه شبکه است. سیستم پیشبینی یکپارچه ECMWF (IFS) برف را به عنوان یک لایه اضافی واحد روی بالاترین سطح خاک نشان میدهد. برف ممکن است تمام یا بخشی از جعبه شبکه را بپوشاند. این پارامتر میانگینی در یک دوره زمانی خاص (دوره پردازش) است که به دادههای استخراج شده بستگی دارد. برای تحلیل مجدد، دوره پردازش در طول ۱ ساعت منتهی به تاریخ و زمان اعتبار است. برای اعضای گروه، میانگین گروه و پراکندگی گروه، دوره پردازش در طول ۳ ساعت منتهی به تاریخ و زمان اعتبار است. این نرخ ذوب در صورتی است که به طور مساوی روی جعبه شبکه پخش شود. ۱ کیلوگرم آب پخش شده روی ۱ متر مربع از سطح، ۱ میلیمتر عمق دارد (با صرف نظر از اثرات دما بر چگالی آب)، بنابراین واحدها معادل میلیمتر (از آب مایع) در ثانیه هستند. |
mean_sub_surface_runoff_rate | کیلوگرم بر متر مربع بر ثانیه | ۲۷۸۳۰ متر | Some water from rainfall, melting snow, or deep in the soil, stays stored in the soil. Otherwise, the water drains away, either over the surface (surface runoff), or under the ground (sub-surface runoff) and the sum of these two is called runoff. This parameter is a mean over a particular time period (the processing period) which depends on the data extracted. For the reanalysis, the processing period is over the 1 hour ending at the validity date and time. For the ensemble members, ensemble mean and ensemble spread, the processing period is over the 3 hours ending at the validity date and time. It is the rate the runoff would have if it were spread evenly over the grid box. Care should be taken when comparing model parameters with observations, because observations are often local to a particular point rather than averaged over a grid box. Runoff is a measure of the availability of water in the soil, and can, for example, be used as an indicator of drought or flood. |
mean_surface_direct_short_wave_radiation_flux | وات بر متر مربع | ۲۷۸۳۰ متر | This parameter is the amount of direct solar radiation (also known as shortwave radiation) reaching the surface of the Earth. It is the amount of radiation passing through a horizontal plane. Solar radiation at the surface can be direct or diffuse. Solar radiation can be scattered in all directions by particles in the atmosphere, some of which reaches the surface (diffuse solar radiation). Some solar radiation reaches the surface without being scattered (direct solar radiation). This parameter is a mean over a particular time period (the processing period) which depends on the data extracted. For the reanalysis, the processing period is over the 1 hour ending at the validity date and time. For the ensemble members, ensemble mean and ensemble spread, the processing period is over the 3 hours ending at the validity date and time. The ECMWF convention for vertical fluxes is positive downwards. |
mean_surface_direct_short_wave_radiation_flux_clear_sky | وات بر متر مربع | ۲۷۸۳۰ متر | This parameter is the amount of direct radiation from the Sun (also known as solar or shortwave radiation) reaching the surface of the Earth, assuming clear-sky (cloudless) conditions. It is the amount of radiation passing through a horizontal plane. Solar radiation at the surface can be direct or diffuse. Solar radiation can be scattered in all directions by particles in the atmosphere, some of which reaches the surface (diffuse solar radiation). Some solar radiation reaches the surface without being scattered (direct solar radiation). Clear-sky radiation quantities are computed for exactly the same atmospheric conditions of temperature, humidity, ozone, trace gases and aerosol as the corresponding total-sky quantities (clouds included), but assuming that the clouds are not there. This parameter is a mean over a particular time period (the processing period) which depends on the data extracted. For the reanalysis, the processing period is over the 1 hour ending at the validity date and time. For the ensemble members, ensemble mean and ensemble spread, the processing period is over the 3 hours ending at the validity date and time. The ECMWF convention for vertical fluxes is positive downwards. |
mean_surface_downward_long_wave_radiation_flux | وات بر متر مربع | ۲۷۸۳۰ متر | This parameter is the amount of thermal (also known as longwave or terrestrial) radiation emitted by the atmosphere and clouds that reaches a horizontal plane at the surface of the Earth. The surface of the Earth emits thermal radiation, some of which is absorbed by the atmosphere and clouds. The atmosphere and clouds likewise emit thermal radiation in all directions, some of which reaches the surface (represented by this parameter). This parameter is a mean over a particular time period (the processing period) which depends on the data extracted. For the reanalysis, the processing period is over the 1 hour ending at the validity date and time. For the ensemble members, ensemble mean and ensemble spread, the processing period is over the 3 hours ending at the validity date and time. The ECMWF convention for vertical fluxes is positive downwards. |
mean_surface_downward_long_wave_radiation_flux_clear_sky | وات بر متر مربع | ۲۷۸۳۰ متر | This parameter is the amount of thermal (also known as longwave or terrestrial) radiation emitted by the atmosphere that reaches a horizontal plane at the surface of the Earth, assuming clear-sky (cloudless) conditions. The surface of the Earth emits thermal radiation, some of which is absorbed by the atmosphere and clouds. The atmosphere and clouds likewise emit thermal radiation in all directions, some of which reaches the surface. Clear-sky radiation quantities are computed for exactly the same atmospheric conditions of temperature, humidity, ozone, trace gases and aerosol as the corresponding total-sky quantities (clouds included), but assuming that the clouds are not there. This parameter is a mean over a particular time period (the processing period) which depends on the data extracted. For the reanalysis, the processing period is over the 1 hour ending at the validity date and time. For the ensemble members, ensemble mean and ensemble spread, the processing period is over the 3 hours ending at the validity date and time. The ECMWF convention for vertical fluxes is positive downwards. |
mean_surface_downward_short_wave_radiation_flux | وات بر متر مربع | ۲۷۸۳۰ متر | This parameter is the amount of solar radiation (also known as shortwave radiation) that reaches a horizontal plane at the surface of the Earth. This parameter comprises both direct and diffuse solar radiation. Radiation from the Sun (solar, or shortwave, radiation) is partly reflected back to space by clouds and particles in the atmosphere (aerosols) and some of it is absorbed. The rest is incident on the Earth's surface (represented by this parameter). To a reasonably good approximation, this parameter is the model equivalent of what would be measured by a pyranometer (an instrument used for measuring solar radiation) at the surface. However, care should be taken when comparing model parameters with observations, because observations are often local to a particular point in space and time, rather than representing averages over a model grid box. This parameter is a mean over a particular time period (the processing period) which depends on the data extracted. For the reanalysis, the processing period is over the 1 hour ending at the validity date and time. For the ensemble members, ensemble mean and ensemble spread, the processing period is over the 3 hours ending at the validity date and time. The ECMWF convention for vertical fluxes is positive downwards. |
mean_surface_downward_short_wave_radiation_flux_clear_sky | وات بر متر مربع | ۲۷۸۳۰ متر | This parameter is the amount of solar radiation (also known as shortwave radiation) that reaches a horizontal plane at the surface of the Earth, assuming clear-sky (cloudless) conditions. This parameter comprises both direct and diffuse solar radiation. Radiation from the Sun (solar, or shortwave, radiation) is partly reflected back to space by clouds and particles in the atmosphere (aerosols) and some of it is absorbed. The rest is incident on the Earth's surface. Clear-sky radiation quantities are computed for exactly the same atmospheric conditions of temperature, humidity, ozone, trace gases and aerosol as the corresponding total-sky quantities (clouds included), but assuming that the clouds are not there. This parameter is a mean over a particular time period (the processing period) which depends on the data extracted. For the reanalysis, the processing period is over the 1 hour ending at the validity date and time. For the ensemble members, ensemble mean and ensemble spread, the processing period is over the 3 hours ending at the validity date and time. The ECMWF convention for vertical fluxes is positive downwards. |
mean_surface_downward_uv_radiation_flux | وات بر متر مربع | ۲۷۸۳۰ متر | This parameter is the amount of ultraviolet (UV) radiation reaching the surface. It is the amount of radiation passing through a horizontal plane. UV radiation is part of the electromagnetic spectrum emitted by the Sun that has wavelengths shorter than visible light. In the ECMWF Integrated Forecasting system (IFS) it is defined as radiation with a wavelength of 0.20-0.44 µm (microns, 1 millionth of a metre). Small amounts of UV are essential for living organisms, but overexposure may result in cell damage; in humans this includes acute and chronic health effects on the skin, eyes and immune system. UV radiation is absorbed by the ozone layer, but some reaches the surface. The depletion of the ozone layer is causing concern over an increase in the damaging effects of UV. This parameter is a mean over a particular time period (the processing period) which depends on the data extracted. For the reanalysis, the processing period is over the 1 hour ending at the validity date and time. For the ensemble members, ensemble mean and ensemble spread, the processing period is over the 3 hours ending at the validity date and time. The ECMWF convention for vertical fluxes is positive downwards. |
mean_surface_latent_heat_flux | وات بر متر مربع | ۲۷۸۳۰ متر | This parameter is the transfer of latent heat (resulting from water phase changes, such as evaporation or condensation) between the Earth's surface and the atmosphere through the effects of turbulent air motion. Evaporation from the Earth's surface represents a transfer of energy from the surface to the atmosphere. This parameter is a mean over a particular time period (the processing period) which depends on the data extracted. For the reanalysis, the processing period is over the 1 hour ending at the validity date and time. For the ensemble members, ensemble mean and ensemble spread, the processing period is over the 3 hours ending at the validity date and time. The ECMWF convention for vertical fluxes is positive downwards. |
mean_surface_net_long_wave_radiation_flux | وات بر متر مربع | ۲۷۸۳۰ متر | Thermal radiation (also known as longwave or terrestrial radiation) refers to radiation emitted by the atmosphere, clouds and the surface of the Earth. This parameter is the difference between downward and upward thermal radiation at the surface of the Earth. It is the amount of radiation passing through a horizontal plane. The atmosphere and clouds emit thermal radiation in all directions, some of which reaches the surface as downward thermal radiation. The upward thermal radiation at the surface consists of thermal radiation emitted by the surface plus the fraction of downwards thermal radiation reflected upward by the surface. This parameter is a mean over a particular time period (the processing period) which depends on the data extracted. For the reanalysis, the processing period is over the 1 hour ending at the validity date and time. For the ensemble members, ensemble mean and ensemble spread, the processing period is over the 3 hours ending at the validity date and time. The ECMWF convention for vertical fluxes is positive downwards. |
mean_surface_net_long_wave_radiation_flux_clear_sky | وات بر متر مربع | ۲۷۸۳۰ متر | Thermal radiation (also known as longwave or terrestrial radiation) refers to radiation emitted by the atmosphere, clouds and the surface of the Earth. This parameter is the difference between downward and upward thermal radiation at the surface of the Earth, assuming clear-sky (cloudless) conditions. It is the amount of radiation passing through a horizontal plane. Clear-sky radiation quantities are computed for exactly the same atmospheric conditions of temperature, humidity, ozone, trace gases and aerosol as the corresponding total-sky quantities (clouds included), but assuming that the clouds are not there. The atmosphere and clouds emit thermal radiation in all directions, some of which reaches the surface as downward thermal radiation. The upward thermal radiation at the surface consists of thermal radiation emitted by the surface plus the fraction of downwards thermal radiation reflected upward by the surface. This parameter is a mean over a particular time period (the processing period) which depends on the data extracted. For the reanalysis, the processing period is over the 1 hour ending at the validity date and time. For the ensemble members, ensemble mean and ensemble spread, the processing period is over the 3 hours ending at the validity date and time. The ECMWF convention for vertical fluxes is positive downwards. |
mean_surface_net_short_wave_radiation_flux | وات بر متر مربع | ۲۷۸۳۰ متر | This parameter is the amount of solar radiation (also known as shortwave radiation) that reaches a horizontal plane at the surface of the Earth (both direct and diffuse) minus the amount reflected by the Earth's surface (which is governed by the albedo). Radiation from the Sun (solar, or shortwave, radiation) is partly reflected back to space by clouds and particles in the atmosphere (aerosols) and some of it is absorbed. The remainder is incident on the Earth's surface, where some of it is reflected. This parameter is a mean over a particular time period (the processing period) which depends on the data extracted. For the reanalysis, the processing period is over the 1 hour ending at the validity date and time. For the ensemble members, ensemble mean and ensemble spread, the processing period is over the 3 hours ending at the validity date and time. The ECMWF convention for vertical fluxes is positive downwards. |
mean_surface_net_short_wave_radiation_flux_clear_sky | وات بر متر مربع | ۲۷۸۳۰ متر | This parameter is the amount of solar (shortwave) radiation reaching the surface of the Earth (both direct and diffuse) minus the amount reflected by the Earth's surface (which is governed by the albedo), assuming clear-sky (cloudless) conditions. It is the amount of radiation passing through a horizontal plane. Clear-sky radiation quantities are computed for exactly the same atmospheric conditions of temperature, humidity, ozone, trace gases and aerosol as the corresponding total-sky quantities (clouds included), but assuming that the clouds are not there. Radiation from the Sun (solar, or shortwave, radiation) is partly reflected back to space by clouds and particles in the atmosphere (aerosols) and some of it is absorbed. The rest is incident on the Earth's surface, where some of it is reflected. The difference between downward and reflected solar radiation is the surface net solar radiation. This parameter is a mean over a particular time period (the processing period) which depends on the data extracted. For the reanalysis, the processing period is over the 1 hour ending at the validity date and time. For the ensemble members, ensemble mean and ensemble spread, the processing period is over the 3 hours ending at the validity date and time. The ECMWF convention for vertical fluxes is positive downwards. |
mean_surface_runoff_rate | کیلوگرم بر متر مربع بر ثانیه | ۲۷۸۳۰ متر | Some water from rainfall, melting snow, or deep in the soil, stays stored in the soil. Otherwise, the water drains away, either over the surface (surface runoff), or under the ground (sub-surface runoff) and the sum of these two is called runoff. This parameter is a mean over a particular time period (the processing period) which depends on the data extracted. For the reanalysis, the processing period is over the 1 hour ending at the validity date and time. For the ensemble members, ensemble mean and ensemble spread, the processing period is over the 3 hours ending at the validity date and time. It is the rate the runoff would have if it were spread evenly over the grid box. Care should be taken when comparing model parameters with observations, because observations are often local to a particular point rather than averaged over a grid box. Runoff is a measure of the availability of water in the soil, and can, for example, be used as an indicator of drought or flood. |
mean_surface_sensible_heat_flux | وات بر متر مربع | ۲۷۸۳۰ متر | This parameter is the transfer of heat between the Earth's surface and the atmosphere through the effects of turbulent air motion (but excluding any heat transfer resulting from condensation or evaporation). The magnitude of the sensible heat flux is governed by the difference in temperature between the surface and the overlying atmosphere, wind speed and the surface roughness. For example, cold air overlying a warm surface would produce a sensible heat flux from the land (or ocean) into the atmosphere. This parameter is a mean over a particular time period (the processing period) which depends on the data extracted. For the reanalysis, the processing period is over the 1 hour ending at the validity date and time. For the ensemble members, ensemble mean and ensemble spread, the processing period is over the 3 hours ending at the validity date and time. The ECMWF convention for vertical fluxes is positive downwards. |
mean_top_downward_short_wave_radiation_flux | وات بر متر مربع | ۲۷۸۳۰ متر | This parameter is the incoming solar radiation (also known as shortwave radiation), received from the Sun, at the top of the atmosphere. It is the amount of radiation passing through a horizontal plane. This parameter is a mean over a particular time period (the processing period) which depends on the data extracted. For the reanalysis, the processing period is over the 1 hour ending at the validity date and time. For the ensemble members, ensemble mean and ensemble spread, the processing period is over the 3 hours ending at the validity date and time. The ECMWF convention for vertical fluxes is positive downwards. |
mean_top_net_long_wave_radiation_flux | وات بر متر مربع | ۲۷۸۳۰ متر | The thermal (also known as terrestrial or longwave) radiation emitted to space at the top of the atmosphere is commonly known as the Outgoing Longwave Radiation (OLR). The top net thermal radiation (this parameter) is equal to the negative of OLR. This parameter is a mean over a particular time period (the processing period) which depends on the data extracted. For the reanalysis, the processing period is over the 1 hour ending at the validity date and time. For the ensemble members, ensemble mean and ensemble spread, the processing period is over the 3 hours ending at the validity date and time. The ECMWF convention for vertical fluxes is positive downwards. |
mean_top_net_long_wave_radiation_flux_clear_sky | وات بر متر مربع | ۲۷۸۳۰ متر | This parameter is the thermal (also known as terrestrial or longwave) radiation emitted to space at the top of the atmosphere, assuming clear-sky (cloudless) conditions. It is the amount passing through a horizontal plane. Note that the ECMWF convention for vertical fluxes is positive downwards, so a flux from the atmosphere to space will be negative. Clear-sky radiation quantities are computed for exactly the same atmospheric conditions of temperature, humidity, ozone, trace gases and aerosol as total-sky quantities (clouds included), but assuming that the clouds are not there. The thermal radiation emitted to space at the top of the atmosphere is commonly known as the Outgoing Longwave Radiation (OLR) (ie, taking a flux from the atmosphere to space as positive). This parameter is a mean over a particular time period (the processing period) which depends on the data extracted. For the reanalysis, the processing period is over the 1 hour ending at the validity date and time. For the ensemble members, ensemble mean and ensemble spread, the processing period is over the 3 hours ending at the validity date and time. |
mean_top_net_short_wave_radiation_flux | وات بر متر مربع | ۲۷۸۳۰ متر | This parameter is the incoming solar radiation (also known as shortwave radiation) minus the outgoing solar radiation at the top of the atmosphere. It is the amount of radiation passing through a horizontal plane. The incoming solar radiation is the amount received from the Sun. The outgoing solar radiation is the amount reflected and scattered by the Earth's atmosphere and surface. This parameter is a mean over a particular time period (the processing period) which depends on the data extracted. For the reanalysis, the processing period is over the 1 hour ending at the validity date and time. For the ensemble members, ensemble mean and ensemble spread, the processing period is over the 3 hours ending at the validity date and time. The ECMWF convention for vertical fluxes is positive downwards. |
mean_top_net_short_wave_radiation_flux_clear_sky | وات بر متر مربع | ۲۷۸۳۰ متر | This parameter is the incoming solar radiation (also known as shortwave radiation) minus the outgoing solar radiation at the top of the atmosphere, assuming clear-sky (cloudless) conditions. It is the amount of radiation passing through a horizontal plane. The incoming solar radiation is the amount received from the Sun. The outgoing solar radiation is the amount reflected and scattered by the Earth's atmosphere and surface, assuming clear-sky (cloudless) conditions. Clear-sky radiation quantities are computed for exactly the same atmospheric conditions of temperature, humidity, ozone, trace gases and aerosol as the total-sky (clouds included) quantities, but assuming that the clouds are not there. This parameter is a mean over a particular time period (the processing period) which depends on the data extracted. For the reanalysis, the processing period is over the 1 hour ending at the validity date and time. For the ensemble members, ensemble mean and ensemble spread, the processing period is over the 3 hours ending at the validity date and time. The ECMWF convention for vertical fluxes is positive downwards. |
mean_total_precipitation_rate | کیلوگرم بر متر مربع بر ثانیه | ۲۷۸۳۰ متر | This parameter is the rate of precipitation at the Earth's surface. It is the sum of the rates due to large-scale precipitation and convective precipitation. Large-scale precipitation is generated by the cloud scheme in the ECMWF Integrated Forecasting System (IFS). The cloud scheme represents the formation and dissipation of clouds and large-scale precipitation due to changes in atmospheric quantities (such as pressure, temperature and moisture) predicted directly at spatial scales of the grid box or larger. Convective precipitation is generated by the convection scheme in the IFS, which represents convection at spatial scales smaller than the grid box. In the IFS, precipitation is comprised of rain and snow. This parameter is a mean over a particular time period (the processing period) which depends on the data extracted. For the reanalysis, the processing period is over the 1 hour ending at the validity date and time. For the ensemble members, ensemble mean and ensemble spread, the processing period is over the 3 hours ending at the validity date and time. It is the rate the precipitation would have if it were spread evenly over the grid box. 1 kg of water spread over 1 square metre of surface is 1 mm deep (neglecting the effects of temperature on the density of water), therefore the units are equivalent to mm (of liquid water) per second. Care should be taken when comparing model parameters with observations, because observations are often local to a particular point in space and time, rather than representing averages over a model grid box. |
mean_vertically_integrated_moisture_divergence | کیلوگرم بر متر مربع بر ثانیه | ۲۷۸۳۰ متر | The vertical integral of the moisture flux is the horizontal rate of flow of moisture (water vapour, cloud liquid and cloud ice), per metre across the flow, for a column of air extending from the surface of the Earth to the top of the atmosphere. Its horizontal divergence is the rate of moisture spreading outward from a point, per square metre. This parameter is a mean over a particular time period (the processing period) which depends on the data extracted. For the reanalysis, the processing period is over the 1 hour ending at the validity date and time. For the ensemble members, ensemble mean and ensemble spread, the processing period is over the 3 hours ending at the validity date and time. This parameter is positive for moisture that is spreading out, or diverging, and negative for the opposite, for moisture that is concentrating, or converging (convergence). This parameter thus indicates whether atmospheric motions act to decrease (for divergence) or increase (for convergence) the vertical integral of moisture, over the time period. High negative values of this parameter (ie large moisture convergence) can be related to precipitation intensification and floods. 1 kg of water spread over 1 square metre of surface is 1 mm deep (neglecting the effects of temperature on the density of water), therefore the units are equivalent to mm (of liquid water) per second. |
clear_sky_direct_solar_radiation_at_surface | ژول بر متر مربع | ۲۷۸۳۰ متر | This parameter is the amount of direct radiation from the Sun (also known as solar or shortwave radiation) reaching the surface of the Earth, assuming clear-sky (cloudless) conditions. It is the amount of radiation passing through a horizontal plane. Solar radiation at the surface can be direct or diffuse. Solar radiation can be scattered in all directions by particles in the atmosphere, some of which reaches the surface (diffuse solar radiation). Some solar radiation reaches the surface without being scattered (direct solar radiation). Clear-sky radiation quantities are computed for exactly the same atmospheric conditions of temperature, humidity, ozone, trace gases and aerosol as the corresponding total-sky quantities (clouds included), but assuming that the clouds are not there. This parameter is accumulated over a particular time period which depends on the data extracted. For the reanalysis, the accumulation period is over the 1 hour ending at the validity date and time. For the ensemble members, ensemble mean and ensemble spread, the accumulation period is over the 3 hours ending at the validity date and time. The units are joules per square metre (J m^-2 ). To convert to watts per square metre (W m^-2 ), the accumulated values should be divided by the accumulation period expressed in seconds. The ECMWF convention for vertical fluxes is positive downwards. |
downward_uv_radiation_at_the_surface | ژول بر متر مربع | ۲۷۸۳۰ متر | This parameter is the amount of ultraviolet (UV) radiation reaching the surface. It is the amount of radiation passing through a horizontal plane. UV radiation is part of the electromagnetic spectrum emitted by the Sun that has wavelengths shorter than visible light. In the ECMWF Integrated Forecasting system (IFS) it is defined as radiation with a wavelength of 0.20-0.44 µm (microns, 1 millionth of a metre). Small amounts of UV are essential for living organisms, but overexposure may result in cell damage; in humans this includes acute and chronic health effects on the skin, eyes and immune system. UV radiation is absorbed by the ozone layer, but some reaches the surface. The depletion of the ozone layer is causing concern over an increase in the damaging effects of UV. This parameter is accumulated over a particular time period which depends on the data extracted. For the reanalysis, the accumulation period is over the 1 hour ending at the validity date and time. For the ensemble members, ensemble mean and ensemble spread, the accumulation period is over the 3 hours ending at the validity date and time. The units are joules per square metre (J m^-2 ). To convert to watts per square metre (W m^-2 ), the accumulated values should be divided by the accumulation period expressed in seconds. The ECMWF convention for vertical fluxes is positive downwards. |
forecast_logarithm_of_surface_roughness_for_heat | بیبعد | ۲۷۸۳۰ متر | This parameter is the natural logarithm of the roughness length for heat. The surface roughness for heat is a measure of the surface resistance to heat transfer. This parameter is used to determine the air to surface transfer of heat. For given atmospheric conditions, a higher surface roughness for heat means that it is more difficult for the air to exchange heat with the surface. A lower surface roughness for heat means that it is easier for the air to exchange heat with the surface. Over the ocean, surface roughness for heat depends on the waves. Over sea-ice, it has a constant value of 0.001 m. Over land, it is derived from the vegetation type and snow cover. |
instantaneous_surface_sensible_heat_flux | وات بر متر مربع | ۲۷۸۳۰ متر | This parameter is the transfer of heat between the Earth's surface and the atmosphere, at the specified time, through the effects of turbulent air motion (but excluding any heat transfer resulting from condensation or evaporation). The magnitude of the sensible heat flux is governed by the difference in temperature between the surface and the overlying atmosphere, wind speed and the surface roughness. For example, cold air overlying a warm surface would produce a sensible heat flux from the land (or ocean) into the atmosphere. The ECMWF convention for vertical fluxes is positive downwards. |
near_ir_albedo_for_diffuse_radiation | بیبعد | ۲۷۸۳۰ متر | Albedo is a measure of the reflectivity of the Earth's surface. This parameter is the fraction of diffuse solar (shortwave) radiation with wavelengths between 0.7 and 4 µm (microns, 1 millionth of a metre) reflected by the Earth's surface (for snow-free land surfaces only). Values of this parameter vary between 0 and 1. In the ECMWF Integrated Forecasting System (IFS) albedo is dealt with separately for solar radiation with wavelengths greater/less than 0.7µm and for direct and diffuse solar radiation (giving 4 components to albedo). Solar radiation at the surface can be direct or diffuse. Solar radiation can be scattered in all directions by particles in the atmosphere, some of which reaches the surface (diffuse solar radiation). Some solar radiation reaches the surface without being scattered (direct solar radiation). In the IFS, a climatological (observed values averaged over a period of several years) background albedo is used which varies from month to month through the year, modified by the model over water, ice and snow. |
near_ir_albedo_for_direct_radiation | بیبعد | ۲۷۸۳۰ متر | Albedo is a measure of the reflectivity of the Earth's surface. This parameter is the fraction of direct solar (shortwave) radiation with wavelengths between 0.7 and 4 µm (microns, 1 millionth of a metre) reflected by the Earth's surface (for snow-free land surfaces only). Values of this parameter vary between 0 and 1. In the ECMWF Integrated Forecasting System (IFS) albedo is dealt with separately for solar radiation with wavelengths greater/less than 0.7µm and for direct and diffuse solar radiation (giving 4 components to albedo). Solar radiation at the surface can be direct or diffuse. Solar radiation can be scattered in all directions by particles in the atmosphere, some of which reaches the surface (diffuse solar radiation). Some solar radiation reaches the surface without being scattered (direct solar radiation). In the IFS, a climatological (observed values averaged over a period of several years) background albedo is used which varies from month to month through the year, modified by the model over water, ice and snow. |
surface_latent_heat_flux | ژول بر متر مربع | ۲۷۸۳۰ متر | This parameter is the transfer of latent heat (resulting from water phase changes, such as evaporation or condensation) between the Earth's surface and the atmosphere through the effects of turbulent air motion. Evaporation from the Earth's surface represents a transfer of energy from the surface to the atmosphere. This parameter is accumulated over a particular time period which depends on the data extracted. For the reanalysis, the accumulation period is over the 1 hour ending at the validity date and time. For the ensemble members, ensemble mean and ensemble spread, the accumulation period is over the 3 hours ending at the validity date and time. The units are joules per square metre (J m^-2 ). To convert to watts per square metre (W m^-2 ), the accumulated values should be divided by the accumulation period expressed in seconds. The ECMWF convention for vertical fluxes is positive downwards. |
surface_net_solar_radiation | ژول بر متر مربع | ۲۷۸۳۰ متر | This parameter is the amount of solar radiation (also known as shortwave radiation) that reaches a horizontal plane at the surface of the Earth (both direct and diffuse) minus the amount reflected by the Earth's surface (which is governed by the albedo). Radiation from the Sun (solar, or shortwave, radiation) is partly reflected back to space by clouds and particles in the atmosphere (aerosols) and some of it is absorbed. The remainder is incident on the Earth's surface, where some of it is reflected. This parameter is accumulated over a particular time period which depends on the data extracted. For the reanalysis, the accumulation period is over the 1 hour ending at the validity date and time. For the ensemble members, ensemble mean and ensemble spread, the accumulation period is over the 3 hours ending at the validity date and time. The units are joules per square metre (J m^-2 ). To convert to watts per square metre (W m^-2 ), the accumulated values should be divided by the accumulation period expressed in seconds. The ECMWF convention for vertical fluxes is positive downwards. |
surface_net_solar_radiation_clear_sky | ژول بر متر مربع | ۲۷۸۳۰ متر | This parameter is the amount of solar (shortwave) radiation reaching the surface of the Earth (both direct and diffuse) minus the amount reflected by the Earth's surface (which is governed by the albedo), assuming clear-sky (cloudless) conditions. It is the amount of radiation passing through a horizontal plane. Clear-sky radiation quantities are computed for exactly the same atmospheric conditions of temperature, humidity, ozone, trace gases and aerosol as the corresponding total-sky quantities (clouds included), but assuming that the clouds are not there. Radiation from the Sun (solar, or shortwave, radiation) is partly reflected back to space by clouds and particles in the atmosphere (aerosols) and some of it is absorbed. The rest is incident on the Earth's surface, where some of it is reflected. The difference between downward and reflected solar radiation is the surface net solar radiation. This parameter is accumulated over a particular time period which depends on the data extracted. For the reanalysis, the accumulation period is over the 1 hour ending at the validity date and time. For the ensemble members, ensemble mean and ensemble spread, the accumulation period is over the 3 hours ending at the validity date and time. The units are joules per square metre (J m^-2 ). To convert to watts per square metre (W m^-2 ), the accumulated values should be divided by the accumulation period expressed in seconds. The ECMWF convention for vertical fluxes is positive downwards. |
surface_net_thermal_radiation | ژول بر متر مربع | ۲۷۸۳۰ متر | Thermal radiation (also known as longwave or terrestrial radiation) refers to radiation emitted by the atmosphere, clouds and the surface of the Earth. This parameter is the difference between downward and upward thermal radiation at the surface of the Earth. It is the amount of radiation passing through a horizontal plane. The atmosphere and clouds emit thermal radiation in all directions, some of which reaches the surface as downward thermal radiation. The upward thermal radiation at the surface consists of thermal radiation emitted by the surface plus the fraction of downwards thermal radiation reflected upward by the surface. This parameter is accumulated over a particular time period which depends on the data extracted. For the reanalysis, the accumulation period is over the 1 hour ending at the validity date and time. For the ensemble members, ensemble mean and ensemble spread, the accumulation period is over the 3 hours ending at the validity date and time. The units are joules per square metre (J m^-2 ). To convert to watts per square metre (W m^-2 ), the accumulated values should be divided by the accumulation period expressed in seconds. The ECMWF convention for vertical fluxes is positive downwards. |
surface_net_thermal_radiation_clear_sky | ژول بر متر مربع | ۲۷۸۳۰ متر | Thermal radiation (also known as longwave or terrestrial radiation) refers to radiation emitted by the atmosphere, clouds and the surface of the Earth. This parameter is the difference between downward and upward thermal radiation at the surface of the Earth, assuming clear-sky (cloudless) conditions. It is the amount of radiation passing through a horizontal plane. Clear-sky radiation quantities are computed for exactly the same atmospheric conditions of temperature, humidity, ozone, trace gases and aerosol as the corresponding total-sky quantities (clouds included), but assuming that the clouds are not there. The atmosphere and clouds emit thermal radiation in all directions, some of which reaches the surface as downward thermal radiation. The upward thermal radiation at the surface consists of thermal radiation emitted by the surface plus the fraction of downwards thermal radiation reflected upward by the surface. This parameter is accumulated over a particular time period which depends on the data extracted. For the reanalysis, the accumulation period is over the 1 hour ending at the validity date and time. For the ensemble members, ensemble mean and ensemble spread, the accumulation period is over the 3 hours ending at the validity date and time. The units are joules per square metre (J m^-2 ). To convert to watts per square metre (W m^-2 ), the accumulated values should be divided by the accumulation period expressed in seconds. The ECMWF convention for vertical fluxes is positive downwards. |
surface_sensible_heat_flux | ژول بر متر مربع | ۲۷۸۳۰ متر | This parameter is the transfer of heat between the Earth's surface and the atmosphere through the effects of turbulent air motion (but excluding any heat transfer resulting from condensation or evaporation). The magnitude of the sensible heat flux is governed by the difference in temperature between the surface and the overlying atmosphere, wind speed and the surface roughness. For example, cold air overlying a warm surface would produce a sensible heat flux from the land (or ocean) into the atmosphere. This parameter is accumulated over a particular time period which depends on the data extracted. For the reanalysis, the accumulation period is over the 1 hour ending at the validity date and time. For the ensemble members, ensemble mean and ensemble spread, the accumulation period is over the 3 hours ending at the validity date and time. The units are joules per square metre (J m^-2 ). To convert to watts per square metre (W m^-2 ), the accumulated values should be divided by the accumulation period expressed in seconds. The ECMWF convention for vertical fluxes is positive downwards. |
surface_solar_radiation_downward_clear_sky | ژول بر متر مربع | ۲۷۸۳۰ متر | This parameter is the amount of solar radiation (also known as shortwave radiation) that reaches a horizontal plane at the surface of the Earth, assuming clear-sky (cloudless) conditions. This parameter comprises both direct and diffuse solar radiation. Radiation from the Sun (solar, or shortwave, radiation) is partly reflected back to space by clouds and particles in the atmosphere (aerosols) and some of it is absorbed. The rest is incident on the Earth's surface. Clear-sky radiation quantities are computed for exactly the same atmospheric conditions of temperature, humidity, ozone, trace gases and aerosol as the corresponding total-sky quantities (clouds included), but assuming that the clouds are not there. This parameter is accumulated over a particular time period which depends on the data extracted. For the reanalysis, the accumulation period is over the 1 hour ending at the validity date and time. For the ensemble members, ensemble mean and ensemble spread, the accumulation period is over the 3 hours ending at the validity date and time. The units are joules per square metre (J m^-2 ). To convert to watts per square metre (W m^-2 ), the accumulated values should be divided by the accumulation period expressed in seconds. The ECMWF convention for vertical fluxes is positive downwards. |
surface_solar_radiation_downwards | ژول بر متر مربع | ۲۷۸۳۰ متر | This parameter is the amount of solar radiation (also known as shortwave radiation) that reaches a horizontal plane at the surface of the Earth. This parameter comprises both direct and diffuse solar radiation. Radiation from the Sun (solar, or shortwave, radiation) is partly reflected back to space by clouds and particles in the atmosphere (aerosols) and some of it is absorbed. The rest is incident on the Earth's surface (represented by this parameter). To a reasonably good approximation, this parameter is the model equivalent of what would be measured by a pyranometer (an instrument used for measuring solar radiation) at the surface. However, care should be taken when comparing model parameters with observations, because observations are often local to a particular point in space and time, rather than representing averages over a model grid box. This parameter is accumulated over a particular time period which depends on the data extracted. For the reanalysis, the accumulation period is over the 1 hour ending at the validity date and time. For the ensemble members, ensemble mean and ensemble spread, the accumulation period is over the 3 hours ending at the validity date and time. The units are joules per square metre (J m^-2 ). To convert to watts per square metre (W m^-2 ), the accumulated values should be divided by the accumulation period expressed in seconds. The ECMWF convention for vertical fluxes is positive downwards. |
surface_thermal_radiation_downward_clear_sky | ژول بر متر مربع | ۲۷۸۳۰ متر | This parameter is the amount of thermal (also known as longwave or terrestrial) radiation emitted by the atmosphere that reaches a horizontal plane at the surface of the Earth, assuming clear-sky (cloudless) conditions. The surface of the Earth emits thermal radiation, some of which is absorbed by the atmosphere and clouds. The atmosphere and clouds likewise emit thermal radiation in all directions, some of which reaches the surface. Clear-sky radiation quantities are computed for exactly the same atmospheric conditions of temperature, humidity, ozone, trace gases and aerosol as the corresponding total-sky quantities (clouds included), but assuming that the clouds are not there. This parameter is accumulated over a particular time period which depends on the data extracted. For the reanalysis, the accumulation period is over the 1 hour ending at the validity date and time. For the ensemble members, ensemble mean and ensemble spread, the accumulation period is over the 3 hours ending at the validity date and time. The units are joules per square metre (J m^-2 ). To convert to watts per square metre (W m^-2 ), the accumulated values should be divided by the accumulation period expressed in seconds. The ECMWF convention for vertical fluxes is positive downwards. |
surface_thermal_radiation_downwards | ژول بر متر مربع | ۲۷۸۳۰ متر | This parameter is the amount of thermal (also known as longwave or terrestrial) radiation emitted by the atmosphere and clouds that reaches a horizontal plane at the surface of the Earth. The surface of the Earth emits thermal radiation, some of which is absorbed by the atmosphere and clouds. The atmosphere and clouds likewise emit thermal radiation in all directions, some of which reaches the surface (represented by this parameter). This parameter is accumulated over a particular time period which depends on the data extracted. For the reanalysis, the accumulation period is over the 1 hour ending at the validity date and time. For the ensemble members, ensemble mean and ensemble spread, the accumulation period is over the 3 hours ending at the validity date and time. The units are joules per square metre (J m^-2 ). To convert to watts per square metre (W m^-2 ), the accumulated values should be divided by the accumulation period expressed in seconds. The ECMWF convention for vertical fluxes is positive downwards. |
toa_incident_solar_radiation | ژول بر متر مربع | ۲۷۸۳۰ متر | This parameter is the incoming solar radiation (also known as shortwave radiation), received from the Sun, at the top of the atmosphere. It is the amount of radiation passing through a horizontal plane. This parameter is accumulated over a particular time period which depends on the data extracted. For the reanalysis, the accumulation period is over the 1 hour ending at the validity date and time. For the ensemble members, ensemble mean and ensemble spread, the accumulation period is over the 3 hours ending at the validity date and time. The units are joules per square metre (J m^-2 ). To convert to watts per square metre (W m^-2 ), the accumulated values should be divided by the accumulation period expressed in seconds. The ECMWF convention for vertical fluxes is positive downwards. |
top_net_solar_radiation | ژول بر متر مربع | ۲۷۸۳۰ متر | This parameter is the incoming solar radiation (also known as shortwave radiation) minus the outgoing solar radiation at the top of the atmosphere. It is the amount of radiation passing through a horizontal plane. The incoming solar radiation is the amount received from the Sun. The outgoing solar radiation is the amount reflected and scattered by the Earth's atmosphere and surface. This parameter is accumulated over a particular time period which depends on the data extracted. For the reanalysis, the accumulation period is over the 1 hour ending at the validity date and time. For the ensemble members, ensemble mean and ensemble spread, the accumulation period is over the 3 hours ending at the validity date and time. The units are joules per square metre (J m^-2 ). To convert to watts per square metre (W m^-2 ), the accumulated values should be divided by the accumulation period expressed in seconds. The ECMWF convention for vertical fluxes is positive downwards. |
top_net_solar_radiation_clear_sky | ژول بر متر مربع | ۲۷۸۳۰ متر | This parameter is the incoming solar radiation (also known as shortwave radiation) minus the outgoing solar radiation at the top of the atmosphere, assuming clear-sky (cloudless) conditions. It is the amount of radiation passing through a horizontal plane. The incoming solar radiation is the amount received from the Sun. The outgoing solar radiation is the amount reflected and scattered by the Earth's atmosphere and surface, assuming clear-sky (cloudless) conditions. Clear-sky radiation quantities are computed for exactly the same atmospheric conditions of temperature, humidity, ozone, trace gases and aerosol as the total-sky (clouds included) quantities, but assuming that the clouds are not there. This parameter is accumulated over a particular time period which depends on the data extracted. For the reanalysis, the accumulation period is over the 1 hour ending at the validity date and time. For the ensemble members, ensemble mean and ensemble spread, the accumulation period is over the 3 hours ending at the validity date and time. The units are joules per square metre (J m^-2 ). To convert to watts per square metre (W m^-2 ), the accumulated values should be divided by the accumulation period expressed in seconds. The ECMWF convention for vertical fluxes is positive downwards. |
top_net_thermal_radiation | ژول بر متر مربع | ۲۷۸۳۰ متر | The thermal (also known as terrestrial or longwave) radiation emitted to space at the top of the atmosphere is commonly known as the Outgoing Longwave Radiation (OLR). The top net thermal radiation (this parameter) is equal to the negative of OLR. This parameter is accumulated over a particular time period which depends on the data extracted. For the reanalysis, the accumulation period is over the 1 hour ending at the validity date and time. For the ensemble members, ensemble mean and ensemble spread, the accumulation period is over the 3 hours ending at the validity date and time. The units are joules per square metre (J m^-2 ). To convert to watts per square metre (W m^-2 ), the accumulated values should be divided by the accumulation period expressed in seconds. The ECMWF convention for vertical fluxes is positive downwards. |
top_net_thermal_radiation_clear_sky | ژول بر متر مربع | ۲۷۸۳۰ متر | This parameter is the thermal (also known as terrestrial or longwave) radiation emitted to space at the top of the atmosphere, assuming clear-sky (cloudless) conditions. It is the amount passing through a horizontal plane. Note that the ECMWF convention for vertical fluxes is positive downwards, so a flux from the atmosphere to space will be negative. Clear-sky radiation quantities are computed for exactly the same atmospheric conditions of temperature, humidity, ozone, trace gases and aerosol as total-sky quantities (clouds included), but assuming that the clouds are not there. The thermal radiation emitted to space at the top of the atmosphere is commonly known as the Outgoing Longwave Radiation (OLR) (ie, taking a flux from the atmosphere to space as positive). Note that OLR is typically shown in units of watts per square metre (W m^-2 ). This parameter is accumulated over a particular time period which depends on the data extracted. For the reanalysis, the accumulation period is over the 1 hour ending at the validity date and time. For the ensemble members, ensemble mean and ensemble spread, the accumulation period is over the 3 hours ending at the validity date and time. The units are joules per square metre (J m^-2 ). To convert to watts per square metre (W m^-2 ), the accumulated values should be divided by the accumulation period expressed in seconds. |
total_sky_direct_solar_radiation_at_surface | ژول بر متر مربع | ۲۷۸۳۰ متر | This parameter is the amount of direct solar radiation (also known as shortwave radiation) reaching the surface of the Earth. It is the amount of radiation passing through a horizontal plane. Solar radiation at the surface can be direct or diffuse. Solar radiation can be scattered in all directions by particles in the atmosphere, some of which reaches the surface (diffuse solar radiation). Some solar radiation reaches the surface without being scattered (direct solar radiation). This parameter is accumulated over a particular time period which depends on the data extracted. For the reanalysis, the accumulation period is over the 1 hour ending at the validity date and time. For the ensemble members, ensemble mean and ensemble spread, the accumulation period is over the 3 hours ending at the validity date and time. The units are joules per square metre (J m^-2 ). To convert to watts per square metre (W m^-2 ), the accumulated values should be divided by the accumulation period expressed in seconds. The ECMWF convention for vertical fluxes is positive downwards. |
uv_visible_albedo_for_diffuse_radiation | بیبعد | ۲۷۸۳۰ متر | Albedo is a measure of the reflectivity of the Earth's surface. This parameter is the fraction of diffuse solar (shortwave) radiation with wavelengths between 0.3 and 0.7 µm (microns, 1 millionth of a metre) reflected by the Earth's surface (for snow-free land surfaces only). In the ECMWF Integrated Forecasting System (IFS) albedo is dealt with separately for solar radiation with wavelengths greater/less than 0.7µm and for direct and diffuse solar radiation (giving 4 components to albedo). Solar radiation at the surface can be direct or diffuse. Solar radiation can be scattered in all directions by particles in the atmosphere, some of which reaches the surface (diffuse solar radiation). Some solar radiation reaches the surface without being scattered (direct solar radiation). In the IFS, a climatological (observed values averaged over a period of several years) background albedo is used which varies from month to month through the year, modified by the model over water, ice and snow. This parameter varies between 0 and 1. |
uv_visible_albedo_for_direct_radiation | بیبعد | ۲۷۸۳۰ متر | Albedo is a measure of the reflectivity of the Earth's surface. This parameter is the fraction of direct solar (shortwave) radiation with wavelengths between 0.3 and 0.7 µm (microns, 1 millionth of a metre) reflected by the Earth's surface (for snow-free land surfaces only). In the ECMWF Integrated Forecasting System (IFS) albedo is dealt with separately for solar radiation with wavelengths greater/less than 0.7µm and for direct and diffuse solar radiation (giving 4 components to albedo). Solar radiation at the surface can be direct or diffuse. Solar radiation can be scattered in all directions by particles in the atmosphere, some of which reaches the surface (diffuse solar radiation). Some solar radiation reaches the surface without being scattered (direct solar radiation). In the IFS, a climatological (observed values averaged over a period of several years) background albedo is used which varies from month to month through the year, modified by the model over water, ice and snow. |
cloud_base_height | متر | ۲۷۸۳۰ متر | The height above the Earth's surface of the base of the lowest cloud layer, at the specified time. This parameter is calculated by searching from the second lowest model level upwards, to the height of the level where cloud fraction becomes greater than 1% and condensate content greater than 1.E-6 kg kg^-1. Fog (ie, cloud in the lowest model layer) is not considered when defining cloud base height. |
high_cloud_cover | بیبعد | ۲۷۸۳۰ متر | The proportion of a grid box covered by cloud occurring in the high levels of the troposphere. High cloud is a single level field calculated from cloud occurring on model levels with a pressure less than 0.45 times the surface pressure. So, if the surface pressure is 1000 hPa (hectopascal), high cloud would be calculated using levels with a pressure of less than 450 hPa (approximately 6km and above (assuming a "standard atmosphere")). The high cloud cover parameter is calculated from cloud for the appropriate model levels as described above. Assumptions are made about the degree of overlap/randomness between clouds in different model levels. Cloud fractions vary from 0 to 1. |
low_cloud_cover | بیبعد | ۲۷۸۳۰ متر | This parameter is the proportion of a grid box covered by cloud occurring in the lower levels of the troposphere. Low cloud is a single level field calculated from cloud occurring on model levels with a pressure greater than 0.8 times the surface pressure. So, if the surface pressure is 1000 hPa (hectopascal), low cloud would be calculated using levels with a pressure greater than 800 hPa (below approximately 2km (assuming a "standard atmosphere")). Assumptions are made about the degree of overlap/randomness between clouds in different model levels. This parameter has values from 0 to 1. |
medium_cloud_cover | بیبعد | ۲۷۸۳۰ متر | This parameter is the proportion of a grid box covered by cloud occurring in the middle levels of the troposphere. Medium cloud is a single level field calculated from cloud occurring on model levels with a pressure between 0.45 and 0.8 times the surface pressure. So, if the surface pressure is 1000 hPa (hectopascal), medium cloud would be calculated using levels with a pressure of less than or equal to 800 hPa and greater than or equal to 450 hPa (between approximately 2km and 6km (assuming a "standard atmosphere")). The medium cloud parameter is calculated from cloud cover for the appropriate model levels as described above. Assumptions are made about the degree of overlap/randomness between clouds in different model levels. Cloud fractions vary from 0 to 1. |
total_cloud_cover | بیبعد | ۲۷۸۳۰ متر | This parameter is the proportion of a grid box covered by cloud. Total cloud cover is a single level field calculated from the cloud occurring at different model levels through the atmosphere. Assumptions are made about the degree of overlap/randomness between clouds at different heights. Cloud fractions vary from 0 to 1. |
total_column_cloud_ice_water | کیلوگرم بر متر مربع | ۲۷۸۳۰ متر | This parameter is the amount of ice contained within clouds in a column extending from the surface of the Earth to the top of the atmosphere. Snow (aggregated ice crystals) is not included in this parameter. This parameter represents the area averaged value for a model grid box. Clouds contain a continuum of different sized water droplets and ice particles. The ECMWF Integrated Forecasting System (IFS) cloud scheme simplifies this to represent a number of discrete cloud droplets/particles including: cloud water droplets, raindrops, ice crystals and snow (aggregated ice crystals). The processes of droplet formation, phase transition and aggregation are also highly simplified in the IFS. |
total_column_cloud_liquid_water | کیلوگرم بر متر مربع | ۲۷۸۳۰ متر | This parameter is the amount of liquid water contained within cloud droplets in a column extending from the surface of the Earth to the top of the atmosphere. Rain water droplets, which are much larger in size (and mass), are not included in this parameter. This parameter represents the area averaged value for a model grid box. Clouds contain a continuum of different sized water droplets and ice particles. The ECMWF Integrated Forecasting System (IFS) cloud scheme simplifies this to represent a number of discrete cloud droplets/particles including: cloud water droplets, raindrops, ice crystals and snow (aggregated ice crystals). The processes of droplet formation, phase transition and aggregation are also highly simplified in the IFS. |
lake_bottom_temperature | ک | ۲۷۸۳۰ متر | This parameter is the temperature of water at the bottom of inland water bodies (lakes, reservoirs, rivers and coastal waters). This parameter is defined over the whole globe, even where there is no inland water. Regions without inland water can be masked out by only considering grid points where the lake cover is greater than 0.0. In May 2015, a lake model was implemented in the ECMWF Integrated Forecasting System (IFS) to represent the water temperature and lake ice of all the world's major inland water bodies. Lake depth and area fraction (cover) are kept constant in time. |
lake_cover | بیبعد | ۲۷۸۳۰ متر | This parameter is the proportion of a grid box covered by inland water bodies (lakes, reservoirs, rivers and coastal waters). Values vary between 0: no inland water, and 1: grid box is fully covered with inland water. This parameter is specified from observations and does not vary in time. In May 2015, a lake model was implemented in the ECMWF Integrated Forecasting System (IFS) to represent the water temperature and lake ice of all the world's major inland water bodies. |
lake_depth | متر | ۲۷۸۳۰ متر | This parameter is the mean depth of inland water bodies (lakes, reservoirs, rivers and coastal waters). This parameter is specified from in-situ measurements and indirect estimates and does not vary in time. This parameter is defined over the whole globe, even where there is no inland water. Regions without inland water can be masked out by only considering grid points where the lake cover is greater than 0.0. In May 2015, a lake model was implemented in the ECMWF Integrated Forecasting System (IFS) to represent the water temperature and lake ice of all the world's major inland water bodies. |
lake_ice_depth | متر | ۲۷۸۳۰ متر | This parameter is the thickness of ice on inland water bodies (lakes, reservoirs, rivers and coastal waters). This parameter is defined over the whole globe, even where there is no inland water. Regions without inland water can be masked out by only considering grid points where the lake cover is greater than 0.0. In May 2015, a lake model was implemented in the ECMWF Integrated Forecasting System (IFS) to represent the water temperature and lake ice of all the world's major inland water bodies. Lake depth and area fraction (cover) are kept constant in time. A single ice layer is used to represent the formation and melting of ice on inland water bodies. This parameter is the thickness of that ice layer. |
lake_ice_temperature | ک | ۲۷۸۳۰ متر | This parameter is the temperature of the uppermost surface of ice on inland water bodies (lakes, reservoirs, rivers and coastal waters). It is the temperature at the ice/atmosphere or ice/snow interface. This parameter is defined over the whole globe, even where there is no inland water. Regions without inland water can be masked out by only considering grid points where the lake cover is greater than 0.0. In May 2015, a lake model was implemented in the ECMWF Integrated Forecasting System (IFS) to represent the water temperature and lake ice of all the world's major inland water bodies. Lake depth and area fraction (cover) are kept constant in time. A single ice layer is used to represent the formation and melting of ice on inland water bodies. |
lake_mix_layer_depth | متر | ۲۷۸۳۰ متر | This parameter is the thickness of the uppermost layer of inland water bodies (lakes, reservoirs, rivers and coastal waters) that is well mixed and has a near constant temperature with depth (ie, a uniform distribution of temperature with depth). Mixing can occur when the density of the surface (and near-surface) water is greater than that of the water below. Mixing can also occur through the action of wind on the surface of the water. This parameter is defined over the whole globe, even where there is no inland water. Regions without inland water can be masked out by only considering grid points where the lake cover is greater than 0.0. In May 2015, a lake model was implemented in the ECMWF Integrated Forecasting System (IFS) to represent the water temperature and lake ice of all the world's major inland water bodies. Lake depth and area fraction (cover) are kept constant in time. Inland water bodies are represented with two layers in the vertical, the mixed layer above and the thermocline below, where temperature changes with depth. The upper boundary of the thermocline is located at the mixed layer bottom, and the lower boundary of the thermocline at the lake bottom. A single ice layer is used to represent the formation and melting of ice on inland water bodies. |
lake_mix_layer_temperature | ک | ۲۷۸۳۰ متر | This parameter is the temperature of the uppermost layer of inland water bodies (lakes, reservoirs, rivers and coastal waters) that is well mixed and has a near constant temperature with depth (ie, a uniform distribution of temperature with depth). Mixing can occur when the density of the surface (and near-surface) water is greater than that of the water below. Mixing can also occur through the action of wind on the surface of the water. This parameter is defined over the whole globe, even where there is no inland water. Regions without inland water can be masked out by only considering grid points where the lake cover is greater than 0.0. In May 2015, a lake model was implemented in the ECMWF Integrated Forecasting System (IFS) to represent the water temperature and lake ice of all the world's major inland water bodies. Lake depth and area fraction (cover) are kept constant in time. Inland water bodies are represented with two layers in the vertical, the mixed layer above and the thermocline below, where temperature changes with depth. The upper boundary of the thermocline is located at the mixed layer bottom, and the lower boundary of the thermocline at the lake bottom. A single ice layer is used to represent the formation and melting of ice on inland water bodies. |
lake_shape_factor | بیبعد | ۲۷۸۳۰ متر | This parameter describes the way that temperature changes with depth in the thermocline layer of inland water bodies (lakes, reservoirs, rivers and coastal waters) ie, it describes the shape of the vertical temperature profile. It is used to calculate the lake bottom temperature and other lake-related parameters. This parameter is defined over the whole globe, even where there is no inland water. Regions without inland water can be masked out by only considering grid points where the lake cover is greater than 0.0. In May 2015, a lake model was implemented in the ECMWF Integrated Forecasting System (IFS) to represent the water temperature and lake ice of all the world's major inland water bodies. Lake depth and area fraction (cover) are kept constant in time. Inland water bodies are represented with two layers in the vertical, the mixed layer above and the thermocline below, where temperature changes with depth. The upper boundary of the thermocline is located at the mixed layer bottom, and the lower boundary of the thermocline at the lake bottom. A single ice layer is used to represent the formation and melting of ice on inland water bodies. |
lake_total_layer_temperature | ک | ۲۷۸۳۰ متر | This parameter is the mean temperature of the total water column in inland water bodies (lakes, reservoirs, rivers and coastal waters). This parameter is defined over the whole globe, even where there is no inland water. Regions without inland water can be masked out by only considering grid points where the lake cover is greater than 0.0. In May 2015, a lake model was implemented in the ECMWF Integrated Forecasting System (IFS) to represent the water temperature and lake ice of all the world's major inland water bodies. Lake depth and area fraction (cover) are kept constant in time. Inland water bodies are represented with two layers in the vertical, the mixed layer above and the thermocline below, where temperature changes with depth. This parameter is the mean temperature over the two layers. The upper boundary of the thermocline is located at the mixed layer bottom, and the lower boundary of the thermocline at the lake bottom. A single ice layer is used to represent the formation and melting of ice on inland water bodies. |
evaporation | متر | ۲۷۸۳۰ متر | This parameter is the accumulated amount of water that has evaporated from the Earth's surface, including a simplified representation of transpiration (from vegetation), into vapour in the air above. This parameter is accumulated over a particular time period which depends on the data extracted. For the reanalysis, the accumulation period is over the 1 hour ending at the validity date and time. For the ensemble members, ensemble mean and ensemble spread, the accumulation period is over the 3 hours ending at the validity date and time. The ECMWF Integrated Forecasting System (IFS) convention is that downward fluxes are positive. Therefore, negative values indicate evaporation and positive values indicate condensation. |
potential_evaporation | متر | ۲۷۸۳۰ متر | This parameter is a measure of the extent to which near-surface atmospheric conditions are conducive to the process of evaporation. It is usually considered to be the amount of evaporation, under existing atmospheric conditions, from a surface of pure water which has the temperature of the lowest layer of the atmosphere and gives an indication of the maximum possible evaporation. Potential evaporation in the current ECMWF Integrated Forecasting System (IFS) is based on surface energy balance calculations with the vegetation parameters set to "crops/mixed farming" and assuming "no stress from soil moisture". In other words, evaporation is computed for agricultural land as if it is well watered and assuming that the atmosphere is not affected by this artificial surface condition. The latter may not always be realistic. Although potential evaporation is meant to provide an estimate of irrigation requirements, the method can give unrealistic results in arid conditions due to too strong evaporation forced by dry air. This parameter is accumulated over a particular time period which depends on the data extracted. For the reanalysis, the accumulation period is over the 1 hour ending at the validity date and time. For the ensemble members, ensemble mean and ensemble spread, the accumulation period is over the 3 hours ending at the validity date and time. |
runoff | متر | ۲۷۸۳۰ متر | Some water from rainfall, melting snow, or deep in the soil, stays stored in the soil. Otherwise, the water drains away, either over the surface (surface runoff), or under the ground (sub-surface runoff) and the sum of these two is called runoff. This parameter is accumulated over a particular time period which depends on the data extracted. For the reanalysis, the accumulation period is over the 1 hour ending at the validity date and time. For the ensemble members, ensemble mean and ensemble spread, the accumulation period is over the 3 hours ending at the validity date and time. The units of runoff are depth in metres of water. This is the depth the water would have if it were spread evenly over the grid box. Care should be taken when comparing model parameters with observations, because observations are often local to a particular point rather than averaged over a grid box. Observations are also often taken in different units, such as mm/day, rather than the accumulated metres produced here. Runoff is a measure of the availability of water in the soil, and can, for example, be used as an indicator of drought or flood. |
sub_surface_runoff | متر | ۲۷۸۳۰ متر | Some water from rainfall, melting snow, or deep in the soil, stays stored in the soil. Otherwise, the water drains away, either over the surface (surface runoff), or under the ground (sub-surface runoff) and the sum of these two is called runoff. This parameter is accumulated over a particular time period which depends on the data extracted. For the reanalysis, the accumulation period is over the 1 hour ending at the validity date and time. For the ensemble members, ensemble mean and ensemble spread, the accumulation period is over the 3 hours ending at the validity date and time. The units of runoff are depth in metres of water. This is the depth the water would have if it were spread evenly over the grid box. Care should be taken when comparing model parameters with observations, because observations are often local to a particular point rather than averaged over a grid box. Observations are also often taken in different units, such as mm/day, rather than the accumulated metres produced here. Runoff is a measure of the availability of water in the soil, and can, for example, be used as an indicator of drought or flood. |
surface_runoff | متر | ۲۷۸۳۰ متر | Some water from rainfall, melting snow, or deep in the soil, stays stored in the soil. Otherwise, the water drains away, either over the surface (surface runoff), or under the ground (sub-surface runoff) and the sum of these two is called runoff. This parameter is accumulated over a particular time period which depends on the data extracted. For the reanalysis, the accumulation period is over the 1 hour ending at the validity date and time. For the ensemble members, ensemble mean and ensemble spread, the accumulation period is over the 3 hours ending at the validity date and time. The units of runoff are depth in metres of water. This is the depth the water would have if it were spread evenly over the grid box. Care should be taken when comparing model parameters with observations, because observations are often local to a particular point rather than averaged over a grid box. Observations are also often taken in different units, such as mm/day, rather than the accumulated metres produced here. Runoff is a measure of the availability of water in the soil, and can, for example, be used as an indicator of drought or flood. |
convective_precipitation | متر | ۲۷۸۳۰ متر | This parameter is the accumulated precipitation that falls to the Earth's surface, which is generated by the convection scheme in the ECMWF Integrated Forecasting System (IFS). The convection scheme represents convection at spatial scales smaller than the grid box. Precipitation can also be generated by the cloud scheme in the IFS, which represents the formation and dissipation of clouds and large-scale precipitation due to changes in atmospheric quantities (such as pressure, temperature and moisture) predicted directly at spatial scales of the grid box or larger. In the IFS, precipitation is comprised of rain and snow. In the IFS, precipitation is comprised of rain and snow. This parameter is accumulated over a particular time period which depends on the data extracted. For the reanalysis, the accumulation period is over the 1 hour ending at the validity date and time. For the ensemble members, ensemble mean and ensemble spread, the accumulation period is over the 3 hours ending at the validity date and time. The units of this parameter are depth in metres of water equivalent. It is the depth the water would have if it were spread evenly over the grid box. Care should be taken when comparing model parameters with observations, because observations are often local to a particular point in space and time, rather than representing averages over a model grid box. |
convective_rain_rate | کیلوگرم بر متر مربع بر ثانیه | ۲۷۸۳۰ متر | This parameter is the rate of rainfall (rainfall intensity), at the Earth's surface and at the specified time, which is generated by the convection scheme in the ECMWF Integrated Forecasting System (IFS). The convection scheme represents convection at spatial scales smaller than the grid box. Rainfall can also be generated by the cloud scheme in the IFS, which represents the formation and dissipation of clouds and large-scale precipitation due to changes in atmospheric quantities (such as pressure, temperature and moisture) predicted directly at spatial scales of the grid box or larger. In the IFS, precipitation is comprised of rain and snow. This parameter is the rate the rainfall would have if it were spread evenly over the grid box. 1 kg of water spread over 1 square metre of surface is 1 mm deep (neglecting the effects of temperature on the density of water), therefore the units are equivalent to mm per second. Care should be taken when comparing model parameters with observations, because observations are often local to a particular point in space and time, rather than representing averages over a model grid box. |
instantaneous_large_scale_surface_precipitation_fraction | بیبعد | ۲۷۸۳۰ متر | This parameter is the fraction of the grid box (0-1) covered by large-scale precipitation at the specified time. Large-scale precipitation is rain and snow that falls to the Earth's surface, and is generated by the cloud scheme in the ECMWF Integrated Forecasting System (IFS). The cloud scheme represents the formation and dissipation of clouds and large-scale precipitation due to changes in atmospheric quantities (such as pressure, temperature and moisture) predicted directly by the IFS at spatial scales of a grid box or larger. Precipitation can also be due to convection generated by the convection scheme in the IFS. The convection scheme represents convection at spatial scales smaller than the grid box. |
large_scale_precipitation | متر | ۲۷۸۳۰ متر | This parameter is the accumulated precipitation that falls to the Earth's surface, which is generated by the cloud scheme in the ECMWF Integrated Forecasting System (IFS). The cloud scheme represents the formation and dissipation of clouds and large-scale precipitation due to changes in atmospheric quantities (such as pressure, temperature and moisture) predicted directly at spatial scales of the grid box or larger. Precipitation can also be generated by the convection scheme in the IFS, which represents convection at spatial scales smaller than the grid box. In the IFS, precipitation is comprised of rain and snow. This parameter is accumulated over a particular time period which depends on the data extracted. For the reanalysis, the accumulation period is over the 1 hour ending at the validity date and time. For the ensemble members, ensemble mean and ensemble spread, the accumulation period is over the 3 hours ending at the validity date and time. The units of this parameter are depth in metres of water equivalent. It is the depth the water would have if it were spread evenly over the grid box. Care should be taken when comparing model parameters with observations, because observations are often local to a particular point in space and time, rather than representing averages over a model grid box. |
large_scale_precipitation_fraction | ثانیهها | ۲۷۸۳۰ متر | This parameter is the accumulation of the fraction of the grid box (0-1) that is covered by large-scale precipitation. This parameter is accumulated over a particular time period which depends on the data extracted. For the reanalysis, the accumulation period is over the 1 hour ending at the validity date and time. For the ensemble members, ensemble mean and ensemble spread, the accumulation period is over the 3 hours ending at the validity date and time. |
large_scale_rain_rate | کیلوگرم بر متر مربع بر ثانیه | ۲۷۸۳۰ متر | This parameter is the rate of rainfall (rainfall intensity), at the Earth's surface and at the specified time, which is generated by the cloud scheme in the ECMWF Integrated Forecasting System (IFS). The cloud scheme represents the formation and dissipation of clouds and large-scale precipitation due to changes in atmospheric quantities (such as pressure, temperature and moisture) predicted directly at spatial scales of the grid box or larger. Rainfall can also be generated by the convection scheme in the IFS, which represents convection at spatial scales smaller than the grid box. In the IFS, precipitation is comprised of rain and snow. This parameter is the rate the rainfall would have if it were spread evenly over the grid box. Since 1 kg of water spread over 1 square metre of surface is 1 mm deep (neglecting the effects of temperature on the density of water), the units are equivalent to mm per second. Care should be taken when comparing model parameters with observations, because observations are often local to a particular point in space and time, rather than representing averages over a model grid box. |
precipitation_type | بیبعد | ۲۷۸۳۰ متر | This parameter describes the type of precipitation at the surface, at the specified time. A precipitation type is assigned wherever there is a non-zero value of precipitation. In the ECMWF Integrated Forecasting System (IFS) there are only two predicted precipitation variables: rain and snow. Precipitation type is derived from these two predicted variables in combination with atmospheric conditions, such as temperature. Values of precipitation type defined in the IFS: 0: No precipitation, 1: Rain, 3: Freezing rain (ie supercooled raindrops which freeze on contact with the ground and other surfaces), 5: Snow, 6: Wet snow (ie snow particles which are starting to melt); 7: Mixture of rain and snow, 8: Ice pellets. These precipitation types are consistent with WMO Code Table 4.201. Other types in this WMO table are not defined in the IFS. |
total_column_rain_water | کیلوگرم بر متر مربع | ۲۷۸۳۰ متر | This parameter is the total amount of water in droplets of raindrop size (which can fall to the surface as precipitation) in a column extending from the surface of the Earth to the top of the atmosphere. This parameter represents the area averaged value for a grid box. Clouds contain a continuum of different sized water droplets and ice particles. The ECMWF Integrated Forecasting System (IFS) cloud scheme simplifies this to represent a number of discrete cloud droplets/particles including: cloud water droplets, raindrops, ice crystals and snow (aggregated ice crystals). The processes of droplet formation, conversion and aggregation are also highly simplified in the IFS. |
total_precipitation | متر | ۲۷۸۳۰ متر | This parameter is the accumulated liquid and frozen water, comprising rain and snow, that falls to the Earth's surface. It is the sum of large-scale precipitation and convective precipitation. Large-scale precipitation is generated by the cloud scheme in the ECMWF Integrated Forecasting System (IFS). The cloud scheme represents the formation and dissipation of clouds and large-scale precipitation due to changes in atmospheric quantities (such as pressure, temperature and moisture) predicted directly by the IFS at spatial scales of the grid box or larger. Convective precipitation is generated by the convection scheme in the IFS, which represents convection at spatial scales smaller than the grid box. This parameter does not include fog, dew or the precipitation that evaporates in the atmosphere before it lands at the surface of the Earth. This parameter is accumulated over a particular time period which depends on the data extracted. For the reanalysis, the accumulation period is over the 1 hour ending at the validity date and time. For the ensemble members, ensemble mean and ensemble spread, the accumulation period is over the 3 hours ending at the validity date and time. The units of this parameter are depth in metres of water equivalent. It is the depth the water would have if it were spread evenly over the grid box. Care should be taken when comparing model parameters with observations, because observations are often local to a particular point in space and time, rather than representing averages over a model grid box. |
convective_snowfall | متر | ۲۷۸۳۰ متر | This parameter is the accumulated snow that falls to the Earth's surface, which is generated by the convection scheme in the ECMWF Integrated Forecasting System (IFS). The convection scheme represents convection at spatial scales smaller than the grid box. Snowfall can also be generated by the cloud scheme in the IFS, which represents the formation and dissipation of clouds and large-scale precipitation due to changes in atmospheric quantities (such as pressure, temperature and moisture) predicted directly at spatial scales of the grid box or larger. In the IFS, precipitation is comprised of rain and snow. This parameter is accumulated over a particular time period which depends on the data extracted. For the reanalysis, the accumulation period is over the 1 hour ending at the validity date and time. For the ensemble members, ensemble mean and ensemble spread, the accumulation period is over the 3 hours ending at the validity date and time. The units of this parameter are depth in metres of water equivalent. It is the depth the water would have if it were spread evenly over the grid box. Care should be taken when comparing model parameters with observations, because observations are often local to a particular point in space and time, rather than representing averages over a model grid box. |
convective_snowfall_rate_water_equivalent | کیلوگرم بر متر مربع بر ثانیه | ۲۷۸۳۰ متر | This parameter is the rate of snowfall (snowfall intensity), at the Earth's surface and at the specified time, which is generated by the convection scheme in the ECMWF Integrated Forecasting System (IFS). The convection scheme represents convection at spatial scales smaller than the grid box. Snowfall can also be generated by the cloud scheme in the IFS, which represents the formation and dissipation of clouds and large-scale precipitation due to changes in atmospheric quantities (such as pressure, temperature and moisture) predicted directly at spatial scales of the grid box or larger. In the IFS, precipitation is comprised of rain and snow. This parameter is the rate the snowfall would have if it were spread evenly over the grid box. Since 1 kg of water spread over 1 square metre of surface is 1 mm thick (neglecting the effects of temperature on the density of water), the units are equivalent to mm (of liquid water) per second. Care should be taken when comparing model parameters with observations, because observations are often local to a particular point in space and time, rather than representing averages over a model grid box. |
large_scale_snowfall | متر | ۲۷۸۳۰ متر | This parameter is the accumulated snow that falls to the Earth's surface, which is generated by the cloud scheme in the ECMWF Integrated Forecasting System (IFS). The cloud scheme represents the formation and dissipation of clouds and large-scale precipitation due to changes in atmospheric quantities (such as pressure, temperature and moisture) predicted directly at spatial scales of the grid box or larger. Snowfall can also be generated by the convection scheme in the IFS, which represents convection at spatial scales smaller than the grid box. In the IFS, precipitation is comprised of rain and snow. This parameter is accumulated over a particular time period which depends on the data extracted. For the reanalysis, the accumulation period is over the 1 hour ending at the validity date and time. For the ensemble members, ensemble mean and ensemble spread, the accumulation period is over the 3 hours ending at the validity date and time. The units of this parameter are depth in metres of water equivalent. It is the depth the water would have if it were spread evenly over the grid box. Care should be taken when comparing model parameters with observations, because observations are often local to a particular point in space and time, rather than representing averages over a model grid box. |
large_scale_snowfall_rate_water_equivalent | کیلوگرم بر متر مربع بر ثانیه | ۲۷۸۳۰ متر | This parameter is the rate of snowfall (snowfall intensity), at the Earth's surface and at the specified time, which is generated by the cloud scheme in the ECMWF Integrated Forecasting System (IFS). The cloud scheme represents the formation and dissipation of clouds and large-scale precipitation due to changes in atmospheric quantities (such as pressure, temperature and moisture) predicted directly at spatial scales of the grid box or larger. Snowfall can also be generated by the convection scheme in the IFS, which represents convection at spatial scales smaller than the grid box. In the IFS, precipitation is comprised of rain and snow. This parameter is the rate the snowfall would have if it were spread evenly over the grid box. Since 1 kg of water spread over 1 square metre of surface is 1 mm deep (neglecting the effects of temperature on the density of water), the units are equivalent to mm (of liquid water) per second. Care should be taken when comparing model parameters with observations, because observations are often local to a particular point in space and time, rather than representing averages over a model grid box. |
snow_albedo | بیبعد | ۲۷۸۳۰ متر | This parameter is a measure of the reflectivity of the snow-covered part of the grid box. It is the fraction of solar (shortwave) radiation reflected by snow across the solar spectrum. The ECMWF Integrated Forecasting System (IFS) represents snow as a single additional layer over the uppermost soil level. The snow may cover all or part of the grid box. This parameter changes with snow age and also depends on vegetation height. It has a range of values between 0 and 1. For low vegetation, it ranges between 0.52 for old snow and 0.88 for fresh snow. For high vegetation with snow underneath, it depends on vegetation type and has values between 0.27 and 0.38. This parameter is defined over the whole globe, even where there is no snow. Regions without snow can be masked out by only considering grid points where the snow depth (m of water equivalent) is greater than 0.0. |
snow_density | کیلوگرم بر متر مکعب | ۲۷۸۳۰ متر | This parameter is the mass of snow per cubic metre in the snow layer. The ECMWF Integrated Forecasting System (IFS) represents snow as a single additional layer over the uppermost soil level. The snow may cover all or part of the grid box. This parameter is defined over the whole globe, even where there is no snow. Regions without snow can be masked out by only considering grid points where the snow depth (m of water equivalent) is greater than 0.0. |
snow_depth | متر | ۲۷۸۳۰ متر | This parameter is the amount of snow from the snow-covered area of a grid box. Its units are metres of water equivalent, so it is the depth the water would have if the snow melted and was spread evenly over the whole grid box. The ECMWF Integrated Forecasting System (IFS) represents snow as a single additional layer over the uppermost soil level. The snow may cover all or part of the grid box. |
snow_evaporation | متر | ۲۷۸۳۰ متر | This parameter is the accumulated amount of water that has evaporated from snow from the snow-covered area of a grid box into vapour in the air above. The ECMWF Integrated Forecasting System (IFS) represents snow as a single additional layer over the uppermost soil level. The snow may cover all or part of the grid box. This parameter is the depth of water there would be if the evaporated snow (from the snow-covered area of a grid box) were liquid and were spread evenly over the whole grid box. This parameter is accumulated over a particular time period which depends on the data extracted. For the reanalysis, the accumulation period is over the 1 hour ending at the validity date and time. For the ensemble members, ensemble mean and ensemble spread, the accumulation period is over the 3 hours ending at the validity date and time. The IFS convention is that downward fluxes are positive. Therefore, negative values indicate evaporation and positive values indicate deposition. |
snowfall | متر | ۲۷۸۳۰ متر | This parameter is the accumulated snow that falls to the Earth's surface. It is the sum of large-scale snowfall and convective snowfall. Large-scale snowfall is generated by the cloud scheme in the ECMWF Integrated Forecasting System (IFS). The cloud scheme represents the formation and dissipation of clouds and large-scale precipitation due to changes in atmospheric quantities (such as pressure, temperature and moisture) predicted directly at spatial scales of the grid box or larger. Convective snowfall is generated by the convection scheme in the IFS, which represents convection at spatial scales smaller than the grid box. In the IFS, precipitation is comprised of rain and snow. This parameter is accumulated over a particular time period which depends on the data extracted. For the reanalysis, the accumulation period is over the 1 hour ending at the validity date and time. For the ensemble members, ensemble mean and ensemble spread, the accumulation period is over the 3 hours ending at the validity date and time. The units of this parameter are depth in metres of water equivalent. It is the depth the water would have if it were spread evenly over the grid box. Care should be taken when comparing model parameters with observations, because observations are often local to a particular point in space and time, rather than representing averages over a model grid box. |
snowmelt | متر | ۲۷۸۳۰ متر | This parameter is the accumulated amount of water that has melted from snow in the snow-covered area of a grid box. The ECMWF Integrated Forecasting System (IFS) represents snow as a single additional layer over the uppermost soil level. The snow may cover all or part of the grid box. This parameter is the depth of water there would be if the melted snow (from the snow-covered area of a grid box) were spread evenly over the whole grid box. For example, if half the grid box were covered in snow with a water equivalent depth of 0.02m, this parameter would have a value of 0.01m. This parameter is accumulated over a particular time period which depends on the data extracted. For the reanalysis, the accumulation period is over the 1 hour ending at the validity date and time. For the ensemble members, ensemble mean and ensemble spread, the accumulation period is over the 3 hours ending at the validity date and time. |
temperature_of_snow_layer | ک | ۲۷۸۳۰ متر | This parameter gives the temperature of the snow layer from the ground to the snow-air interface. The ECMWF Integrated Forecasting System (IFS) represents snow as a single additional layer over the uppermost soil level. The snow may cover all or part of the grid box. This parameter is defined over the whole globe, even where there is no snow. Regions without snow can be masked out by only considering grid points where the snow depth (m of water equivalent) is greater than 0.0. |
total_column_snow_water | کیلوگرم بر متر مربع | ۲۷۸۳۰ متر | This parameter is the total amount of water in the form of snow (aggregated ice crystals which can fall to the surface as precipitation) in a column extending from the surface of the Earth to the top of the atmosphere. This parameter represents the area averaged value for a grid box. Clouds contain a continuum of different sized water droplets and ice particles. The ECMWF Integrated Forecasting System (IFS) cloud scheme simplifies this to represent a number of discrete cloud droplets/particles including: cloud water droplets, raindrops, ice crystals and snow (aggregated ice crystals). The processes of droplet formation, conversion and aggregation are also highly simplified in the IFS. |
soil_temperature_level_1 | ک | ۲۷۸۳۰ متر | This parameter is the temperature of the soil at level 1 (in the middle of layer 1). The ECMWF Integrated Forecasting System (IFS) has a four-layer representation of soil, where the surface is at 0cm: Layer 1: 0 - 7cm, Layer 2: 7 - 28cm, Layer 3: 28 - 100cm, Layer 4: 100 - 289cm. Soil temperature is set at the middle of each layer, and heat transfer is calculated at the interfaces between them. It is assumed that there is no heat transfer out of the bottom of the lowest layer. Soil temperature is defined over the whole globe, even over ocean. Regions with a water surface can be masked out by only considering grid points where the land-sea mask has a value greater than 0.5. |
soil_temperature_level_2 | ک | ۲۷۸۳۰ متر | This parameter is the temperature of the soil at level 2 (in the middle of layer 2). The ECMWF Integrated Forecasting System (IFS) has a four-layer representation of soil, where the surface is at 0cm: Layer 1: 0 - 7cm, Layer 2: 7 - 28cm, Layer 3: 28 - 100cm, Layer 4: 100 - 289cm. Soil temperature is set at the middle of each layer, and heat transfer is calculated at the interfaces between them. It is assumed that there is no heat transfer out of the bottom of the lowest layer. Soil temperature is defined over the whole globe, even over ocean. Regions with a water surface can be masked out by only considering grid points where the land-sea mask has a value greater than 0.5. |
soil_temperature_level_3 | ک | ۲۷۸۳۰ متر | This parameter is the temperature of the soil at level 3 (in the middle of layer 3). The ECMWF Integrated Forecasting System (IFS) has a four-layer representation of soil, where the surface is at 0cm: Layer 1: 0 - 7cm, Layer 2: 7 - 28cm, Layer 3: 28 - 100cm, Layer 4: 100 - 289cm. Soil temperature is set at the middle of each layer, and heat transfer is calculated at the interfaces between them. It is assumed that there is no heat transfer out of the bottom of the lowest layer. Soil temperature is defined over the whole globe, even over ocean. Regions with a water surface can be masked out by only considering grid points where the land-sea mask has a value greater than 0.5. |
soil_temperature_level_4 | ک | ۲۷۸۳۰ متر | This parameter is the temperature of the soil at level 4 (in the middle of layer 4). The ECMWF Integrated Forecasting System (IFS) has a four-layer representation of soil, where the surface is at 0cm: Layer 1: 0 - 7cm, Layer 2: 7 - 28cm, Layer 3: 28 - 100cm, Layer 4: 100 - 289cm. Soil temperature is set at the middle of each layer, and heat transfer is calculated at the interfaces between them. It is assumed that there is no heat transfer out of the bottom of the lowest layer. Soil temperature is defined over the whole globe, even over ocean. Regions with a water surface can be masked out by only considering grid points where the land-sea mask has a value greater than 0.5. |
soil_type | بیبعد | ۲۷۸۳۰ متر | This parameter is the texture (or classification) of soil used by the land surface scheme of the ECMWF Integrated Forecasting System (IFS) to predict the water holding capacity of soil in soil moisture and runoff calculations. It is derived from the root zone data (30-100 cm below the surface) of the FAO/UNESCO Digital Soil Map of the World, DSMW (FAO, 2003), which exists at a resolution of 5' X 5' (about 10 km). The seven soil types are: 1: Coarse, 2: Medium, 3: Medium fine, 4: Fine, 5: Very fine, 6: Organic, 7: Tropical organic. A value of 0 indicates a non-land point. This parameter does not vary in time. |
vertical_integral_of_divergence_of_cloud_frozen_water_flux | کیلوگرم بر متر مربع بر ثانیه | ۲۷۸۳۰ متر | The vertical integral of the cloud frozen water flux is the horizontal rate of flow of cloud frozen water, per metre across the flow, for a column of air extending from the surface of the Earth to the top of the atmosphere. Its horizontal divergence is the rate of cloud frozen water spreading outward from a point, per square metre. This parameter is positive for cloud frozen water that is spreading out, or diverging, and negative for the opposite, for cloud frozen water that is concentrating, or converging (convergence). This parameter thus indicates whether atmospheric motions act to decrease (for divergence) or increase (for convergence) the vertical integral of cloud frozen water. Note that "cloud frozen water" is the same as "cloud ice water". |
vertical_integral_of_divergence_of_cloud_liquid_water_flux | کیلوگرم بر متر مربع بر ثانیه | ۲۷۸۳۰ متر | The vertical integral of the cloud liquid water flux is the horizontal rate of flow of cloud liquid water, per metre across the flow, for a column of air extending from the surface of the Earth to the top of the atmosphere. Its horizontal divergence is the rate of cloud liquid water spreading outward from a point, per square metre. This parameter is positive for cloud liquid water that is spreading out, or diverging, and negative for the opposite, for cloud liquid water that is concentrating, or converging (convergence). This parameter thus indicates whether atmospheric motions act to decrease (for divergence) or increase (for convergence) the vertical integral of cloud liquid water. |
vertical_integral_of_divergence_of_geopotential_flux | وات بر متر مربع | ۲۷۸۳۰ متر | The vertical integral of the geopotential flux is the horizontal rate of flow of geopotential, per metre across the flow, for a column of air extending from the surface of the Earth to the top of the atmosphere. Its horizontal divergence is the rate of geopotential spreading outward from a point, per square metre. This parameter is positive for geopotential that is spreading out, or diverging, and negative for the opposite, for geopotential that is concentrating, or converging (convergence). This parameter thus indicates whether atmospheric motions act to decrease (for divergence) or increase (for convergence) the vertical integral of geopotential. Geopotential is the gravitational potential energy of a unit mass, at a particular location, relative to mean sea level. It is also the amount of work that would have to be done, against the force of gravity, to lift a unit mass to that location from mean sea level. This parameter can be used to study the atmospheric energy budget. |
vertical_integral_of_divergence_of_kinetic_energy_flux | وات بر متر مربع | ۲۷۸۳۰ متر | The vertical integral of the kinetic energy flux is the horizontal rate of flow of kinetic energy, per metre across the flow, for a column of air extending from the surface of the Earth to the top of the atmosphere. Its horizontal divergence is the rate of kinetic energy spreading outward from a point, per square metre. This parameter is positive for kinetic energy that is spreading out, or diverging, and negative for the opposite, for kinetic energy that is concentrating, or converging (convergence). This parameter thus indicates whether atmospheric motions act to decrease (for divergence) or increase (for convergence) the vertical integral of kinetic energy. Atmospheric kinetic energy is the energy of the atmosphere due to its motion. Only horizontal motion is considered in the calculation of this parameter. This parameter can be used to study the atmospheric energy budget. |
vertical_integral_of_divergence_of_mass_flux | کیلوگرم بر متر مربع بر ثانیه | ۲۷۸۳۰ متر | The vertical integral of the mass flux is the horizontal rate of flow of mass, per metre across the flow, for a column of air extending from the surface of the Earth to the top of the atmosphere. Its horizontal divergence is the rate of mass spreading outward from a point, per square metre. This parameter is positive for mass that is spreading out, or diverging, and negative for the opposite, for mass that is concentrating, or converging (convergence). This parameter thus indicates whether atmospheric motions act to decrease (for divergence) or increase (for convergence) the vertical integral of mass. This parameter can be used to study the atmospheric mass and energy budgets. |
vertical_integral_of_divergence_of_moisture_flux | کیلوگرم بر متر مربع بر ثانیه | ۲۷۸۳۰ متر | The vertical integral of the moisture flux is the horizontal rate of flow of moisture, per metre across the flow, for a column of air extending from the surface of the Earth to the top of the atmosphere. Its horizontal divergence is the rate of moisture spreading outward from a point, per square metre. This parameter is positive for moisture that is spreading out, or diverging, and negative for the opposite, for moisture that is concentrating, or converging (convergence). This parameter thus indicates whether atmospheric motions act to decrease (for divergence) or increase (for convergence) the vertical integral of moisture. 1 kg of water spread over 1 square metre of surface is 1 mm deep (neglecting the effects of temperature on the density of water), therefore the units are equivalent to mm (of liquid water) per second. |
vertical_integral_of_divergence_of_ozone_flux | کیلوگرم بر متر مربع بر ثانیه | ۲۷۸۳۰ متر | The vertical integral of the ozone flux is the horizontal rate of flow of ozone, per metre across the flow, for a column of air extending from the surface of the Earth to the top of the atmosphere. Its horizontal divergence is the rate of ozone spreading outward from a point, per square metre. This parameter is positive for ozone that is spreading out, or diverging, and negative for the opposite, for ozone that is concentrating, or converging (convergence). This parameter thus indicates whether atmospheric motions act to decrease (for divergence) or increase (for convergence) the vertical integral of ozone. In the ECMWF Integrated Forecasting System (IFS), there is a simplified representation of ozone chemistry (including a representation of the chemistry which has caused the ozone hole). Ozone is also transported around in the atmosphere through the motion of air. |
vertical_integral_of_divergence_of_thermal_energy_flux | وات بر متر مربع | ۲۷۸۳۰ متر | The vertical integral of the thermal energy flux is the horizontal rate of flow of thermal energy, per metre across the flow, for a column of air extending from the surface of the Earth to the top of the atmosphere. Its horizontal divergence is the rate of thermal energy spreading outward from a point, per square metre. This parameter is positive for thermal energy that is spreading out, or diverging, and negative for the opposite, for thermal energy that is concentrating, or converging (convergence). This parameter thus indicates whether atmospheric motions act to decrease (for divergence) or increase (for convergence) the vertical integral of thermal energy. The thermal energy is equal to enthalpy, which is the sum of the internal energy and the energy associated with the pressure of the air on its surroundings. Internal energy is the energy contained within a system ie, the microscopic energy of the air molecules, rather than the macroscopic energy associated with, for example, wind, or gravitational potential energy. The energy associated with the pressure of the air on its surroundings is the energy required to make room for the system by displacing its surroundings and is calculated from the product of pressure and volume. This parameter can be used to study the flow of thermal energy through the climate system and to investigate the atmospheric energy budget. |
vertical_integral_of_divergence_of_total_energy_flux | وات بر متر مربع | 27830 meters | The vertical integral of the total energy flux is the horizontal rate of flow of total energy, per metre across the flow, for a column of air extending from the surface of the Earth to the top of the atmosphere. Its horizontal divergence is the rate of total energy spreading outward from a point, per square metre. This parameter is positive for total energy that is spreading out, or diverging, and negative for the opposite, for total energy that is concentrating, or converging (convergence). This parameter thus indicates whether atmospheric motions act to decrease (for divergence) or increase (for convergence) the vertical integral of total energy. Total atmospheric energy is made up of internal, potential, kinetic and latent energy. This parameter can be used to study the atmospheric energy budget. |
vertical_integral_of_eastward_cloud_frozen_water_flux | kg/m/s | 27830 meters | This parameter is the horizontal rate of flow of cloud frozen water, in the eastward direction, per metre across the flow, for a column of air extending from the surface of the Earth to the top of the atmosphere. Positive values indicate a flux from west to east. Note that "cloud frozen water" is the same as "cloud ice water". |
vertical_integral_of_eastward_cloud_liquid_water_flux | kg/m/s | 27830 meters | This parameter is the horizontal rate of flow of cloud liquid water, in the eastward direction, per metre across the flow, for a column of air extending from the surface of the Earth to the top of the atmosphere. Positive values indicate a flux from west to east. |
vertical_integral_of_eastward_geopotential_flux | W/m | 27830 meters | This parameter is the horizontal rate of flow of geopotential, in the eastward direction, per metre across the flow, for a column of air extending from the surface of the Earth to the top of the atmosphere. Positive values indicate a flux from west to east. Geopotential is the gravitational potential energy of a unit mass, at a particular location, relative to mean sea level. It is also the amount of work that would have to be done, against the force of gravity, to lift a unit mass to that location from mean sea level. This parameter can be used to study the atmospheric energy budget. |
vertical_integral_of_eastward_heat_flux | W/m | 27830 meters | This parameter is the horizontal rate of flow of heat in the eastward direction, per meter across the flow, for a column of air extending from the surface of the Earth to the top of the atmosphere. Positive values indicate a flux from west to east. Heat (or thermal energy) is equal to enthalpy, which is the sum of the internal energy and the energy associated with the pressure of the air on its surroundings. Internal energy is the energy contained within a system ie, the microscopic energy of the air molecules, rather than the macroscopic energy associated with, for example, wind, or gravitational potential energy. The energy associated with the pressure of the air on its surroundings is the energy required to make room for the system by displacing its surroundings and is calculated from the product of pressure and volume. This parameter can be used to study the atmospheric energy budget. |
vertical_integral_of_eastward_kinetic_energy_flux | W/m | 27830 meters | This parameter is the horizontal rate of flow of kinetic energy, in the eastward direction, per metre across the flow, for a column of air extending from the surface of the Earth to the top of the atmosphere. Positive values indicate a flux from west to east. Atmospheric kinetic energy is the energy of the atmosphere due to its motion. Only horizontal motion is considered in the calculation of this parameter. This parameter can be used to study the atmospheric energy budget. |
vertical_integral_of_eastward_mass_flux | kg/m/s | 27830 meters | This parameter is the horizontal rate of flow of mass, in the eastward direction, per metre across the flow, for a column of air extending from the surface of the Earth to the top of the atmosphere. Positive values indicate a flux from west to east. This parameter can be used to study the atmospheric mass and energy budgets. |
vertical_integral_of_eastward_ozone_flux | kg/m/s | 27830 meters | This parameter is the horizontal rate of flow of ozone in the eastward direction, per metre across the flow, for a column of air extending from the surface of the Earth to the top of the atmosphere. Positive values denote a flux from west to east. In the ECMWF Integrated Forecasting System (IFS), there is a simplified representation of ozone chemistry (including a representation of the chemistry which has caused the ozone hole). Ozone is also transported around in the atmosphere through the motion of air. |
vertical_integral_of_eastward_total_energy_flux | W/m | 27830 meters | This parameter is the horizontal rate of flow of total energy in the eastward direction, per metre across the flow, for a column of air extending from the surface of the Earth to the top of the atmosphere. Positive values indicate a flux from west to east. Total atmospheric energy is made up of internal, potential, kinetic and latent energy. This parameter can be used to study the atmospheric energy budget. |
vertical_integral_of_eastward_water_vapour_flux | kg/m/s | 27830 meters | This parameter is the horizontal rate of flow of water vapour, in the eastward direction, per metre across the flow, for a column of air extending from the surface of the Earth to the top of the atmosphere. Positive values indicate a flux from west to east. |
vertical_integral_of_energy_conversion | وات بر متر مربع | 27830 meters | This parameter is one contribution to the amount of energy being converted between kinetic energy, and internal plus potential energy, for a column of air extending from the surface of the Earth to the top of the atmosphere. Negative values indicate a conversion to kinetic energy from potential plus internal energy. This parameter can be used to study the atmospheric energy budget. The circulation of the atmosphere can also be considered in terms of energy conversions. |
vertical_integral_of_kinetic_energy | ژول بر متر مربع | 27830 meters | This parameter is the vertical integral of kinetic energy for a column of air extending from the surface of the Earth to the top of the atmosphere. Atmospheric kinetic energy is the energy of the atmosphere due to its motion. Only horizontal motion is considered in the calculation of this parameter. This parameter can be used to study the atmospheric energy budget. |
vertical_integral_of_mass_of_atmosphere | کیلوگرم بر متر مربع | 27830 meters | This parameter is the total mass of air for a column extending from the surface of the Earth to the top of the atmosphere, per square metre. This parameter is calculated by dividing surface pressure by the Earth's gravitational acceleration, g (=9.80665 ms^-2 ), and has units of kilograms per square metre. This parameter can be used to study the atmospheric mass budget. |
vertical_integral_of_mass_tendency | کیلوگرم بر متر مربع بر ثانیه | 27830 meters | This parameter is the rate of change of the mass of a column of air extending from the Earth's surface to the top of the atmosphere. An increasing mass of the column indicates rising surface pressure. In contrast, a decrease indicates a falling surface pressure. The mass of the column is calculated by dividing pressure at the Earth's surface by the gravitational acceleration, g (=9.80665 ms^-2 ). This parameter can be used to study the atmospheric mass and energy budgets. |
vertical_integral_of_northward_cloud_frozen_water_flux | kg/m/s | 27830 meters | This parameter is the horizontal rate of flow of cloud frozen water, in the northward direction, per metre across the flow, for a column of air extending from the surface of the Earth to the top of the atmosphere. Positive values indicate a flux from south to north. Note that "cloud frozen water" is the same as "cloud ice water". |
vertical_integral_of_northward_cloud_liquid_water_flux | kg/m/s | 27830 meters | This parameter is the horizontal rate of flow of cloud liquid water, in the northward direction, per metre across the flow, for a column of air extending from the surface of the Earth to the top of the atmosphere. Positive values indicate a flux from south to north. |
vertical_integral_of_northward_geopotential_flux | W/m | 27830 meters | This parameter is the horizontal rate of flow of geopotential in the northward direction, per metre across the flow, for a column of air extending from the surface of the Earth to the top of the atmosphere. Positive values indicate a flux from south to north. Geopotential is the gravitational potential energy of a unit mass, at a particular location, relative to mean sea level. It is also the amount of work that would have to be done, against the force of gravity, to lift a unit mass to that location from mean sea level. This parameter can be used to study the atmospheric energy budget. |
vertical_integral_of_northward_heat_flux | W/m | 27830 meters | This parameter is the horizontal rate of flow of heat in the northward direction, per metre across the flow, for a column of air extending from the surface of the Earth to the top of the atmosphere. Positive values indicate a flux from south to north. Heat (or thermal energy) is equal to enthalpy, which is the sum of the internal energy and the energy associated with the pressure of the air on its surroundings. Internal energy is the energy contained within a system ie, the microscopic energy of the air molecules, rather than the macroscopic energy associated with, for example, wind, or gravitational potential energy. The energy associated with the pressure of the air on its surroundings is the energy required to make room for the system by displacing its surroundings and is calculated from the product of pressure and volume. This parameter can be used to study the atmospheric energy budget. |
vertical_integral_of_northward_kinetic_energy_flux | W/m | 27830 meters | This parameter is the horizontal rate of flow of kinetic energy, in the northward direction, per metre across the flow, for a column of air extending from the surface of the Earth to the top of the atmosphere. Positive values indicate a flux from south to north. Atmospheric kinetic energy is the energy of the atmosphere due to its motion. Only horizontal motion is considered in the calculation of this parameter. This parameter can be used to study the atmospheric energy budget. |
vertical_integral_of_northward_mass_flux | kg/m/s | 27830 meters | This parameter is the horizontal rate of flow of mass, in the northward direction, per metre across the flow, for a column of air extending from the surface of the Earth to the top of the atmosphere. Positive values indicate a flux from south to north. This parameter can be used to study the atmospheric mass and energy budgets. |
vertical_integral_of_northward_ozone_flux | kg/m/s | 27830 meters | This parameter is the horizontal rate of flow of ozone in the northward direction, per metre across the flow, for a column of air extending from the surface of the Earth to the top of the atmosphere. Positive values denote a flux from south to north. In the ECMWF Integrated Forecasting System (IFS), there is a simplified representation of ozone chemistry (including a representation of the chemistry which has caused the ozone hole). Ozone is also transported around in the atmosphere through the motion of air. |
high_vegetation_cover | بیبعد | 27830 meters | This parameter is the fraction of the grid box that is covered with vegetation that is classified as "high". The values vary between 0 and 1 but do not vary in time. This is one of the parameters in the model that describes land surface vegetation. "High vegetation" consists of evergreen trees, deciduous trees, mixed forest/woodland, and interrupted forest. |
leaf_area_index_high_vegetation | بیبعد | 27830 meters | This parameter is the surface area of one side of all the leaves found over an area of land for vegetation classified as "high". This parameter has a value of 0 over bare ground or where there are no leaves. It can be calculated daily from satellite data. It is important for forecasting, for example, how much rainwater will be intercepted by the vegetative canopy, rather than falling to the ground. This is one of the parameters in the model that describes land surface vegetation. "High vegetation" consists of evergreen trees, deciduous trees, mixed forest/woodland, and interrupted forest. |
leaf_area_index_low_vegetation | بیبعد | 27830 meters | This parameter is the surface area of one side of all the leaves found over an area of land for vegetation classified as "low". This parameter has a value of 0 over bare ground or where there are no leaves. It can be calculated daily from satellite data. It is important for forecasting, for example, how much rainwater will be intercepted by the vegetative canopy, rather than falling to the ground. This is one of the parameters in the model that describes land surface vegetation. "Low vegetation" consists of crops and mixed farming, irrigated crops, short grass, tall grass, tundra, semidesert, bogs and marshes, evergreen shrubs, deciduous shrubs, and water and land mixtures. |
low_vegetation_cover | بیبعد | 27830 meters | This parameter is the fraction of the grid box that is covered with vegetation that is classified as "low". The values vary between 0 and 1 but do not vary in time. This is one of the parameters in the model that describes land surface vegetation. "Low vegetation" consists of crops and mixed farming, irrigated crops, short grass, tall grass, tundra, semidesert, bogs and marshes, evergreen shrubs, deciduous shrubs, and water and land mixtures. |
type_of_high_vegetation | بیبعد | 27830 meters | This parameter indicates the 6 types of high vegetation recognised by the ECMWF Integrated Forecasting System: 3 = Evergreen needleleaf trees, 4 = Deciduous needleleaf trees, 5 = Deciduous broadleaf trees, 6 = Evergreen broadleaf trees, 18 = Mixed forest/woodland, 19 = Interrupted forest. A value of 0 indicates a point without high vegetation, including an oceanic or inland water location. Vegetation types are used to calculate the surface energy balance and snow albedo. This parameter does not vary in time. |
type_of_low_vegetation | بیبعد | 27830 meters | This parameter indicates the 10 types of low vegetation recognised by the ECMWF Integrated Forecasting System: 1 = Crops, Mixed farming, 2 = Grass, 7 = Tall grass, 9 = Tundra, 10 = Irrigated crops, 11 = Semidesert, 13 = Bogs and marshes, 16 = Evergreen shrubs, 17 = Deciduous shrubs, 20 = Water and land mixtures. A value of 0 indicates a point without low vegetation, including an oceanic or inland water location. Vegetation types are used to calculate the surface energy balance and snow albedo. This parameter does not vary in time. |
air_density_over_the_oceans | کیلوگرم بر متر مکعب | 27830 meters | This parameter is the mass of air per cubic metre over the oceans, derived from the temperature, specific humidity and pressure at the lowest model level in the atmospheric model. This parameter is one of the parameters used to force the wave model, therefore it is only calculated over water bodies represented in the ocean wave model. It is interpolated from the atmospheric model horizontal grid onto the horizontal grid used by the ocean wave model. |
coefficient_of_drag_with_waves | بیبعد | 27830 meters | This parameter is the resistance that ocean waves exert on the atmosphere. It is sometimes also called a "friction coefficient". It is calculated by the wave model as the ratio of the square of the friction velocity, to the square of the neutral wind speed at a height of 10 metres above the surface of the Earth. The neutral wind is calculated from the surface stress and the corresponding roughness length by assuming that the air is neutrally stratified. The neutral wind is, by definition, in the direction of the surface stress. The size of the roughness length depends on the sea state. |
free_convective_velocity_over_the_oceans | اماس | 27830 meters | This parameter is an estimate of the vertical velocity of updraughts generated by free convection. Free convection is fluid motion induced by buoyancy forces, which are driven by density gradients. The free convective velocity is used to estimate the impact of wind gusts on ocean wave growth. It is calculated at the height of the lowest temperature inversion (the height above the surface of the Earth where the temperature increases with height). This parameter is one of the parameters used to force the wave model, therefore it is only calculated over water bodies represented in the ocean wave model. It is interpolated from the atmospheric model horizontal grid onto the horizontal grid used by the ocean wave model. |
maximum_individual_wave_height | متر | 27830 meters | This parameter is an estimate of the height of the expected highest individual wave within a 20 minute time window. It can be used as a guide to the likelihood of extreme or freak waves. The interactions between waves are non-linear and occasionally concentrate wave energy giving a wave height considerably larger than the significant wave height. If the maximum individual wave height is more than twice the significant wave height, then the wave is considered as a freak wave. The significant wave height represents the average height of the highest third of surface ocean/sea waves, generated by local winds and associated with swell. The ocean/sea surface wave field consists of a combination of waves with different heights, lengths and directions (known as the two-dimensional wave spectrum). This parameter is derived statistically from the two-dimensional wave spectrum. The wave spectrum can be decomposed into wind-sea waves, which are directly affected by local winds, and swell, the waves that were generated by the wind at a different location and time. This parameter takes account of both. |
mean_direction_of_total_swell | درجه | 27830 meters | This parameter is the mean direction of waves associated with swell. The ocean/sea surface wave field consists of a combination of waves with different heights, lengths and directions (known as the two-dimensional wave spectrum). The wave spectrum can be decomposed into wind-sea waves, which are directly affected by local winds, and swell, the waves that were generated by the wind at a different location and time. This parameter takes account of all swell only. It is the mean over all frequencies and directions of the total swell spectrum. The units are degrees true, which means the direction relative to the geographic location of the north pole. It is the direction that waves are coming from, so 0 degrees means "coming from the north" and 90 degrees means "coming from the east". |
mean_direction_of_wind_waves | درجه | 27830 meters | The mean direction of waves generated by local winds. The ocean/sea surface wave field consists of a combination of waves with different heights, lengths and directions (known as the two-dimensional wave spectrum). The wave spectrum can be decomposed into wind-sea waves, which are directly affected by local winds, and swell, the waves that were generated by the wind at a different location and time. This parameter takes account of wind-sea waves only. It is the mean over all frequencies and directions of the total wind-sea wave spectrum. The units are degrees true, which means the direction relative to the geographic location of the north pole. It is the direction that waves are coming from, so 0 degrees means "coming from the north" and 90 degrees means "coming from the east". |
mean_period_of_total_swell | ثانیهها | 27830 meters | This parameter is the average time it takes for two consecutive wave crests, on the surface of the ocean/sea associated with swell, to pass through a fixed point. The ocean/sea surface wave field consists of a combination of waves with different heights, lengths and directions (known as the two-dimensional wave spectrum). The wave spectrum can be decomposed into wind-sea waves, which are directly affected by local winds, and swell, the waves that were generated by the wind at a different location and time. This parameter takes account of all swell only. It is the mean over all frequencies and directions of the total swell spectrum. |
mean_period_of_wind_waves | ثانیهها | 27830 meters | This parameter is the average time it takes for two consecutive wave crests, on the surface of the ocean/sea generated by local winds, to pass through a fixed point. The ocean/sea surface wave field consists of a combination of waves with different heights, lengths and directions (known as the two-dimensional wave spectrum). The wave spectrum can be decomposed into wind-sea waves, which are directly affected by local winds, and swell, the waves that were generated by the wind at a different location and time. This parameter takes account of wind-sea waves only. It is the mean over all frequencies and directions of the total wind-sea spectrum. |
mean_square_slope_of_waves | بیبعد | 27830 meters | This parameter can be related analytically to the average slope of combined wind-sea and swell waves. It can also be expressed as a function of wind speed under some statistical assumptions. The higher the slope, the steeper the waves. This parameter indicates the roughness of the sea/ocean surface which affects the interaction between ocean and atmosphere. The ocean/sea surface wave field consists of a combination of waves with different heights, lengths and directions (known as the two-dimensional wave spectrum). This parameter is derived statistically from the two-dimensional wave spectrum. |
mean_wave_direction | درجه | 27830 meters | This parameter is the mean direction of ocean/sea surface waves. The ocean/sea surface wave field consists of a combination of waves with different heights, lengths and directions (known as the two-dimensional wave spectrum). This parameter is a mean over all frequencies and directions of the two-dimensional wave spectrum. The wave spectrum can be decomposed into wind-sea waves, which are directly affected by local winds, and swell, the waves that were generated by the wind at a different location and time. This parameter takes account of both. This parameter can be used to assess sea state and swell. For example, engineers use this type of wave information when designing structures in the open ocean, such as oil platforms, or in coastal applications. The units are degrees true, which means the direction relative to the geographic location of the north pole. It is the direction that waves are coming from, so 0 degrees means "coming from the north" and 90 degrees means "coming from the east". |
mean_wave_direction_of_first_swell_partition | درجه | 27830 meters | This parameter is the mean direction of waves in the first swell partition. The ocean/sea surface wave field consists of a combination of waves with different heights, lengths and directions (known as the two-dimensional wave spectrum). The wave spectrum can be decomposed into wind-sea waves, which are directly affected by local winds, and swell, the waves that were generated by the wind at a different location and time. In many situations, swell can be made up of different swell systems, for example, from two distant and separate storms. To account for this, the swell spectrum is partitioned into up to three parts. The swell partitions are labelled first, second and third based on their respective wave height. Therefore, there is no guarantee of spatial coherence (the first swell partition might be from one system at one location and a different system at the neighbouring location). The units are degrees true, which means the direction relative to the geographic location of the north pole. It is the direction that waves are coming from, so 0 degrees means "coming from the north" and 90 degrees means "coming from the east". |
mean_wave_direction_of_second_swell_partition | درجه | 27830 meters | This parameter is the mean direction of waves in the second swell partition. The ocean/sea surface wave field consists of a combination of waves with different heights, lengths and directions (known as the two-dimensional wave spectrum). The wave spectrum can be decomposed into wind-sea waves, which are directly affected by local winds, and swell, the waves that were generated by the wind at a different location and time. In many situations, swell can be made up of different swell systems, for example, from two distant and separate storms. To account for this, the swell spectrum is partitioned into up to three parts. The swell partitions are labelled first, second and third based on their respective wave height. Therefore, there is no guarantee of spatial coherence (the first swell partition might be from one system at one location and a different system at the neighbouring location). The units are degrees true, which means the direction relative to the geographic location of the north pole. It is the direction that waves are coming from, so 0 degrees means "coming from the north" and 90 degrees means "coming from the east". |
mean_wave_direction_of_third_swell_partition | درجه | 27830 meters | This parameter is the mean direction of waves in the third swell partition. The ocean/sea surface wave field consists of a combination of waves with different heights, lengths and directions (known as the two-dimensional wave spectrum). The wave spectrum can be decomposed into wind-sea waves, which are directly affected by local winds, and swell, the waves that were generated by the wind at a different location and time. In many situations, swell can be made up of different swell systems, for example, from two distant and separate storms. To account for this, the swell spectrum is partitioned into up to three parts. The swell partitions are labelled first, second and third based on their respective wave height. Therefore, there is no guarantee of spatial coherence (the first swell partition might be from one system at one location and a different system at the neighbouring location). The units are degrees true, which means the direction relative to the geographic location of the north pole. It is the direction that waves are coming from, so 0 degrees means "coming from the north" and 90 degrees means "coming from the east". |
mean_wave_period | ثانیهها | 27830 meters | This parameter is the average time it takes for two consecutive wave crests, on the surface of the ocean/sea, to pass through a fixed point. The ocean/sea surface wave field consists of a combination of waves with different heights, lengths and directions (known as the two-dimensional wave spectrum). This parameter is a mean over all frequencies and directions of the two-dimensional wave spectrum. The wave spectrum can be decomposed into wind-sea waves, which are directly affected by local winds, and swell, the waves that were generated by the wind at a different location and time. This parameter takes account of both. This parameter can be used to assess sea state and swell. For example, engineers use such wave information when designing structures in the open ocean, such as oil platforms, or in coastal applications. |
mean_wave_period_based_on_first_moment | ثانیهها | 27830 meters | This parameter is the reciprocal of the mean frequency of the wave components that represent the sea state. All wave components have been averaged proportionally to their respective amplitude. This parameter can be used to estimate the magnitude of Stokes drift transport in deep water. The ocean/sea surface wave field consists of a combination of waves with different heights, lengths and directions (known as the two-dimensional wave spectrum). Moments are statistical quantities derived from the two-dimensional wave spectrum. |
mean_wave_period_based_on_first_moment_for_swell | ثانیهها | 27830 meters | This parameter is the reciprocal of the mean frequency of the wave components associated with swell. All wave components have been averaged proportionally to their respective amplitude. This parameter can be used to estimate the magnitude of Stokes drift transport in deep water associated with swell. The ocean/sea surface wave field consists of a combination of waves with different heights, lengths and directions (known as the two-dimensional wave spectrum). The wave spectrum can be decomposed into wind-sea waves, which are directly affected by local winds, and swell, the waves that were generated by the wind at a different location and time. This parameter takes account of all swell only. Moments are statistical quantities derived from the two-dimensional wave spectrum. |
mean_wave_period_based_on_first_moment_for_wind_waves | ثانیهها | 27830 meters | This parameter is the reciprocal of the mean frequency of the wave components generated by local winds. All wave components have been averaged proportionally to their respective amplitude. This parameter can be used to estimate the magnitude of Stokes drift transport in deep water associated with wind waves. The ocean/sea surface wave field consists of a combination of waves with different heights, lengths and directions (known as the two-dimensional wave spectrum). The wave spectrum can be decomposed into wind-sea waves, which are directly affected by local winds, and swell, the waves that were generated by the wind at a different location and time. This parameter takes account of wind-sea waves only. Moments are statistical quantities derived from the two-dimensional wave spectrum. |
mean_wave_period_based_on_second_moment_for_swell | ثانیهها | 27830 meters | This parameter is equivalent to the zero-crossing mean wave period for swell. The zero-crossing mean wave period represents the mean length of time between occasions where the sea/ocean surface crosses a defined zeroth level (such as mean sea level). The ocean/sea surface wave field consists of a combination of waves with different heights, lengths and directions (known as the two-dimensional wave spectrum). The wave spectrum can be decomposed into wind-sea waves, which are directly affected by local winds, and swell, the waves that were generated by the wind at a different location and time. Moments are statistical quantities derived from the two-dimensional wave spectrum. |
mean_wave_period_based_on_second_moment_for_wind_waves | ثانیهها | 27830 meters | This parameter is equivalent to the zero-crossing mean wave period for waves generated by local winds. The zero-crossing mean wave period represents the mean length of time between occasions where the sea/ocean surface crosses a defined zeroth level (such as mean sea level). The ocean/sea surface wave field consists of a combination of waves with different heights, lengths and directions (known as the two-dimensional wave spectrum). The wave spectrum can be decomposed into wind-sea waves, which are directly affected by local winds, and swell, the waves that were generated by the wind at a different location and time. Moments are statistical quantities derived from the two-dimensional wave spectrum. |
mean_wave_period_of_first_swell_partition | ثانیهها | 27830 meters | This parameter is the mean period of waves in the first swell partition. The wave period is the average time it takes for two consecutive wave crests, on the surface of the ocean/sea, to pass through a fixed point. The ocean/sea surface wave field consists of a combination of waves with different heights, lengths and directions (known as the two-dimensional wave spectrum). The wave spectrum can be decomposed into wind-sea waves, which are directly affected by local winds, and swell, the waves that were generated by the wind at a different location and time. In many situations, swell can be made up of different swell systems, for example, from two distant and separate storms. To account for this, the swell spectrum is partitioned into up to three parts. The swell partitions are labelled first, second and third based on their respective wave height. Therefore, there is no guarantee of spatial coherence (the first swell partition might be from one system at one location and a different system at the neighbouring location). |
mean_wave_period_of_second_swell_partition | ثانیهها | 27830 meters | This parameter is the mean period of waves in the second swell partition. The wave period is the average time it takes for two consecutive wave crests, on the surface of the ocean/sea, to pass through a fixed point. The ocean/sea surface wave field consists of a combination of waves with different heights, lengths and directions (known as the two-dimensional wave spectrum). The wave spectrum can be decomposed into wind-sea waves, which are directly affected by local winds, and swell, the waves that were generated by the wind at a different location and time. In many situations, swell can be made up of different swell systems, for example, from two distant and separate storms. To account for this, the swell spectrum is partitioned into up to three parts. The swell partitions are labelled first, second and third based on their respective wave height. Therefore, there is no guarantee of spatial coherence (the second swell partition might be from one system at one location and a different system at the neighbouring location). |
mean_wave_period_of_third_swell_partition | ثانیهها | 27830 meters | This parameter is the mean period of waves in the third swell partition. The wave period is the average time it takes for two consecutive wave crests, on the surface of the ocean/sea, to pass through a fixed point. The ocean/sea surface wave field consists of a combination of waves with different heights, lengths and directions (known as the two-dimensional wave spectrum). The wave spectrum can be decomposed into wind-sea waves, which are directly affected by local winds, and swell, the waves that were generated by the wind at a different location and time. In many situations, swell can be made up of different swell systems, for example, from two distant and separate storms. To account for this, the swell spectrum is partitioned into up to three parts. The swell partitions are labelled first, second and third based on their respective wave height. Therefore, there is no guarantee of spatial coherence (the third swell partition might be from one system at one location and a different system at the neighbouring location). |
mean_zero_crossing_wave_period | ثانیهها | 27830 meters | This parameter represents the mean length of time between occasions where the sea/ocean surface crosses mean sea level. In combination with wave height information, it could be used to assess the length of time that a coastal structure might be under water, for example. The ocean/sea surface wave field consists of a combination of waves with different heights, lengths and directions (known as the two-dimensional wave spectrum). In the ECMWF Integrated Forecasting System (IFS) this parameter is calculated from the characteristics of the two-dimensional wave spectrum. |
model_bathymetry | متر | 27830 meters | This parameter is the depth of water from the surface to the bottom of the ocean. It is used by the ocean wave model to specify the propagation properties of the different waves that could be present. Note that the ocean wave model grid is too coarse to resolve some small islands and mountains on the bottom of the ocean, but they can have an impact on surface ocean waves. The ocean wave model has been modified to reduce the wave energy flowing around or over features at spatial scales smaller than the grid box. |
normalized_energy_flux_into_ocean | بیبعد | 27830 meters | This parameter is the normalised vertical flux of turbulent kinetic energy from ocean waves into the ocean. The energy flux is calculated from an estimation of the loss of wave energy due to white capping waves. A white capping wave is one that appears white at its crest as it breaks, due to air being mixed into the water. When waves break in this way, there is a transfer of energy from the waves to the ocean. Such a flux is defined to be negative. The energy flux has units of Watts per metre squared, and this is normalised by being divided by the product of air density and the cube of the friction velocity. |
normalized_energy_flux_into_waves | بیبعد | 27830 meters | This parameter is the normalised vertical flux of energy from wind into the ocean waves. A positive flux implies a flux into the waves. The energy flux has units of Watts per metre squared, and this is normalised by being divided by the product of air density and the cube of the friction velocity. |
normalized_stress_into_ocean | بیبعد | 27830 meters | This parameter is the normalised surface stress, or momentum flux, from the air into the ocean due to turbulence at the air-sea interface and breaking waves. It does not include the flux used to generate waves. The ECMWF convention for vertical fluxes is positive downwards. The stress has units of Newtons per metre squared, and this is normalised by being divided by the product of air density and the square of the friction velocity. |
ocean_surface_stress_equivalent_10m_neutral_wind_direction | درجه | 27830 meters | This parameter is the direction from which the "neutral wind" blows, in degrees clockwise from true north, at a height of ten metres above the surface of the Earth. The neutral wind is calculated from the surface stress and roughness length by assuming that the air is neutrally stratified. The neutral wind is, by definition, in the direction of the surface stress. The size of the roughness length depends on the sea state. This parameter is the wind direction used to force the wave model, therefore it is only calculated over water bodies represented in the ocean wave model. It is interpolated from the atmospheric model's horizontal grid onto the horizontal grid used by the ocean wave model. |
ocean_surface_stress_equivalent_10m_neutral_wind_speed | اماس | ۲۷۸۳۰ متر | This parameter is the horizontal speed of the "neutral wind", at a height of ten metres above the surface of the Earth. The units of this parameter are metres per second. The neutral wind is calculated from the surface stress and roughness length by assuming that the air is neutrally stratified. The neutral wind is, by definition, in the direction of the surface stress. The size of the roughness length depends on the sea state. This parameter is the wind speed used to force the wave model, therefore it is only calculated over water bodies represented in the ocean wave model. It is interpolated from the atmospheric model's horizontal grid onto the horizontal grid used by the ocean wave model. |
peak_wave_period | ثانیهها | 27830 meters | This parameter represents the period of the most energetic ocean waves generated by local winds and associated with swell. The wave period is the average time it takes for two consecutive wave crests, on the surface of the ocean/sea, to pass through a fixed point. The ocean/sea surface wave field consists of a combination of waves with different heights, lengths and directions (known as the two-dimensional wave spectrum). This parameter is calculated from the reciprocal of the frequency corresponding to the largest value (peak) of the frequency wave spectrum. The frequency wave spectrum is obtained by integrating the two-dimensional wave spectrum over all directions. The wave spectrum can be decomposed into wind-sea waves, which are directly affected by local winds, and swell, the waves that were generated by the wind at a different location and time. This parameter takes account of both. |
period_corresponding_to_maximum_individual_wave_height | ثانیهها | 27830 meters | This parameter is the period of the expected highest individual wave within a 20-minute time window. It can be used as a guide to the characteristics of extreme or freak waves. Wave period is the average time it takes for two consecutive wave crests, on the surface of the ocean/sea, to pass through a fixed point. Occasionally waves of different periods reinforce and interact non-linearly giving a wave height considerably larger than the significant wave height. If the maximum individual wave height is more than twice the significant wave height, then the wave is considered to be a freak wave. The significant wave height represents the average height of the highest third of surface ocean/sea waves, generated by local winds and associated with swell. The ocean/sea surface wave field consists of a combination of waves with different heights, lengths and directions (known as the two-dimensional wave spectrum). This parameter is derived statistically from the two-dimensional wave spectrum. The wave spectrum can be decomposed into wind-sea waves, which are directly affected by local winds, and swell, the waves that were generated by the wind at a different location and time. This parameter takes account of both. |
significant_height_of_combined_wind_waves_and_swell | متر | 27830 meters | This parameter represents the average height of the highest third of surface ocean/sea waves generated by wind and swell. It represents the vertical distance between the wave crest and the wave trough. The ocean/sea surface wave field consists of a combination of waves with different heights, lengths and directions (known as the two-dimensional wave spectrum). The wave spectrum can be decomposed into wind-sea waves, which are directly affected by local winds, and swell, the waves that were generated by the wind at a different location and time. This parameter takes account of both. More strictly, this parameter is four times the square root of the integral over all directions and all frequencies of the two-dimensional wave spectrum. This parameter can be used to assess sea state and swell. For example, engineers use significant wave height to calculate the load on structures in the open ocean, such as oil platforms, or in coastal applications. |
significant_height_of_total_swell | متر | 27830 meters | This parameter represents the average height of the highest third of surface ocean/sea waves associated with swell. It represents the vertical distance between the wave crest and the wave trough. The ocean/sea surface wave field consists of a combination of waves with different heights, lengths and directions (known as the two-dimensional wave spectrum). The wave spectrum can be decomposed into wind-sea waves, which are directly affected by local winds, and swell, the waves that were generated by the wind at a different location and time. This parameter takes account of total swell only. More strictly, this parameter is four times the square root of the integral over all directions and all frequencies of the two-dimensional total swell spectrum. The total swell spectrum is obtained by only considering the components of the two-dimensional wave spectrum that are not under the influence of the local wind. This parameter can be used to assess swell. For example, engineers use significant wave height to calculate the load on structures in the open ocean, such as oil platforms, or in coastal applications. |
significant_height_of_wind_waves | متر | 27830 meters | This parameter represents the average height of the highest third of surface ocean/sea waves generated by the local wind. It represents the vertical distance between the wave crest and the wave trough. The ocean/sea surface wave field consists of a combination of waves with different heights, lengths and directions (known as the two-dimensional wave spectrum). The wave spectrum can be decomposed into wind-sea waves, which are directly affected by local winds, and swell, the waves that were generated by the wind at a different location and time. This parameter takes account of wind-sea waves only. More strictly, this parameter is four times the square root of the integral over all directions and all frequencies of the two-dimensional wind-sea wave spectrum. The wind-sea wave spectrum is obtained by only considering the components of the two-dimensional wave spectrum that are still under the influence of the local wind. This parameter can be used to assess wind-sea waves. For example, engineers use significant wave height to calculate the load on structures in the open ocean, such as oil platforms, or in coastal applications. |
significant_wave_height_of_first_swell_partition | متر | 27830 meters | This parameter represents the average height of the highest third of surface ocean/sea waves associated with the first swell partition. Wave height represents the vertical distance between the wave crest and the wave trough. The ocean/sea surface wave field consists of a combination of waves with different heights, lengths and directions (known as the two-dimensional wave spectrum). The wave spectrum can be decomposed into wind-sea waves, which are directly affected by local winds, and swell, the waves that were generated by the wind at a different location and time. In many situations, swell can be made up of different swell systems, for example, from two distant and separate storms. To account for this, the swell spectrum is partitioned into up to three parts. The swell partitions are labelled first, second and third based on their respective wave height. Therefore, there is no guarantee of spatial coherence (the first might be from one system at one location and another system at the neighbouring location). More strictly, this parameter is four times the square root of the integral over all directions and all frequencies of the first swell partition of the two-dimensional swell spectrum. The swell spectrum is obtained by only considering the components of the two-dimensional wave spectrum that are not under the influence of the local wind. This parameter can be used to assess swell. For example, engineers use significant wave height to calculate the load on structures in the open ocean, such as oil platforms, or in coastal applications. |
significant_wave_height_of_second_swell_partition | متر | 27830 meters | This parameter represents the average height of the highest third of surface ocean/sea waves associated with the second swell partition. Wave height represents the vertical distance between the wave crest and the wave trough. The ocean/sea surface wave field consists of a combination of waves with different heights, lengths and directions (known as the two-dimensional wave spectrum). The wave spectrum can be decomposed into wind-sea waves, which are directly affected by local winds, and swell, the waves that were generated by the wind at a different location and time. In many situations, swell can be made up of different swell systems, for example, from two distant and separate storms. To account for this, the swell spectrum is partitioned into up to three parts. The swell partitions are labelled first, second and third based on their respective wave height. Therefore, there is no guarantee of spatial coherence (the second might be from one system at one location and another system at the neighbouring location). More strictly, this parameter is four times the square root of the integral over all directions and all frequencies of the first swell partition of the two-dimensional swell spectrum. The swell spectrum is obtained by only considering the components of the two-dimensional wave spectrum that are not under the influence of the local wind. This parameter can be used to assess swell. For example, engineers use significant wave height to calculate the load on structures in the open ocean, such as oil platforms, or in coastal applications. |
significant_wave_height_of_third_swell_partition | متر | 27830 meters | This parameter represents the average height of the highest third of surface ocean/sea waves associated with the third swell partition. Wave height represents the vertical distance between the wave crest and the wave trough. The ocean/sea surface wave field consists of a combination of waves with different heights, lengths and directions (known as the two-dimensional wave spectrum). The wave spectrum can be decomposed into wind-sea waves, which are directly affected by local winds, and swell, the waves that were generated by the wind at a different location and time. In many situations, swell can be made up of different swell systems, for example, from two distant and separate storms. To account for this, the swell spectrum is partitioned into up to three parts. The swell partitions are labelled first, second and third based on their respective wave height. Therefore, there is no guarantee of spatial coherence (the third might be from one system at one location and another system at the neighbouring location). More strictly, this parameter is four times the square root of the integral over all directions and all frequencies of the first swell partition of the two-dimensional swell spectrum. The swell spectrum is obtained by only considering the components of the two-dimensional wave spectrum that are not under the influence of the local wind. This parameter can be used to assess swell. For example, engineers use significant wave height to calculate the load on structures in the open ocean, such as oil platforms, or in coastal applications. |
angle_of_sub_gridscale_orography | راد | 27830 meters | This parameter is one of four parameters (the others being standard deviation, slope and anisotropy) that describe the features of the orography that are too small to be resolved by the model grid. These four parameters are calculated for orographic features with horizontal scales comprised between 5 km and the model grid resolution, being derived from the height of valleys, hills and mountains at about 1 km resolution. They are used as input for the sub-grid orography scheme which represents low-level blocking and orographic gravity wave effects. The angle of the sub-grid scale orography characterises the geographical orientation of the terrain in the horizontal plane (from a bird's-eye view) relative to an eastwards axis. This parameter does not vary in time. |
anisotropy_of_sub_gridscale_orography | بیبعد | 27830 meters | This parameter is one of four parameters (the others being standard deviation, slope and angle of sub-gridscale orography) that describe the features of the orography that are too small to be resolved by the model grid. These four parameters are calculated for orographic features with horizontal scales comprised between 5 km and the model grid resolution, being derived from the height of valleys, hills and mountains at about 1 km resolution. They are used as input for the sub-grid orography scheme which represents low-level blocking and orographic gravity wave effects. This parameter is a measure of how much the shape of the terrain in the horizontal plane (from a bird's-eye view) is distorted from a circle. A value of one is a circle, less than one an ellipse, and 0 is a ridge. In the case of a ridge, wind blowing parallel to it does not exert any drag on the flow, but wind blowing perpendicular to it exerts the maximum drag. This parameter does not vary in time. |
benjamin_feir_index | بیبعد | 27830 meters | This parameter is used to calculate the likelihood of freak ocean waves, which are waves that are higher than twice the mean height of the highest third of waves. Large values of this parameter (in practice of the order 1) indicate increased probability of the occurrence of freak waves. The ocean/sea surface wave field consists of a combination of waves with different heights, lengths and directions (known as the two-dimensional wave spectrum). This parameter is derived from the statistics of the two-dimensional wave spectrum. More precisely, it is the square of the ratio of the integral ocean wave steepness and the relative width of the frequency spectrum of the waves. Further information on the calculation of this parameter is given in Section 10.6 of the ECMWF Wave Model documentation. |
boundary_layer_dissipation | ژول بر متر مربع | 27830 meters | This parameter is the accumulated conversion of kinetic energy in the mean flow into heat, over the whole atmospheric column, per unit area, that is due to the effects of stress associated with turbulent eddies near the surface and turbulent orographic form drag. It is calculated by the ECMWF Integrated Forecasting System's turbulent diffusion and turbulent orographic form drag schemes. The turbulent eddies near the surface are related to the roughness of the surface. The turbulent orographic form drag is the stress due to the valleys, hills and mountains on horizontal scales below 5km, which are specified from land surface data at about 1 km resolution. (The dissipation associated with orographic features with horizontal scales between 5 km and the model grid-scale is accounted for by the sub-grid orographic scheme.) This parameter is accumulated over a particular time period which depends on the data extracted. For the reanalysis, the accumulation period is over the 1 hour ending at the validity date and time. For the ensemble members, ensemble mean and ensemble spread, the accumulation period is over the 3 hours ending at the validity date and time. |
boundary_layer_height | متر | 27830 meters | This parameter is the depth of air next to the Earth's surface which is most affected by the resistance to the transfer of momentum, heat or moisture across the surface. The boundary layer height can be as low as a few tens of metres, such as in cooling air at night, or as high as several kilometres over the desert in the middle of a hot sunny day. When the boundary layer height is low, higher concentrations of pollutants (emitted from the Earth's surface) can develop. The boundary layer height calculation is based on the bulk Richardson number (a measure of the atmospheric conditions) following the conclusions of a 2012 review. |
charnock | بیبعد | ۲۷۸۳۰ متر | This parameter accounts for increased aerodynamic roughness as wave heights grow due to increasing surface stress. It depends on the wind speed, wave age and other aspects of the sea state and is used to calculate how much the waves slow down the wind. When the atmospheric model is run without the ocean model, this parameter has a constant value of 0.018. When the atmospheric model is coupled to the ocean model, this parameter is calculated by the ECMWF Wave Model. |
convective_available_potential_energy | ژول/کیلوگرم | 27830 meters | This is an indication of the instability (or stability) of the atmosphere and can be used to assess the potential for the development of convection, which can lead to heavy rainfall, thunderstorms and other severe weather. In the ECMWF Integrated Forecasting System (IFS), CAPE is calculated by considering parcels of air departing at different model levels below the 350 hPa level. If a parcel of air is more buoyant (warmer and/or with more moisture) than its surrounding environment, it will continue to rise (cooling as it rises) until it reaches a point where it no longer has positive buoyancy. CAPE is the potential energy represented by the total excess buoyancy. The maximum CAPE produced by the different parcels is the value retained. Large positive values of CAPE indicate that an air parcel would be much warmer than its surrounding environment and therefore, very buoyant. CAPE is related to the maximum potential vertical velocity of air within an updraft; thus, higher values indicate greater potential for severe weather. Observed values in thunderstorm environments often may exceed 1000 joules per kilogram (J kg^-1), and in extreme cases may exceed 5000 J kg^-1. The calculation of this parameter assumes: (i) the parcel of air does not mix with surrounding air; (ii) ascent is pseudo-adiabatic (all condensed water falls out) and (iii) other simplifications related to the mixed-phase condensational heating. |
convective_inhibition | ژول/کیلوگرم | 27830 meters | This parameter is a measure of the amount of energy required for convection to commence. If the value of this parameter is too high, then deep, moist convection is unlikely to occur even if the convective available potential energy or convective available potential energy shear are large. CIN values greater than 200 J kg^-1 would be considered high. An atmospheric layer where temperature increases with height (known as a temperature inversion) would inhibit convective uplift and is a situation in which convective inhibition would be large. |
duct_base_height | متر | ۲۷۸۳۰ متر | Duct base height as diagnosed from the vertical gradient of atmospheric refractivity. |
eastward_gravity_wave_surface_stress | N/m^2*s | 27830 meters | Air flowing over a surface exerts a stress (drag) that transfers momentum to the surface and slows the wind. This parameter is the component of the accumulated surface stress in an eastward direction, associated with low-level, orographic blocking and orographic gravity waves. It is calculated by the ECMWF Integrated Forecasting System's sub-grid orography scheme, which represents stress due to unresolved valleys, hills and mountains with horizontal scales between 5 km and the model grid-scale. (The stress associated with orographic features with horizontal scales smaller than 5 km is accounted for by the turbulent orographic form drag scheme). Orographic gravity waves are oscillations in the flow maintained by the buoyancy of displaced air parcels, produced when air is deflected upwards by hills and mountains. This process can create stress on the atmosphere at the Earth's surface and at other levels in the atmosphere. Positive (negative) values indicate stress on the surface of the Earth in an eastward (westward) direction. This parameter is accumulated over a particular time period which depends on the data extracted. For the reanalysis, the accumulation period is over the 1 hour ending at the validity date and time. For the ensemble members, ensemble mean and ensemble spread, the accumulation period is over the 3 hours ending at the validity date and time. |
eastward_turbulent_surface_stress | N/m^2*s | 27830 meters | Air flowing over a surface exerts a stress (drag) that transfers momentum to the surface and slows the wind. This parameter is the component of the accumulated surface stress in an eastward direction, associated with turbulent eddies near the surface and turbulent orographic form drag. It is calculated by the ECMWF Integrated Forecasting System's turbulent diffusion and turbulent orographic form drag schemes. The turbulent eddies near the surface are related to the roughness of the surface. The turbulent orographic form drag is the stress due to the valleys, hills and mountains on horizontal scales below 5km, which are specified from land surface data at about 1 km resolution. (The stress associated with orographic features with horizontal scales between 5 km and the model grid-scale is accounted for by the sub-grid orographic scheme.) Positive (negative) values indicate stress on the surface of the Earth in an eastward (westward) direction. This parameter is accumulated over a particular time period which depends on the data extracted. For the reanalysis, the accumulation period is over the 1 hour ending at the validity date and time. For the ensemble members, ensemble mean and ensemble spread, the accumulation period is over the 3 hours ending at the validity date and time. |
forecast_albedo | بیبعد | 27830 meters | This parameter is a measure of the reflectivity of the Earth's surface. It is the fraction of short-wave (solar) radiation reflected by the Earth's surface, for diffuse radiation, assuming a fixed spectrum of downward short-wave radiation at the surface. The values of this parameter vary between zero and one. Typically, snow and ice have high reflectivity with albedo values of 0.8 and above, land has intermediate values between about 0.1 and 0.4 and the ocean has low values of 0.1 or less. Short-wave radiation from the Sun is partly reflected back to space by clouds and particles in the atmosphere (aerosols) and some of it is absorbed. The remainder is incident on the Earth's surface, where some of it is reflected. The portion that is reflected by the Earth's surface depends on the albedo. In the ECMWF Integrated Forecasting System (IFS), a climatological background albedo (observed values averaged over a period of several years) is used, modified by the model over water, ice and snow. Albedo is often shown as a percentage (%). |
forecast_surface_roughness | متر | 27830 meters | This parameter is the aerodynamic roughness length in metres. It is a measure of the surface resistance. This parameter is used to determine the air to surface transfer of momentum. For given atmospheric conditions, a higher surface roughness causes a slower near-surface wind speed. Over ocean, surface roughness depends on the waves. Over land, surface roughness is derived from the vegetation type and snow cover. |
friction_velocity | اماس | 27830 meters | Air flowing over a surface exerts a stress that transfers momentum to the surface and slows the wind. This parameter is a theoretical wind speed at the Earth's surface that expresses the magnitude of stress. It is calculated by dividing the surface stress by air density and taking its square root. For turbulent flow, the friction velocity is approximately constant in the lowest few metres of the atmosphere. This parameter increases with the roughness of the surface. It is used to calculate the way wind changes with height in the lowest levels of the atmosphere. |
gravity_wave_dissipation | ژول بر متر مربع | 27830 meters | This parameter is the accumulated conversion of kinetic energy in the mean flow into heat, over the whole atmospheric column, per unit area, that is due to the effects of stress associated with low-level, orographic blocking and orographic gravity waves. It is calculated by the ECMWF Integrated Forecasting System's sub-grid orography scheme, which represents stress due to unresolved valleys, hills and mountains with horizontal scales between 5 km and the model grid-scale. (The dissipation associated with orographic features with horizontal scales smaller than 5 km is accounted for by the turbulent orographic form drag scheme). Orographic gravity waves are oscillations in the flow maintained by the buoyancy of displaced air parcels, produced when air is deflected upwards by hills and mountains. This process can create stress on the atmosphere at the Earth's surface and at other levels in the atmosphere. This parameter is accumulated over a particular time period which depends on the data extracted. For the reanalysis, the accumulation period is over the 1 hour ending at the validity date and time. For the ensemble members, ensemble mean and ensemble spread, the accumulation period is over the 3 hours ending at the validity date and time. |
instantaneous_eastward_turbulent_surface_stress | N/m^2 | 27830 meters | Air flowing over a surface exerts a stress (drag) that transfers momentum to the surface and slows the wind. This parameter is the component of the surface stress at the specified time, in an eastward direction, associated with turbulent eddies near the surface and turbulent orographic form drag. It is calculated by the ECMWF Integrated Forecasting System's turbulent diffusion and turbulent orographic form drag schemes. The turbulent eddies near the surface are related to the roughness of the surface. The turbulent orographic form drag is the stress due to the valleys, hills and mountains on horizontal scales below 5km, which are specified from land surface data at about 1 km resolution. (The stress associated with orographic features with horizontal scales between 5 km and the model grid-scale is accounted for by the sub-grid orographic scheme.) Positive (negative) values indicate stress on the surface of the Earth in an eastward (westward) direction. |
instantaneous_moisture_flux | کیلوگرم بر متر مربع بر ثانیه | 27830 meters | This parameter is the net rate of moisture exchange between the land/ocean surface and the atmosphere, due to the processes of evaporation (including evapotranspiration) and condensation, at the specified time. By convention, downward fluxes are positive, which means that evaporation is represented by negative values and condensation by positive values. |
instantaneous_northward_turbulent_surface_stress | N/m^2 | 27830 meters | Air flowing over a surface exerts a stress (drag) that transfers momentum to the surface and slows the wind. This parameter is the component of the surface stress at the specified time, in a northward direction, associated with turbulent eddies near the surface and turbulent orographic form drag. It is calculated by the ECMWF Integrated Forecasting System's turbulent diffusion and turbulent orographic form drag schemes. The turbulent eddies near the surface are related to the roughness of the surface. The turbulent orographic form drag is the stress due to the valleys, hills and mountains on horizontal scales below 5km, which are specified from land surface data at about 1 km resolution. (The stress associated with orographic features with horizontal scales between 5 km and the model grid-scale is accounted for by the sub-grid orographic scheme.) Positive (negative) values indicate stress on the surface of the Earth in a northward (southward) direction. |
k_index | ک | 27830 meters | This parameter is a measure of the potential for a thunderstorm to develop, calculated from the temperature and dew point temperature in the lower part of the atmosphere. The calculation uses the temperature at 850, 700 and 500 hPa and dewpoint temperature at 850 and 700 hPa. Higher values of K indicate a higher potential for the development of thunderstorms. This parameter is related to the probability of occurrence of a thunderstorm: <20 K No thunderstorm, 20-25 K Isolated thunderstorms, 26-30 K Widely scattered thunderstorms, 31-35 K Scattered thunderstorms, >35 K Numerous thunderstorms. |
land_sea_mask | بیبعد | 27830 meters | This parameter is the proportion of land, as opposed to ocean or inland waters (lakes, reservoirs, rivers and coastal waters), in a grid box. This parameter has values ranging between zero and one and is dimensionless. In cycles of the ECMWF Integrated Forecasting System (IFS) from CY41R1 (introduced in May 2015) onwards, grid boxes where this parameter has a value above 0.5 can be comprised of a mixture of land and inland water but not ocean. Grid boxes with a value of 0.5 and below can only be comprised of a water surface. In the latter case, the lake cover is used to determine how much of the water surface is ocean or inland water. In cycles of the IFS before CY41R1, grid boxes where this parameter has a value above 0.5 can only be comprised of land and those grid boxes with a value of 0.5 and below can only be comprised of ocean. In these older model cycles, there is no differentiation between ocean and inland water. This parameter does not vary in time. |
mean_vertical_gradient_of_refractivity_inside_trapping_layer | m^-1 | 27830 meters | Mean vertical gradient of atmospheric refractivity inside the trapping layer. |
minimum_vertical_gradient_of_refractivity_inside_trapping_layer | m^-1 | 27830 meters | Minimum vertical gradient of atmospheric refractivity inside the trapping layer. |
northward_gravity_wave_surface_stress | N/m^2*s | 27830 meters | Air flowing over a surface exerts a stress (drag) that transfers momentum to the surface and slows the wind. This parameter is the component of the accumulated surface stress in a northward direction, associated with low-level, orographic blocking and orographic gravity waves. It is calculated by the ECMWF Integrated Forecasting System's sub-grid orography scheme, which represents stress due to unresolved valleys, hills and mountains with horizontal scales between 5 km and the model grid-scale. (The stress associated with orographic features with horizontal scales smaller than 5 km is accounted for by the turbulent orographic form drag scheme). Orographic gravity waves are oscillations in the flow maintained by the buoyancy of displaced air parcels, produced when air is deflected upwards by hills and mountains. This process can create stress on the atmosphere at the Earth's surface and at other levels in the atmosphere. Positive (negative) values indicate stress on the surface of the Earth in a northward (southward) direction. This parameter is accumulated over a particular time period which depends on the data extracted. For the reanalysis, the accumulation period is over the 1 hour ending at the validity date and time. For the ensemble members, ensemble mean and ensemble spread, the accumulation period is over the 3 hours ending at the validity date and time. |
northward_turbulent_surface_stress | N/m^2*s | 27830 meters | Air flowing over a surface exerts a stress (drag) that transfers momentum to the surface and slows the wind. This parameter is the component of the accumulated surface stress in a northward direction, associated with turbulent eddies near the surface and turbulent orographic form drag. It is calculated by the ECMWF Integrated Forecasting System's turbulent diffusion and turbulent orographic form drag schemes. The turbulent eddies near the surface are related to the roughness of the surface. The turbulent orographic form drag is the stress due to the valleys, hills and mountains on horizontal scales below 5km, which are specified from land surface data at about 1 km resolution. (The stress associated with orographic features with horizontal scales between 5 km and the model grid-scale is accounted for by the sub-grid orographic scheme.) Positive (negative) values indicate stress on the surface of the Earth in a northward (southward) direction. This parameter is accumulated over a particular time period which depends on the data extracted. For the reanalysis, the accumulation period is over the 1 hour ending at the validity date and time. For the ensemble members, ensemble mean and ensemble spread, the accumulation period is over the 3 hours ending at the validity date and time. |
sea_ice_cover | بیبعد | 27830 meters | This parameter is the fraction of a grid box which is covered by sea ice. Sea ice can only occur in a grid box which includes ocean or inland water according to the land-sea mask and lake cover, at the resolution being used. This parameter can be known as sea-ice (area) fraction, sea-ice concentration and more generally as sea-ice cover. In ERA5, sea-ice cover is given by two external providers. Before 1979 the HadISST2 dataset is used. From 1979 to August 2007 the OSI SAF (409a) dataset is used and from September 2007 the OSI SAF oper dataset is used. Sea ice is frozen sea water which floats on the surface of the ocean. Sea ice does not include ice which forms on land such as glaciers, icebergs and ice-sheets. It also excludes ice shelves which are anchored on land, but protrude out over the surface of the ocean. These phenomena are not modelled by the IFS. Long-term monitoring of sea ice is important for understanding climate change. Sea ice also affects shipping routes through the polar regions. |
skin_reservoir_content | متر | 27830 meters | This parameter is the amount of water in the vegetation canopy and/or in a thin layer on the soil. It represents the amount of rain intercepted by foliage, and water from dew. The maximum amount of "skin reservoir content" a grid box can hold depends on the type of vegetation, and may be zero. Water leaves the "skin reservoir" by evaporation. |
slope_of_sub_gridscale_orography | بیبعد | 27830 meters | This parameter is one of four parameters (the others being standard deviation, angle and anisotropy) that describe the features of the orography that are too small to be resolved by the model grid. These four parameters are calculated for orographic features with horizontal scales comprised between 5 km and the model grid resolution, being derived from the height of valleys, hills and mountains at about 1 km resolution. They are used as input for the sub-grid orography scheme which represents low-level blocking and orographic gravity wave effects. This parameter represents the slope of the sub-grid valleys, hills and mountains. A flat surface has a value of 0, and a 45 degree slope has a value of 0.5. This parameter does not vary in time. |
standard_deviation_of_filtered_subgrid_orography | متر | 27830 meters | Climatological parameter (scales between approximately 3 and 22 km are included). This parameter does not vary in time. |
standard_deviation_of_orography | بیبعد | 27830 meters | This parameter is one of four parameters (the others being angle of sub-gridscale orography, slope and anisotropy) that describe the features of the orography that are too small to be resolved by the model grid. These four parameters are calculated for orographic features with horizontal scales comprised between 5 km and the model grid resolution, being derived from the height of valleys, hills and mountains at about 1 km resolution. They are used as input for the sub-grid orography scheme which represents low-level blocking and orographic gravity wave effects. This parameter represents the standard deviation of the height of the sub-grid valleys, hills and mountains within a grid box. This parameter does not vary in time. |
total_column_ozone | کیلوگرم بر متر مربع | 27830 meters | This parameter is the total amount of ozone in a column of air extending from the surface of the Earth to the top of the atmosphere. This parameter can also be referred to as total ozone, or vertically integrated ozone. The values are dominated by ozone within the stratosphere. In the ECMWF Integrated Forecasting System (IFS), there is a simplified representation of ozone chemistry (including representation of the chemistry which has caused the ozone hole). Ozone is also transported around in the atmosphere through the motion of air. Naturally occurring ozone in the stratosphere helps protect organisms at the surface of the Earth from the harmful effects of ultraviolet (UV) radiation from the Sun. Ozone near the surface, often produced because of pollution, is harmful to organisms. In the IFS, the units for total ozone are kilograms per square metre, but before 12/06/2001 dobson units were used. Dobson units (DU) are still used extensively for total column ozone. 1 DU = 2.1415E-5 kg m^-2 |
total_column_supercooled_liquid_water | کیلوگرم بر متر مربع | 27830 meters | This parameter is the total amount of supercooled water in a column extending from the surface of the Earth to the top of the atmosphere. Supercooled water is water that exists in liquid form below 0oC. It is common in cold clouds and is important in the formation of precipitation. Also, supercooled water in clouds extending to the surface (ie, fog) can cause icing/riming of various structures. This parameter represents the area averaged value for a grid box. Clouds contain a continuum of different sized water droplets and ice particles. The ECMWF Integrated Forecasting System (IFS) cloud scheme simplifies this to represent a number of discrete cloud droplets/particles including: cloud water droplets, raindrops, ice crystals and snow (aggregated ice crystals). The processes of droplet formation, conversion and aggregation are also highly simplified in the IFS. |
total_column_water | کیلوگرم بر متر مربع | 27830 meters | This parameter is the sum of water vapour, liquid water, cloud ice, rain and snow in a column extending from the surface of the Earth to the top of the atmosphere. In old versions of the ECMWF model (IFS), rain and snow were not accounted for. |
total_column_water_vapour | کیلوگرم بر متر مربع | 27830 meters | This parameter is the total amount of water vapour in a column extending from the surface of the Earth to the top of the atmosphere. This parameter represents the area averaged value for a grid box. |
total_totals_index | ک | 27830 meters | This parameter gives an indication of the probability of occurrence of a thunderstorm and its severity by using the vertical gradient of temperature and humidity. The values of this index indicate the following: <44 Thunderstorms not likely, 44-50 Thunderstorms likely, 51-52 Isolated severe thunderstorms, 53-56 Widely scattered severe thunderstorms, 56-60 Scattered severe thunderstorms more likely. The total totals index is the temperature difference between 850 hPa (near surface) and 500 hPa (mid-troposphere) (lapse rate) plus a measure of the moisture content between 850 hPa and 500 hPa. The probability of deep convection tends to increase with increasing lapse rate and atmospheric moisture content. There are a number of limitations to this index. Also, the interpretation of the index value varies with season and location. |
trapping_layer_base_height | متر | 27830 meters | Trapping layer base height as diagnosed from the vertical gradient of atmospheric refractivity. |
trapping_layer_top_height | متر | 27830 meters | Trapping layer top height as diagnosed from the vertical gradient of atmospheric refractivity. |
u_component_stokes_drift | اماس | 27830 meters | This parameter is the eastward component of the surface Stokes drift. The Stokes drift is the net drift velocity due to surface wind waves. It is confined to the upper few metres of the ocean water column, with the largest value at the surface. For example, a fluid particle near the surface will slowly move in the direction of wave propagation. |
v_component_stokes_drift | اماس | 27830 meters | This parameter is the northward component of the surface Stokes drift. The Stokes drift is the net drift velocity due to surface wind waves. It is confined to the upper few metres of the ocean water column, with the largest value at the surface. For example, a fluid particle near the surface will slowly move in the direction of wave propagation. |
vertical_integral_of_northward_total_energy_flux | W/m | 27830 meters | This parameter is the horizontal rate of flow of total energy in the northward direction, per metre across the flow, for a column of air extending from the surface of the Earth to the top of the atmosphere. Positive values indicate a flux from south to north. Total atmospheric energy is made up of internal, potential, kinetic and latent energy. This parameter can be used to study the atmospheric energy budget. |
vertical_integral_of_northward_water_vapour_flux | kg/m/s | 27830 meters | This parameter is the horizontal rate of flow of water vapour, in the northward direction, per metre across the flow, for a column of air extending from the surface of the Earth to the top of the atmosphere. Positive values indicate a flux from south to north. |
vertical_integral_of_potential_and_internal_energy | ژول بر متر مربع | 27830 meters | This parameter is the mass weighted vertical integral of potential and internal energy for a column of air extending from the surface of the Earth to the top of the atmosphere. The potential energy of an air parcel is the amount of work that would have to be done, against the force of gravity, to lift the air to that location from mean sea level. Internal energy is the energy contained within a system ie, the microscopic energy of the air molecules, rather than the macroscopic energy associated with, for example, wind, or gravitational potential energy. This parameter can be used to study the atmospheric energy budget. Total atmospheric energy is made up of internal, potential, kinetic and latent energy. |
vertical_integral_of_potential_internal_and_latent_energy | ژول بر متر مربع | 27830 meters | This parameter is the mass weighted vertical integral of potential, internal and latent energy for a column of air extending from the surface of the Earth to the top of the atmosphere. The potential energy of an air parcel is the amount of work that would have to be done, against the force of gravity, to lift the air to that location from mean sea level. Internal energy is the energy contained within a system ie, the microscopic energy of the air molecules, rather than the macroscopic energy associated with, for example, wind, or gravitational potential energy. The latent energy refers to the energy associated with the water vapour in the atmosphere and is equal to the energy required to convert liquid water into water vapour. This parameter can be used to study the atmospheric energy budget. Total atmospheric energy is made up of internal, potential, kinetic and latent energy. |
vertical_integral_of_temperature | K/kg/m^2 | 27830 meters | This parameter is the mass-weighted vertical integral of temperature for a column of air extending from the surface of the Earth to the top of the atmosphere. This parameter can be used to study the atmospheric energy budget. |
vertical_integral_of_thermal_energy | ژول بر متر مربع | 27830 meters | This parameter is the mass-weighted vertical integral of thermal energy for a column of air extending from the surface of the Earth to the top of the atmosphere. Thermal energy is calculated from the product of temperature and the specific heat capacity of air at constant pressure. The thermal energy is equal to enthalpy, which is the sum of the internal energy and the energy associated with the pressure of the air on its surroundings. Internal energy is the energy contained within a system ie, the microscopic energy of the air molecules, rather than the macroscopic energy associated with, for example, wind, or gravitational potential energy. The energy associated with the pressure of the air on its surroundings is the energy required to make room for the system by displacing its surroundings and is calculated from the product of pressure and volume. This parameter can be used to study the atmospheric energy budget. Total atmospheric energy is made up of internal, potential, kinetic and latent energy. |
vertical_integral_of_total_energy | ژول بر متر مربع | 27830 meters | This parameter is the vertical integral of total energy for a column of air extending from the surface of the Earth to the top of the atmosphere. Total atmospheric energy is made up of internal, potential, kinetic and latent energy. This parameter can be used to study the atmospheric energy budget. |
vertically_integrated_moisture_divergence | کیلوگرم بر متر مربع | 27830 meters | The vertical integral of the moisture flux is the horizontal rate of flow of moisture (water vapour, cloud liquid and cloud ice), per metre across the flow, for a column of air extending from the surface of the Earth to the top of the atmosphere. Its horizontal divergence is the rate of moisture spreading outward from a point, per square metre. This parameter is accumulated over a particular time period which depends on the data extracted. For the reanalysis, the accumulation period is over the 1 hour ending at the validity date and time. For the ensemble members, ensemble mean and ensemble spread, the accumulation period is over the 3 hours ending at the validity date and time. This parameter is positive for moisture that is spreading out, or diverging, and negative for the opposite, for moisture that is concentrating, or converging (convergence). This parameter thus indicates whether atmospheric motions act to decrease (for divergence) or increase (for convergence) the vertical integral of moisture, over the time period. High negative values of this parameter (ie large moisture convergence) can be related to precipitation intensification and floods. 1 kg of water spread over 1 square metre of surface is 1 mm deep (neglecting the effects of temperature on the density of water), therefore the units are equivalent to mm. |
volumetric_soil_water_layer_1 | بیبعد | 27830 meters | This parameter is the volume of water in soil layer 1 (0 - 7cm, the surface is at 0cm). The ECMWF Integrated Forecasting System (IFS) has a four-layer representation of soil: Layer 1: 0 - 7cm, Layer 2: 7 - 28cm, Layer 3: 28 - 100cm, Layer 4: 100 - 289cm. Soil water is defined over the whole globe, even over ocean. Regions with a water surface can be masked out by only considering grid points where the land-sea mask has a value greater than 0.5. The volumetric soil water is associated with the soil texture (or classification), soil depth, and the underlying groundwater level. |
volumetric_soil_water_layer_2 | بیبعد | 27830 meters | This parameter is the volume of water in soil layer 2 (7 - 28cm, the surface is at 0cm). The ECMWF Integrated Forecasting System (IFS) has a four-layer representation of soil: Layer 1: 0 - 7cm, Layer 2: 7 - 28cm, Layer 3: 28 - 100cm, Layer 4: 100 - 289cm. Soil water is defined over the whole globe, even over ocean. Regions with a water surface can be masked out by only considering grid points where the land-sea mask has a value greater than 0.5. The volumetric soil water is associated with the soil texture (or classification), soil depth, and the underlying groundwater level. |
volumetric_soil_water_layer_3 | بیبعد | 27830 meters | This parameter is the volume of water in soil layer 3 (28 - 100cm, the surface is at 0cm). The ECMWF Integrated Forecasting System (IFS) has a four-layer representation of soil: Layer 1: 0 - 7cm, Layer 2: 7 - 28cm, Layer 3: 28 - 100cm, Layer 4: 100 - 289cm. Soil water is defined over the whole globe, even over ocean. Regions with a water surface can be masked out by only considering grid points where the land-sea mask has a value greater than 0.5. The volumetric soil water is associated with the soil texture (or classification), soil depth, and the underlying groundwater level. |
volumetric_soil_water_layer_4 | بیبعد | 27830 meters | This parameter is the volume of water in soil layer 4 (100 - 289cm, the surface is at 0cm). The ECMWF Integrated Forecasting System (IFS) has a four-layer representation of soil: Layer 1: 0 - 7cm, Layer 2: 7 - 28cm, Layer 3: 28 - 100cm, Layer 4: 100 - 289cm. Soil water is defined over the whole globe, even over ocean. Regions with a water surface can be masked out by only considering grid points where the land-sea mask has a value greater than 0.5. The volumetric soil water is associated with the soil texture (or classification), soil depth, and the underlying groundwater level. |
wave_spectral_directional_width | راد | 27830 meters | This parameter indicates whether waves (generated by local winds and associated with swell) are coming from similar directions or from a wide range of directions. The ocean/sea surface wave field consists of a combination of waves with different heights, lengths and directions (known as the two-dimensional wave spectrum). Many ECMWF wave parameters (such as the mean wave period) give information averaged over all wave frequencies and directions, so do not give any information about the distribution of wave energy across frequencies and directions. This parameter gives more information about the nature of the two-dimensional wave spectrum. This parameter is a measure of the range of wave directions for each frequency integrated across the two-dimensional spectrum. This parameter takes values between 0 and the square root of 2. Where 0 corresponds to a uni-directional spectrum (ie, all wave frequencies from the same direction) and the square root of 2 indicates a uniform spectrum (ie, all wave frequencies from a different direction). |
wave_spectral_directional_width_for_swell | راد | 27830 meters | This parameter indicates whether waves associated with swell are coming from similar directions or from a wide range of directions. The ocean/sea surface wave field consists of a combination of waves with different heights, lengths and directions (known as the two-dimensional wave spectrum). The wave spectrum can be decomposed into wind-sea waves, which are directly affected by local winds, and swell, the waves that were generated by the wind at a different location and time. This parameter takes account of all swell only. Many ECMWF wave parameters (such as the mean wave period) give information averaged over all wave frequencies and directions, so do not give any information about the distribution of wave energy across frequencies and directions. This parameter gives more information about the nature of the two-dimensional wave spectrum. This parameter is a measure of the range of wave directions for each frequency integrated across the two-dimensional spectrum. This parameter takes values between 0 and the square root of 2. Where 0 corresponds to a uni-directional spectrum (ie, all wave frequencies from the same direction) and the square root of 2 indicates a uniform spectrum (ie, all wave frequencies from a different direction). |
wave_spectral_directional_width_for_wind_waves | راد | 27830 meters | This parameter indicates whether waves generated by the local wind are coming from similar directions or from a wide range of directions. The ocean/sea surface wave field consists of a combination of waves with different heights, lengths and directions (known as the two-dimensional wave spectrum). The wave spectrum can be decomposed into wind-sea waves, which are directly affected by local winds, and swell, the waves that were generated by the wind at a different location and time. This parameter takes account of wind-sea waves only. Many ECMWF wave parameters (such as the mean wave period) give information averaged over all wave frequencies and directions, so do not give any information about the distribution of wave energy across frequencies and directions. This parameter gives more information about the nature of the two-dimensional wave spectrum. This parameter is a measure of the range of wave directions for each frequency integrated across the two-dimensional spectrum. This parameter takes values between 0 and the square root of 2. Where 0 corresponds to a uni-directional spectrum (ie, all wave frequencies from the same direction) and the square root of 2 indicates a uniform spectrum (ie, all wave frequencies from a different direction). |
wave_spectral_kurtosis | بیبعد | 27830 meters | This parameter is a statistical measure used to forecast extreme or freak ocean/sea waves. It describes the nature of the sea surface elevation and how it is affected by waves generated by local winds and associated with swell. Under typical conditions, the sea surface elevation, as described by its probability density function, has a near normal distribution in the statistical sense. However, under certain wave conditions the probability density function of the sea surface elevation can deviate considerably from normality, signalling increased probability of freak waves. This parameter gives one measure of the deviation from normality. It shows how much of the probability density function of the sea surface elevation exists in the tails of the distribution. So, a positive kurtosis (typical range 0.0 to 0.06) means more frequent occurrences of very extreme values (either above or below the mean), relative to a normal distribution. |
wave_spectral_peakedness | بیبعد | 27830 meters | This parameter is a statistical measure used to forecast extreme or freak waves. It is a measure of the relative width of the ocean/sea wave frequency spectrum (ie, whether the ocean/sea wave field is made up of a narrow or broad range of frequencies). The ocean/sea surface wave field consists of a combination of waves with different heights, lengths and directions (known as the two-dimensional wave spectrum). When the wave field is more focussed around a narrow range of frequencies, the probability of freak/extreme waves increases. This parameter is Goda's peakedness factor and is used to calculate the Benjamin-Feir Index (BFI). The BFI is in turn used to estimate the probability and nature of extreme/freak waves. |
wave_spectral_skewness | بیبعد | 27830 meters | This parameter is a statistical measure used to forecast extreme or freak ocean/sea waves. It describes the nature of the sea surface elevation and how it is affected by waves generated by local winds and associated with swell. Under typical conditions, the sea surface elevation, as described by its probability density function, has a near normal distribution in the statistical sense. However, under certain wave conditions the probability density function of the sea surface elevation can deviate considerably from normality, signalling increased probability of freak waves. This parameter gives one measure of the deviation from normality. It is a measure of the asymmetry of the probability density function of the sea surface elevation. So, a positive/negative skewness (typical range -0.2 to 0.12) means more frequent occurrences of extreme values above/below the mean, relative to a normal distribution. |
zero_degree_level | متر | 27830 meters | The height above the Earth's surface where the temperature passes from positive to negative values, corresponding to the top of a warm layer, at the specified time. This parameter can be used to help forecast snow. If more than one warm layer is encountered, then the zero degree level corresponds to the top of the second atmospheric layer. This parameter is set to zero when the temperature in the whole atmosphere is below 0°C. |
wind_gust_since_previous_post_processing_10m | اماس | 27830 meters | Maximum 3 second wind at 10 m height as defined by WMO. Parametrization represents turbulence only before 01102008; thereafter effects of convection are included. The 3 s gust is computed every time step and and the maximum is kept since the last postprocessing. |
geopotential | متر مربع/ثانیه^۲ | 27830 meters | This parameter is the gravitational potential energy of a unit mass, at a particular location at the surface of the Earth, relative to mean sea level. It is also the amount of work that would have to be done, against the force of gravity, to lift a unit mass to that location from mean sea level. The (surface) geopotential height (orography) can be calculated by dividing the (surface) geopotential by the Earth's gravitational acceleration, g (=9.80665 ms^-2 ). This parameter does not vary in time. |
maximum_2m_temperature_since_previous_post_processing | ک | 27830 meters | This parameter is the highest temperature of air at 2m above the surface of land, sea or inland water since the parameter was last archived in a particular forecast. 2m temperature is calculated by interpolating between the lowest model level and the Earth's surface, taking account of the atmospheric conditions. |
maximum_total_precipitation_rate_since_previous_post_processing | کیلوگرم بر متر مربع بر ثانیه | 27830 meters | The total precipitation is calculated from the combined large-scale and convective rainfall and snowfall rates every time step and the maximum is kept since the last postprocessing. |
minimum_2m_temperature_since_previous_post_processing | ک | 27830 meters | This parameter is the lowest temperature of air at 2m above the surface of land, sea or inland waters since the parameter was last archived in a particular forecast. 2m temperature is calculated by interpolating between the lowest model level and the Earth's surface, taking account of the atmospheric conditions. See further information. |
minimum_total_precipitation_rate_since_previous_post_processing | کیلوگرم بر متر مربع بر ثانیه | 27830 meters | The total precipitation is calculated from the combined large-scale and convective rainfall and snowfall rates every time step and the minimum is kept since the last postprocessing. |
divergence_500hPa | کیلوگرم بر متر مربع بر ثانیه | 27830 meters | The divergence of the wind at the 500hPa pressure level. |
divergence_850hPa | کیلوگرم بر متر مربع بر ثانیه | 27830 meters | The divergence of the wind at the 850hPa pressure level. |
fraction_of_cloud_cover_500hPa | بیبعد | 27830 meters | The fraction of cloud cover at the 500hPa pressure level. |
fraction_of_cloud_cover_850hPa | بیبعد | 27830 meters | The fraction of cloud cover at the 850hPa pressure level. |
ozone_mass_mixing_ratio_500hPa | بیبعد | 27830 meters | The mass mixing ratio of ozone at the 500hPa pressure level. |
ozone_mass_mixing_ratio_850hPa | بیبعد | 27830 meters | The mass mixing ratio of ozone at the 850hPa pressure level. |
potential_vorticity_500hPa | K*m^2/kg/s | 27830 meters | The potential vorticity at the 500hPa pressure level. |
potential_vorticity_850hPa | K*m^2/kg/s | 27830 meters | The potential vorticity at the 850hPa pressure level. |
relative_humidity_500hPa | % | 27830 meters | The relative humidity at the 500hPa pressure level. |
relative_humidity_850hPa | % | 27830 meters | The relative humidity at the 850hPa pressure level. |
specific_cloud_ice_water_content_500hPa | بیبعد | 27830 meters | The specific cloud ice water content at the 500hPa pressure level. |
specific_cloud_ice_water_content_850hPa | بیبعد | 27830 meters | The specific cloud ice water content at the 850hPa pressure level. |
specific_cloud_liquid_water_content_500hPa | بیبعد | 27830 meters | The specific cloud liquid water content at the 500hPa pressure level. |
specific_cloud_liquid_water_content_850hPa | بیبعد | 27830 meters | The specific cloud liquid water content at the 850hPa pressure level. |
specific_humidity_500hPa | بیبعد | 27830 meters | The specific humidity at the 500hPa pressure level. |
specific_humidity_850hPa | بیبعد | 27830 meters | The specific humidity at the 850hPa pressure level. |
specific_rain_water_content_500hPa | بیبعد | 27830 meters | The specific rain water content at the 500hPa pressure level. |
specific_rain_water_content_850hPa | بیبعد | 27830 meters | The specific rain water content at the 850hPa pressure level. |
specific_snow_water_content_500hPa | بیبعد | 27830 meters | The specific snow water content at the 500hPa pressure level. |
specific_snow_water_content_850hPa | بیبعد | 27830 meters | The specific snow water content at the 850hPa pressure level. |
temperature_500hPa | ک | 27830 meters | The temperature at the 500hPa pressure level. |
temperature_850hPa | ک | 27830 meters | The temperature at the 850hPa pressure level. |
u_component_of_wind_500hPa | اماس | 27830 meters | The eastward component of the wind at the 500hPa pressure level. |
u_component_of_wind_850hPa | اماس | 27830 meters | The eastward component of the wind at the 850hPa pressure level. |
v_component_of_wind_500hPa | اماس | 27830 meters | The northward component of the wind at the 500hPa pressure level. |
v_component_of_wind_850hPa | اماس | 27830 meters | The northward component of the wind at the 850hPa pressure level. |
vertical_velocity_500hPa | پاسکال بر ثانیه | ۲۷۸۳۰ متر | The vertical velocity at the 500hPa pressure level. |
vertical_velocity_850hPa | پاسکال بر ثانیه | 27830 meters | The vertical velocity at the 850hPa pressure level. |
vorticity_500hPa | K*m^2/kg/s | 27830 meters | The vorticity of the wind at the 500hPa pressure level. |
vorticity_850hPa | K*m^2/kg/s | 27830 meters | The vorticity of the wind at the 850hPa pressure level. |
ویژگیهای تصویر
ویژگیهای تصویر
| نام | نوع | توضیحات |
|---|---|---|
| ساعت | داخلی | Hour of the day |
شرایط استفاده
شرایط استفاده
Please acknowledge the use of ERA5 as stated in the Copernicus C3S/CAMS License agreement .
نقل قولها
Hersbach, H., Bell, B., Berrisford, P., Hirahara, S., Horanyi, A., Munoz-Sabater, J., ... & Thepaut, JN (2020). The ERA5 global reanalysis. Quarterly Journal of the Royal Meteorological Society, 146(730), 1999-2049.
با موتور زمین کاوش کنید
ویرایشگر کد (جاوااسکریپت)
var dataset = ee.ImageCollection('ECMWF/ERA5/HOURLY')
                .filter(ee.Filter.date('2020-07-01', '2020-07-02'));

var visualization = {
  bands: ['temperature_2m'],
  min: 250.0,
  max: 320.0,
  palette: [
    '000080', '0000d9', '4000ff', '8000ff', '0080ff', '00ffff',
    '00ff80', '80ff00', 'daff00', 'ffff00', 'fff500', 'ffda00',
    'ffb000', 'ffa400', 'ff4f00', 'ff2500', 'ff0a00', 'ff00ff',
  ]
};

Map.setCenter(22.2, 21.2, 3);

Map.addLayer(dataset, visualization, 'Air temperature [K] at 2m height');