Page Summary
-
This dataset provides estimated global human population counts for the years 2000, 2005, 2010, 2015, and 2020 on a 30 arc-second grid.
-
The population data is based on census and administrative units and is distributed proportionally to grid cells.
-
The dataset is available from 2000 to 2020 with a cadence of 5 years and has a pixel size of approximately 927.67 meters.
-
This specific version of the dataset has been superseded by CIESIN/GPWv411/GPW_Population_Count.
- Dataset Availability
- 2000-01-01T00:00:00Z–2020-01-01T00:00:00Z
- Dataset Producer
- CIESIN
- Cadence
- 5 Years
- Tags
Description
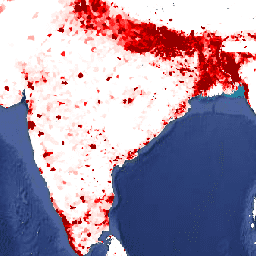
The Gridded Population of World Version 4 (GPWv4) models the distribution of global human population for the years 2000, 2005, 2010, 2015, and 2020 on 30 arc-second (approximately 1 km) grid cells. Population is distributed to cells using proportional allocation of population from census and administrative units. Population input data are collected at the most detailed spatial resolution available from the results of the 2010 round of censuses, which occurred between 2005 and 2014. The input data are extrapolated to produce population estimates for each modeled year.
These population count grids contain estimates of the number of persons per 30 arc-second grid cell consistent with national censuses and population registers. There is one image for each modeled year.
Bands
Bands
Pixel size: 927.67 meters (all bands)
| Name | Min | Max | Pixel Size | Description |
|---|---|---|---|---|
population-count |
0* | 970919* | 927.67 meters | The estimated number of persons per 30 arc-second grid cell. |
Terms of Use
Terms of Use
Citations
Center for International Earth Science Information Network - CIESIN - Columbia University. 2016. Gridded Population of the World, Version 4 (GPWv4): Population Count. Palisades, NY: NASA Socioeconomic Data and Applications Center (SEDAC). https://doi.org/10.7927/H4X63JVC. Accessed DAY MONTH YEAR.
DOIs
Explore with Earth Engine
Code Editor (JavaScript)
var dataset = ee.ImageCollection('CIESIN/GPWv4/population-count');
var populationCount = dataset.select('population-count')
  .filter(ee.Filter.date('2010-01-01', '2010-12-31'));
var populationCountVis = {
  min: 200.0,
  max: 1000.0,
  palette: ['ffffff', 'ffcdc6', 'ff0000', '950000'],
};
Map.setCenter(79.1, 19.81, 3);
Map.addLayer(populationCount, populationCountVis, 'Population Count');