
Distributed tracing is important to gain insight and observability to a multi-tier microservices architecture. When you have chained service to service calls, from service A to service B to service C, it's important to understand that the calls were successful and also the latency at every step.
In Spring Boot, you can use Spring Cloud Sleuth to seamlessly add the distributed tracing instrumentation to your application. By default, it can forward the trace data to Zipkin.
Google Cloud Platform has Stackdriver Trace, which is a managed service that allows you to store trace data without having to manage your own Zipkin instance nor storage. Stackdriver Trace can also produce latency distribution reports and automatically detect performance regressions.
You have two options to use Stackdriver Trace from a Spring Boot application:
- Use a Stackdriver Trace Zipkin Proxy and simply configure Spring Cloud Sleuth to use this proxy as the Zipkin endpoint
- Or, use Spring Cloud GCP Trace, which seamlessly integrates with Spring Cloud Sleuth and forwards the trace data directly to Stackdriver Trace.
In this codelab, you will learn how to build a new Spring Boot application and use Spring Cloud GCP Trace for distributed tracing.
What you'll learn
- How to create a Spring Boot Java application and configure Stackdriver Trace.
What you'll need
- A Google Cloud Platform Project
- A Browser, such Chrome or Firefox
- Familiarity with standard Linux text editors such as Vim, EMACs or Nano
How will you use use this tutorial?
How would you rate your experience with building HTML/CSS web apps?
How would you rate your experience with using Google Cloud Platform services?
Self-paced environment setup
If you don't already have a Google Account (Gmail or Google Apps), you must create one. Sign-in to Google Cloud Platform console (console.cloud.google.com) and create a new project:


Remember the project ID, a unique name across all Google Cloud projects (the name above has already been taken and will not work for you, sorry!). It will be referred to later in this codelab as PROJECT_ID.
Next, you'll need to enable billing in the Cloud Console in order to use Google Cloud resources.
Running through this codelab shouldn't cost you more than a few dollars, but it could be more if you decide to use more resources or if you leave them running (see "cleanup" section at the end of this document).
New users of Google Cloud Platform are eligible for a $300 free trial.
Google Cloud Shell
While Google Cloud and Kubernetes can be operated remotely from your laptop, in this codelab we will be using Google Cloud Shell, a command line environment running in the Cloud.
Activate Google Cloud Shell
From the GCP Console click the Cloud Shell icon on the top right toolbar:

Then click "Start Cloud Shell":

It should only take a few moments to provision and connect to the environment:

This virtual machine is loaded with all the development tools you'll need. It offers a persistent 5GB home directory, and runs on the Google Cloud, greatly enhancing network performance and authentication. Much, if not all, of your work in this lab can be done with simply a browser or your Google Chromebook.
Once connected to Cloud Shell, you should see that you are already authenticated and that the project is already set to your PROJECT_ID.
Run the following command in Cloud Shell to confirm that you are authenticated:
gcloud auth list
Command output
Credentialed accounts:
 - <myaccount>@<mydomain>.com (active)
gcloud config list project
Command output
[core]
project = <PROJECT_ID>
If it is not, you can set it with this command:
gcloud config set project <PROJECT_ID>
Command output
Updated property [core/project].
After Cloud Shell launches, you can use the command line to generate a new Spring Boot application with Spring Initializr:
$ curl https://start.spring.io/starter.tgz -d packaging=jar \
  -d dependencies=web,lombok,cloud-gcp,cloud-starter-sleuth \
  -d baseDir=trace-service-one | tar -xzvf - \
  && cd trace-service-one
Create a new REST controller by adding a new class:
src/main/java/com/example/demo/WorkController.java
package com.example.demo;

import lombok.extern.slf4j.Slf4j;
import org.springframework.web.bind.annotation.GetMapping;
import org.springframework.web.bind.annotation.RestController;

import java.util.Random;

@RestController
@Slf4j
public class WorkController {
  Random r = new Random();

  public void meeting() {
    try {
      log.info("meeting...");
      // Delay for random number of milliseconds.
      Thread.sleep(r.nextInt(500));
    } catch (InterruptedException e) {
    }
  }

  @GetMapping("/")
  public String work() {
    // What is work? Meetings!
    // When you hit this URL, it'll call meetings() 5 times.
    // Each time will have a random delay.
    log.info("starting to work");
    for (int i = 0; i < 5; i++) {
      this.meeting();
    }
    log.info("finished!");
    return "finished work!";
  }
}
You can start the Spring Boot application normally with the Spring Boot plugin. Let's skip tests for this lab:
$ ./mvnw -DskipTests spring-boot:runOnce the application started, click on the Web Preview icon  in the Cloud Shell toolbar and choose preview on port 8080.

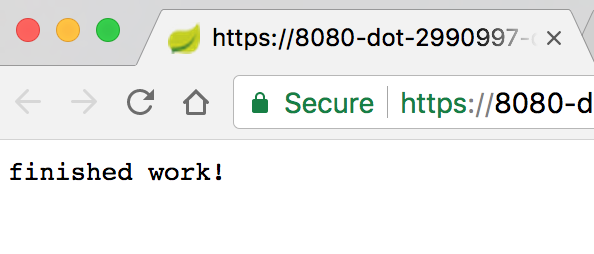
After a short wait you should see the result:
In Cloud Shell, you should also see the log messages with trace ID and span ID:

Enable Stackdriver Trace API
You need to enable Stackdriver Trace API first In order to use Stackdriver Trace to store your trace data. To enable the API, navigate to API Services → Library

Search for Stackdriver Trace

Click on Stackdriver Trace API, then click on Enable if it isn't already enabled.
Setup Application Default Credential
For this lab, you'll need to configure an application default credential. This credential will be automatically picked up by Spring Cloud GCP Trace starter.
First, login:
$ gcloud auth application-default login
You are running on a Google Compute Engine virtual machine.
The service credentials associated with this virtual machine
will automatically be used by Application Default
Credentials, so it is not necessary to use this command.
If you decide to proceed anyway, your user credentials may be visible
to others with access to this virtual machine. Are you sure you want
to authenticate with your personal account?
Do you want to continue (Y/n)? Y
Go to the following link in your browser:
https://accounts.google.com/o/oauth2/auth...
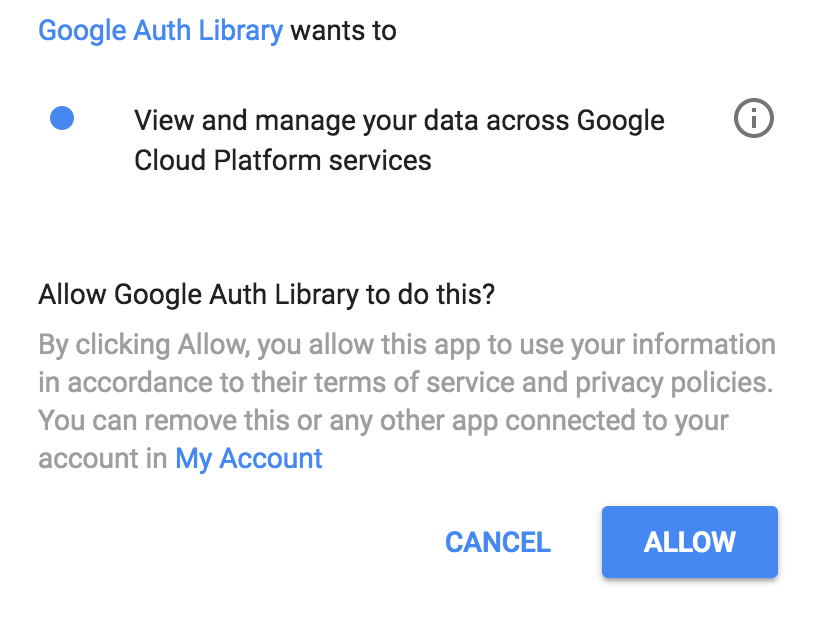
Enter verification code: ...Click on the link to open a new browser tab, and then click Allow
Then, copy and paste the verification code back into Cloud Shell and press enter. You should see:
Credentials saved to file: [/tmp/tmp.jm9bnQ4R9Q/application_default_credentials.json]
These credentials will be used by any library that requests
Application Default Credentials.
Add Spring Cloud GCP Trace
In this service, we already used Spring Cloud Sleuth for tracing. Let's add Spring Cloud GCP Trace starter to forward the data to Stackdriver Trace.
Add the Spring Cloud GCP Trace dependency:
pom.xml
<project>
  ...
  <dependencies>
    ...
    <!-- Add Stackdriver Trace Starter -->
    <dependency>
      <groupId>org.springframework.cloud</groupId>
      <artifactId>spring-cloud-gcp-starter-trace</artifactId>
    </dependency>
  </dependencies>
  ...
</project>
By default, Spring Cloud Sleuth does not sample every request. To make our testing a little easier, increase the sample rate to 100% in application.properties to ensure we see the trace data, as well as ignore some URLs that we do not care about:
$ echo "
spring.sleuth.sampler.probability=1.0
spring.sleuth.web.skipPattern=(^cleanup.*|.+favicon.*)
" > src/main/resources/application.properties
Run the application again, and use the Cloud Shell Web Preview to view the application:
$ export GOOGLE_CLOUD_PROJECT=`gcloud config list --format 'value(core.project)'`
$ ./mvnw -DskipTests spring-boot:run
By default, Spring Cloud GCP Trace batches trace data and sends them out once every 10 seconds, or when a minimum number of trace data is received. This is configurable and you can refer to the Spring Cloud GCP Trace reference documentation for more information.
Make request to the service:
$ curl localhost:8080In the Cloud Console, navigate to Stackdriver → Trace → Trace list

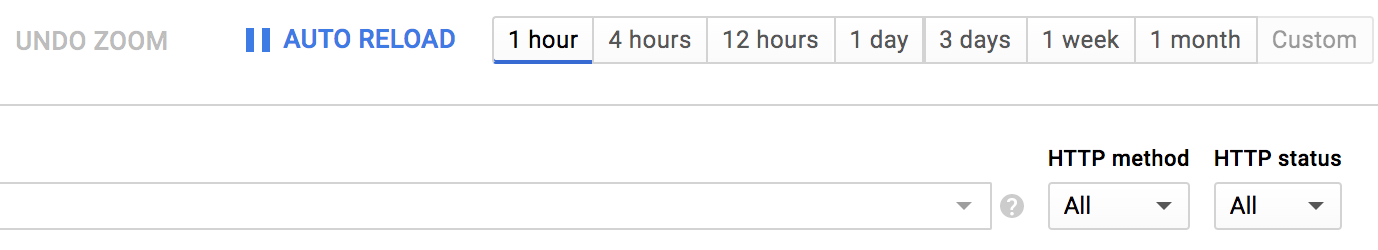
On the top, narrow down the time range to 1 hour. By default, Auto Reload is on. So as trace data arrive, it should show up in the console!
The trace data should show up in ~30 seconds or so.
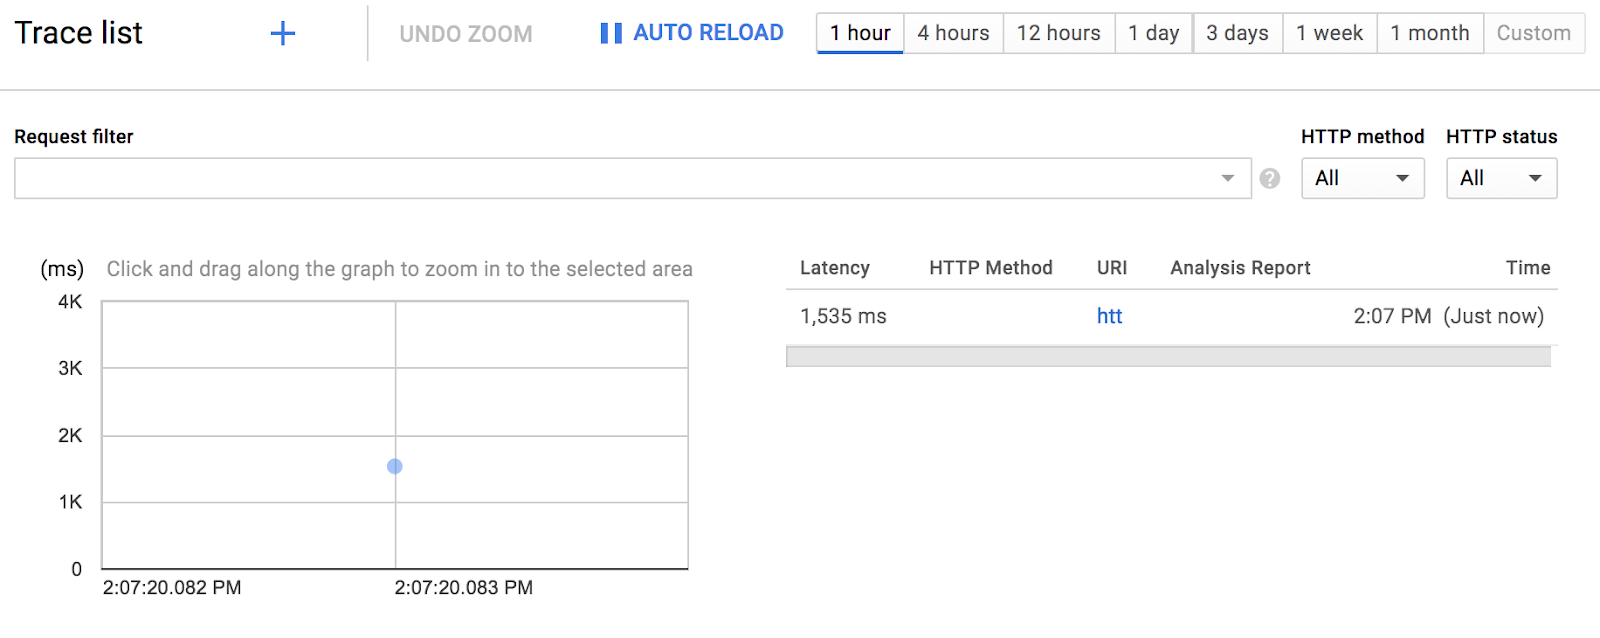
Click on the blue dot to see trace detail:

That was pretty simple!
Open a new Cloud Shell session by clicking on the + icon:

In the new session, create the second Spring Boot application:
$ curl https://start.spring.io/starter.tgz -d packaging=jar \
  -d dependencies=web,lombok,cloud-gcp,cloud-starter-sleuth \
  -d baseDir=trace-service-two | tar -xzvf - \
  && cd trace-service-two
Create a new REST controller by adding a new class:
src/main/java/com/example/demo/MeetingController.java
package com.example.demo;

import lombok.extern.slf4j.Slf4j;
import org.springframework.web.bind.annotation.GetMapping;
import org.springframework.web.bind.annotation.RestController;

import java.util.Random;

@RestController
@Slf4j
public class MeetingController {
  Random r = new Random();

  @GetMapping("/meet")
  public String meeting() {
    try {
      log.info("meeting...");
      Thread.sleep(r.nextInt(500 - 20 + 1) + 20);
    } catch (InterruptedException e) {
    }
    return "finished meeting";
  }
}
Add Spring Cloud GCP Trace to pom.xml
pom.xml
<project>
  ...
  <dependencies>
    ...
    <!-- Add Stackdriver Trace starter -->
    <dependency>
      <groupId>org.springframework.cloud</groupId>
      <artifactId>spring-cloud-gcp-starter-trace</artifactId>
    </dependency>
  </dependencies>
  ...
</project>
Configure Sleuth to sample 100% of the requests:
src/main/resources/application.properties
$ echo "
spring.sleuth.sampler.probability=1.0
spring.sleuth.web.skipPattern=(^cleanup.*|.+favicon.*)
" > src/main/resources/application.properties
Finally, you can start the Spring Boot application on port 8081 with the Spring Boot plugin:
$ export GOOGLE_CLOUD_PROJECT=`gcloud config list --format 'value(core.project)'`
$ ./mvnw -DskipTests spring-boot:run -Dserver.port=8081
While you have trace-service-two running, go back to the first Cloud Shell session window and make modification to trace-service-one.
First initialize a new RestTemplate bean:
src/main/java/com/example/demo/DemoApplication.java
package com.example.demo;

...

import org.springframework.web.client.RestTemplate;
import org.springframework.context.annotation.Bean;

@SpringBootApplication
public class DemoApplication {
        @Bean
        public RestTemplate restTemplate() {
                return new RestTemplate();
        }

        public static void main(String[] args) {
                SpringApplication.run(DemoApplication.class, args);
        }
}
In WorkController.meeting(), make a call out to the Meeting service.
src/main/java/com/example/demo/WorkController.java
package com.example.demo;

...
import org.springframework.web.client.RestTemplate;
import org.springframework.beans.factory.annotation.Autowired;

@RestController
@Slf4j
public class WorkController {
  @Autowired
  RestTemplate restTemplate;

  public void meeting() {
    String result = restTemplate.getForObject("http://localhost:8081/meet", String.class);
    log.info(result);
  }

  ...
}
Start the service again and trigger the endpoint from Web Preview:
$ export GOOGLE_CLOUD_PROJECT=`gcloud config list --format 'value(core.project)'`
$ ./mvnw -DskipTests spring-boot:run
In both session windows, you should see the log messages, with the Trace ID propagated from one service to another.
In Stackdriver Trace's Trace List, you should see the second trace:
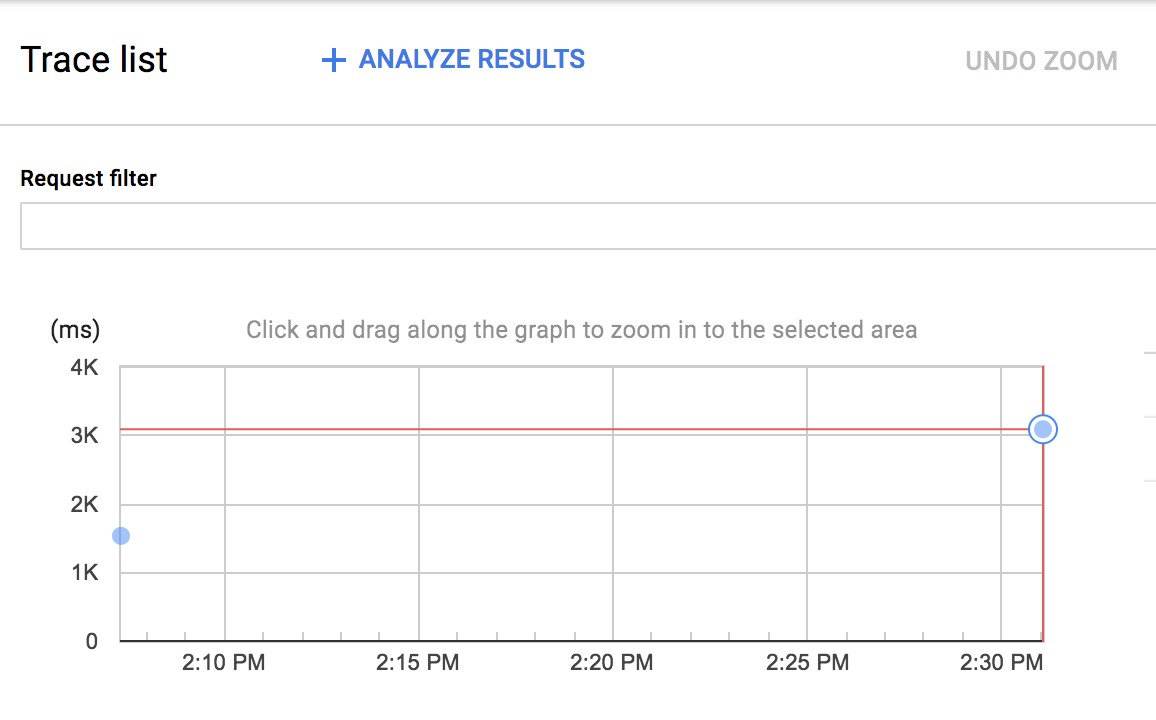
You can click on the new blue dot and see the trace detail:
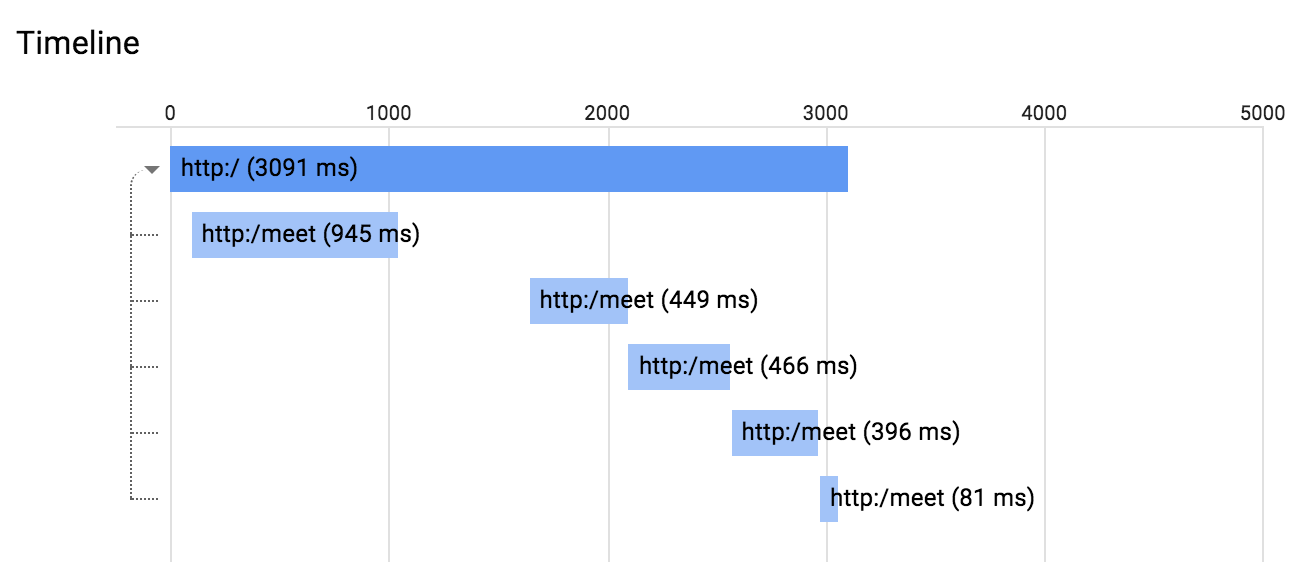
You can also click on any span in this diagram to see the span detail.
When you use Stackdriver Trace as the trace data storage, Stackdriver Trace can use the data to build latency distribution report. You'll need more than 100 traces in order to build the report like this:

In addition, Stackdriver Trace can automatically detect performance regression of the same service across two different time periods under Analysis Report.
In this lab, you created 2 simple services and added distributed tracing with Spring Cloud Sleuth, and used Spring Cloud GCP to forward the trace information to Stackdriver Trace..
You learned how to write your first App Engine web application!
Learn More
- Stackdriver Trace: https://cloud.google.com/trace/
- Spring on GCP project: http://cloud.spring.io/spring-cloud-gcp/
- Spring on GCP GitHub repository: https://github.com/spring-cloud/spring-cloud-gcp
- Java on Google Cloud Platform: https://cloud.google.com/java/
License
This work is licensed under a Creative Commons Attribution 2.0 Generic License.