BigQuery sample dataset for Google Analytics gaming app implementation
Stay organized with collections
Save and categorize content based on your preferences.
Flood-It! is puzzle game available both on the Android
and the iOS platforms. The app uses the standard Google
Analytics gaming app implementation through Firebase. The flood it
dataset available through the firebase-public-project BigQuery
project contains a sample of obfuscated BigQuery event export data for 114 days.
Pre-requisite
You need access to a Google Cloud project with BigQuery API enabled.
Complete the Before you begin section in the BigQuery Quickstart guide to
create a new Google Cloud project or to enable the BigQuery API in an
existing one.
You can use the BigQuery Sandbox mode for free with certain limitations.
The Free usage tier should be sufficient to explore this dataset and run the
sample queries. You can optionally Enable Billing to go beyond the Free
usage tier.
Limitations
This dataset contains obfuscated data that emulates what a real world dataset
would look like from an actual Google Analytics implementation. Certain fields
will contain placeholder values including <Other>, NULL, and ''. Due to
obfuscation, internal consistency of the dataset might be somewhat limited.
Using the dataset
The Cloud Console provides an interface to query tables. You can use the
BigQuery UI to access the flood it dataset.
If the Editor tab isn't visible, then click add_boxCompose new query.
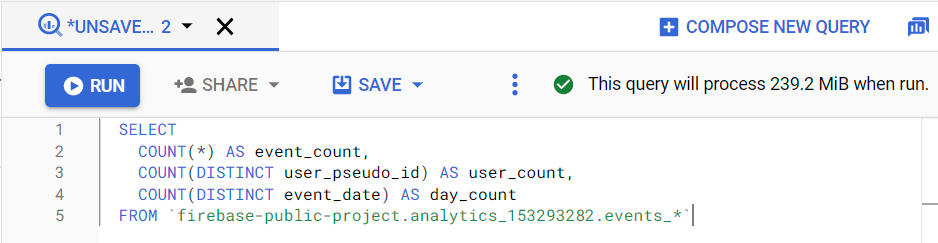
Copy and paste the following query into the Editor field. This query will
show to number of unique events, users, and days in the dataset.
For valid queries, a check mark will appear along with the amount of data
that the query will process. This metric helps you determine the cost of
running the query.
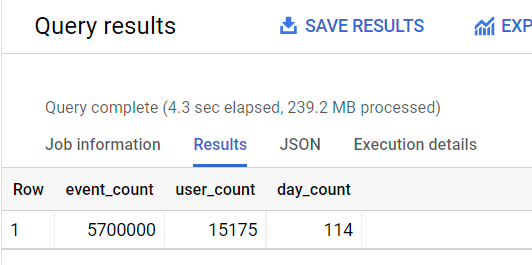
Click Run. The query results page will appear below the query window.
[[["Easy to understand","easyToUnderstand","thumb-up"],["Solved my problem","solvedMyProblem","thumb-up"],["Other","otherUp","thumb-up"]],[["Missing the information I need","missingTheInformationINeed","thumb-down"],["Too complicated / too many steps","tooComplicatedTooManySteps","thumb-down"],["Out of date","outOfDate","thumb-down"],["Samples / code issue","samplesCodeIssue","thumb-down"],["Other","otherDown","thumb-down"]],["Last updated 2024-10-09 UTC."],[[["\u003cp\u003eThe \u003ccode\u003eflood it\u003c/code\u003e dataset, available in BigQuery, contains 114 days of obfuscated Google Analytics data from the Flood-It! mobile game.\u003c/p\u003e\n"],["\u003cp\u003eUsers can explore this dataset using the BigQuery sandbox for free, with options for enabling billing for larger queries.\u003c/p\u003e\n"],["\u003cp\u003eThe dataset offers insights into user behavior and game interactions but has limitations due to data obfuscation.\u003c/p\u003e\n"],["\u003cp\u003eProvided instructions guide users on accessing and querying the dataset within the BigQuery UI.\u003c/p\u003e\n"],["\u003cp\u003eFurther resources are available to learn more about BigQuery, Google Analytics data schemas, and visualization tools.\u003c/p\u003e\n"]]],["The provided content describes accessing and using the \"flood it\" dataset, a sample of obfuscated Google Analytics data from a puzzle game. Users need a Google Cloud project with BigQuery API enabled, accessible via the BigQuery UI. A sample query is provided to count unique events, users, and days. Users can run this and other queries and are directed to explore additional resources such as the schema, advanced queries, and using tools like Connected Sheets and Looker Studio.\n"],null,["[Flood-It!](https://flood-it.app/) is puzzle game available both on the [Android](https://play.google.com/store/apps/details?id=com.labpixies.flood)\nand the [iOS](https://apps.apple.com/us/app/flood-it/id476943146) platforms. The app uses the standard Google\nAnalytics gaming app implementation through Firebase. The [`flood it`\ndataset](https://console.cloud.google.com/bigquery?p=firebase-public-project&d=analytics_153293282&t=events_20181003&page=table) available through the `firebase-public-project` BigQuery\nproject contains a sample of obfuscated BigQuery event export data for 114 days.\n\nPre-requisite\n\n- You need access to a Google Cloud project with BigQuery API enabled.\n Complete the *Before you begin* section in the [BigQuery Quickstart guide](https://cloud.google.com/bigquery/docs/quickstarts/quickstart-web-ui#before-you-begin) to\n create a new Google Cloud project or to enable the BigQuery API in an\n existing one.\n\n- You can use the [BigQuery Sandbox mode](https://cloud.google.com/bigquery/docs/sandbox) for free with certain limitations.\n The [Free usage tier](https://cloud.google.com/bigquery/pricing#free-tier) should be sufficient to explore this dataset and run the\n sample queries. You can optionally [Enable Billing](https://cloud.google.com/billing/docs/how-to/modify-project) to go beyond the Free\n usage tier.\n\nLimitations\n\nThis dataset contains obfuscated data that emulates what a real world dataset\nwould look like from an actual Google Analytics implementation. Certain fields\nwill contain placeholder values including `\u003cOther\u003e`, `NULL`, and `''`. Due to\nobfuscation, internal consistency of the dataset might be somewhat limited.\n\nUsing the dataset\n\n1. The Cloud Console provides an interface to query tables. You can use the\n [BigQuery UI](https://console.cloud.google.com/bigquery?p=firebase-public-project&d=analytics_153293282&t=events_20181003&page=table) to access the `flood it` dataset.\n\n2. If the **Editor** tab isn't visible, then click add_box **Compose new query**.\n\n3. Copy and paste the following query into the Editor field. This query will\n show to number of unique events, users, and days in the dataset.\n\n SELECT\n COUNT(*) AS event_count,\n COUNT(DISTINCT user_pseudo_id) AS user_count,\n COUNT(DISTINCT event_date) AS day_count\n FROM `firebase-public-project.analytics_153293282.events_*`\n\n4. For valid queries, a check mark will appear along with the amount of data\n that the query will process. This metric helps you determine the cost of\n running the query. \n\n \u003cbr /\u003e\n\n5. Click **Run** . The query results page will appear below the query window. \n\n \u003cbr /\u003e\n\n6. Try running some [sample queries](/analytics/bigquery/basic-queries).\n\nNext Steps\n\n- Learn more about the schema for [Google Analytics BigQuery event export\n schema](/analytics/bigquery/event-schema).\n\n- Run some of the [advanced queries](/analytics/bigquery/advanced-queries) on the dataset.\n\n- If you are not familiar with BigQuery, explore [BigQuery How-to Guides](https://cloud.google.com/bigquery/docs/how-to).\n\n- Use [Connected Sheets](https://cloud.google.com/bigquery/docs/connected-sheets) to analyze the dataset from Google Sheets\n spreadsheet.\n\n- [Visualize](https://cloud.google.com/bigquery/docs/visualize-looker-studio) the dataset using [Looker Studio](https://lookerstudio.google.com/)."]]