
Page Summary
-
The heatmapTiles endpoint delivers pollen heatmaps as tile overlays, which are collections of 256x256 pixel image tiles displayed on top of Google Maps.
-
Tile coordinates (X,Y) determine the grid position, with (0,0) at the northwest corner and increasing values eastward for X and southward for Y.
-
Zoom level (Z) controls map content size and grid dimensions, ranging from 0 (entire world) to 16, influencing tile coordinates validity.
-
To request heatmap tiles, use the heatmapTiles endpoint with required parameters: API key, heatmap type, zoom level, and tile coordinates (X,Y).
-
You can overlay these pollen heatmap tiles onto existing maps for visualization, enhancing applications with pollen information.
The heatmapTiles endpoint provides pollen-related heatmaps through tile overlay. A tile overlay is a collection of image tiles that can be displayed on top of Google Maps. Each image tile is 256 x 256 pixels.
The tile overlay is a grid assembled from a collection of tiles, each assigned
(X,Y) coordinates. The tile with coordinates (0,0) is always at the
northwest corner of the map. The X values increase from west to east, while
the Y values increase from north to south.
The zoom level determines how large or small the contents of a map appear in a
map view. The tile grid size is determined by scaling the X and Y
coordinates exponentially by the zoom level.
gridSizeX = XzoomLevel
gridSizeY = YzoomLevel
For example, at a zoom level of 2, the world map is represented using a 4 x 4 matrix, for a total of 16 tiles.
The following image shows a TREE_UPI heatmap of the entire world, sectioned
into tiles that can be accessed at a zoom level of 2.

See Map and Tile coordinates for additional details.
You can request current pollen heatmap tiles using the heatmapTiles endpoint by sending an HTTP GET request to:
https://pollen.googleapis.com/v1/mapTypes/TYPE/heatmapTiles/Z/X/Y?key=YOUR_API_KEY
About the heatmap endpoint
All parameters listed below are required for a successful request:
KEY: Your application's API key. This key identifies your application for purposes of quota management. Learn how to get a key.TYPE: The type of heatmap to return. See allowed values.Z: Zoom level that determines how large or small the contents of a map appear in a map view. Allowed values are 0-16, where a value of 0 displays the entire world in a single tile.X,Y: The tile coordinates relatively to the north east corner (0,0).Xvalues increase from west to east andYvalues increase from north to south. Coordinates must be valid for the specified zoom level. For example, if you set the zoom level to 2 and request a tile at coordinates (10,10), the API returns an error.
Example heatmap request
The image above shows a TREE_UPI heatmap with a zoom level of 2, along with
the coordinates of each tile. The following example uses the heatmapTiles
endpoint to request the tile at coordinates (2,1):
https://pollen.googleapis.com/v1/mapTypes/TREE_UPI/heatmapTiles/2/2/1?key=YOUR_API_KEY
The tile appears as an image that can be overlaid on a map:
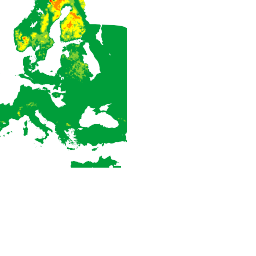
For more information on overlaying tiles on top of the default map, see Overlay Map Types.