
نقطه پایانی heatmapTiles نقشههای حرارتی مرتبط با کیفیت هوا را از طریق یک پوشش کاشی ارائه میدهد. پوشش کاشی مجموعهای از کاشیهای تصویر PNG است که میتوانند در بالای نقشههای گوگل نمایش داده شوند. هر کاشی تصویر (۲۵۶ در ۲۵۶ پیکسل) است.
درباره کاشیهای نقشه حرارتی
پوشش کاشی، شبکهای است که از مجموعهای از کاشیها تشکیل شده است که به هر کدام مختصات ( X ، Y ) اختصاص داده شده است. کاشی با مختصات (0،0) همیشه در گوشه شمال غربی نقشه قرار دارد. مقادیر X از غرب به شرق افزایش مییابد، در حالی که مقادیر Y از شمال به جنوب افزایش مییابد.
zoom level میزان بزرگ یا کوچک بودن محتوای نقشه را در نمای نقشه تعیین میکند. اندازه شبکه کاشیها با مقیاسبندی مختصات X و Y به صورت نمایی توسط سطح بزرگنمایی تعیین میشود.
gridSizeX = XzoomLevel
gridSizeY = YzoomLevel
برای مثال، در سطح بزرگنمایی ۲، نقشه جهان با استفاده از یک ماتریس ۴ در ۴ نمایش داده میشود که در مجموع ۱۶ کاشی را شامل میشود. بزرگنمایی همچنین حداکثر مقدار مجاز برای مختصات را تعیین میکند.
تصویر زیر یک نقشه حرارتی US_AQI با سطح بزرگنمایی ۲ را به همراه مختصات هر کاشی نشان میدهد:

برای جزئیات بیشتر به نقشه و مختصات کاشی مراجعه کنید.
درباره نقطه پایانی نقشه حرارتی
یک کاشی نقشه حرارتی توسط یک آرایه بایتی حاوی دادههای کاشی به صورت یک تصویر PNG نمایش داده میشود. شما میتوانید کاشیهای نقشه حرارتی کیفیت هوای فعلی را با استفاده از نقطه پایانی heatmapTiles و با ارسال یک درخواست HTTP GET به آدرس زیر درخواست کنید:
https://airquality.googleapis.com/v1/mapTypes/TYPE/heatmapTiles/Z/X/Y?key=YOUR_API_KEY
تمام پارامترهای درخواست در یک درخواست الزامی هستند:
TYPE- نوع نقشه حرارتی که باید برگردانده شود. مقادیر مجاز را ببینید.Z- سطح بزرگنمایی که میزان بزرگ یا کوچک بودن محتویات نقشه را در نمای نقشه تعیین میکند. مقادیر مجاز از 0 تا 16 هستند، که مقدار 0 کل جهان را در یک کاشی واحد نمایش میدهد.X،Y- مختصات کاشی مورد نظر برای بازیابی، نسبت به گوشه شمال غربی (0،0). مقادیرXاز غرب به شرق و مقادیرYاز شمال به جنوب افزایش مییابند.مختصات کاشیها باید برای سطح بزرگنمایی مشخص شده معتبر باشند. برای مثال، اگر سطح بزرگنمایی را روی ۲ تنظیم کنید و کاشیای با مختصات ۱۰،۱۰ درخواست کنید، API خطا برمیگرداند.
YOUR_API_KEY- کلید API برنامه شما. این کلید، برنامه شما را برای اهداف مدیریت سهمیه شناسایی میکند. برای اطلاعات بیشتر، به دریافت کلید مراجعه کنید.
نمونه درخواست نقشه حرارتی
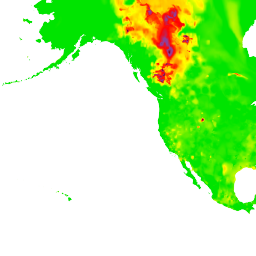
تصویر بالا یک نقشه حرارتی US_AQI با سطح بزرگنمایی ۲ را به همراه مختصات هر کاشی نشان میدهد. مثال زیر از نقطه پایانی heatmapTiles برای درخواست کاشی در مختصات ۰،۱ از نقشه حرارتی استفاده میکند:
https://airquality.googleapis.com/v1/mapTypes/US_AQI/heatmapTiles/2/0/1?key=YOUR_API_KEY
کاشی به صورت زیر ظاهر میشود:
برای اطلاعات بیشتر در مورد همپوشانی کاشیها روی نقشه پیشفرض، به انواع نقشههای همپوشانی مراجعه کنید.