Introduction
In support of the Brazilian government's efforts to implement the Brazil Forest Code and protect forests on private lands, Google has produced two basemaps derived from SPOT satellite observations: a Visual Basemap and an Analytic Basemap (G-BFID v1.0).
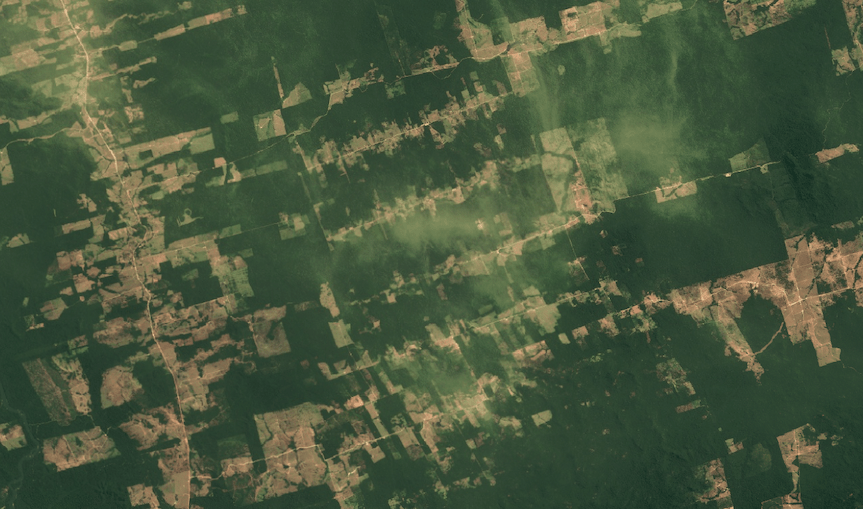
These mosaicked image products establish a baseline for July 22, 2008, a critical date under the Brazil Forest Code for identifying "consolidated areas"—regions with pre-existing human occupation or agricultural use. Derived from the SPOT satellite archive, these mosaic datasets provide a higher-resolution alternative to the 30-meter Landsat data traditionally used to establish this baseline.
To synthesize thousands of SPOT images into unified basemaps, the imagery underwent a processing routine consisting of:
- Edge refinement to remove compression artifacts.
- Radiometric normalization against a Landsat baseline.
- Cloud masking (conservative, manual).
- Misregistration correction (coregistration to a Landsat composite).
For the final compositing, a deterministic mosaic method was employed rather than statistical reduction. Pixels were layered according to spatial resolution and satellite mission chronology, with priority given to observations from newer satellites. This layering hierarchy was combined with nearest neighbor resampling to establish strict data provenance. Consequently, every pixel in the final basemap retained its discrete origin and remained directly traceable to a specific source observation and its metadata.
Source data
Satellite and sensor specifications
The G-BFID v1.0 basemaps are derived from SPOT (Satellite pour l’Observation de la Terre) image data. The SPOT missions, operated by CNES and distributed by Airbus, provide high-resolution optical imagery with a 60 km swath. This project utilizes an archive of imagery from three specific satellites to establish the 2008 baseline:
- SPOT 2 & 4: Equipped with the HRV/HRVIR sensors, providing multispectral data at 20-meter resolution and panchromatic data at 10-meter resolution.
- SPOT 5: Equipped with the HRG sensor, offering significantly improved spatial resolution with multispectral data at 10-meter resolution and panchromatic data at 5-meter resolution.
| SPOT 2 | SPOT 4 | SPOT 5 | |
|---|---|---|---|
| Multispectral | 20 m | 20 m | 10 m |
| Panchromatic | 10 m | 10 m | 5 m |
| Spectral Bands | Green, Red, NIR | Green, Red, NIR, SWIR | Green, Red, NIR, SWIR |
Table 1. Technical specifications for SPOT 2, 4, and 5 missions.
Note: Airbus produces a "supermode" panchromatic product that can be used to pan–sharpen SPOT 5 images to 2.5-meter resolution. The availability of these data are very limited for the specifications of this project and were not included.
Input Earth Engine collections
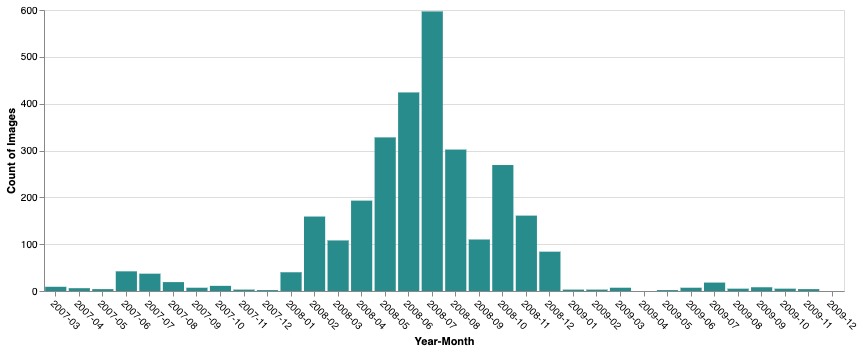
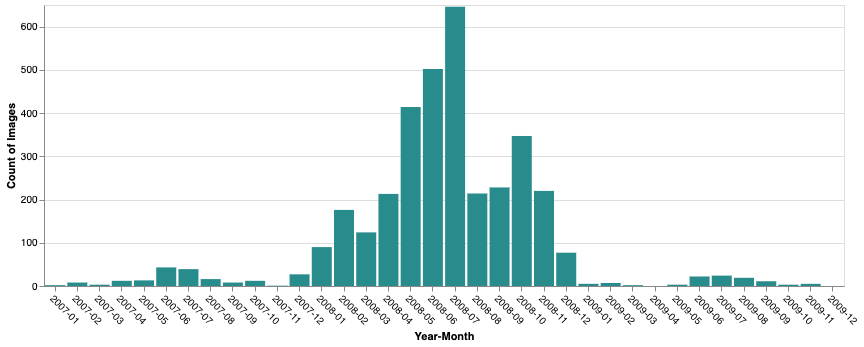
Three distinct SPOT data products were ingested and processed to generate the final basemaps. These collections span the period from January 9, 2007, to November 26, 2009, providing the necessary temporal depth to overcome cloud cover constraints while maintaining a high-resolution baseline.
Scene selection
To support forest protection efforts on private lands registered in the Rural Environmental Registry (CAR), geographic coverage was prioritized for the Amazon biome and the five "Arc of Deforestation" states: Maranhão, Mato Grosso, Pará, Rondônia, and Tocantins.
To align with the requirements of the Brazil Forest Code, a mid-2008 temporal window was targeted. Based on these temporal and cloud-cover criteria (<50%), a total of 10,072 images from SPOT 2, 4, and 5 were identified and ingested into the Earth Engine Data Catalog for processing.
Note on Spectral Composition: SPOT 2, 4, and 5 sensors do not natively capture a blue spectral band. For the natural color products, a synthesized blue band—derived from existing spectral bands to approximate a true-color representation—is provided by the data distributor.
1. Pansharpened multispectral natural color
- Earth Engine Asset:
AIRBUS/SPOT_2_4_5/BRAZIL/2007_2009/PMS_NC/V1 - Number of Images: 2977
- Date Range: March 1, 2007 – November 26, 2009
- Description: This product merges the higher-resolution panchromatic band with the multispectral bands to produce a sharp, 3-band RGB image. This is the preferred source for the Visual Basemap.
2. Multispectral natural color
- Earth Engine Asset:
AIRBUS/SPOT_2_4_5/BRAZIL/2007_2009/MS_NC/V1 - Number of Images: 3536
- Date Range: January 9, 2007 – November 26, 2009
- Description: A 3-band pseudo-natural color product (simulated RGB) at native multispectral resolution. This collection is used in the Visual Basemap as a secondary source where pansharpened data may be unavailable.
3. Multispectral
- Earth Engine Asset:
AIRBUS/SPOT_2_4_5/BRAZIL/2007_2009/MS/V1 - Number of Images: 3559
- Date Range: January 9, 2007 – November 26, 2009
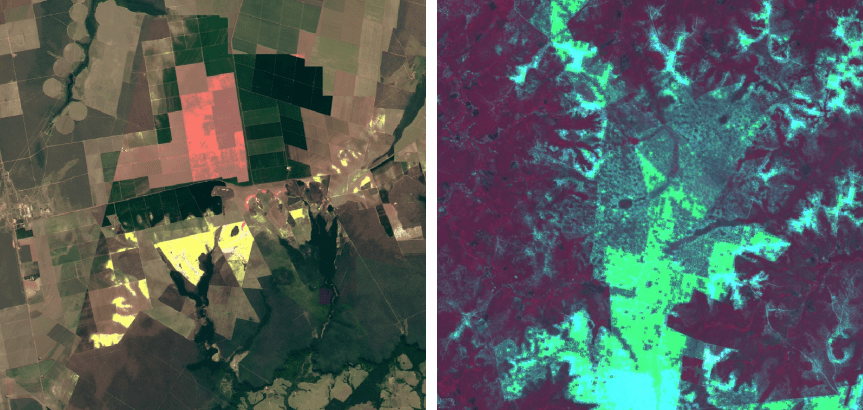
- Description: The source for the Analytic Basemap. This collection contains the original spectral bands (including near-infrared and short-wave infrared where available) necessary for calculating vegetation indices (e.g., NDVI) and performing cover classification.

Geographic coverage and gaps
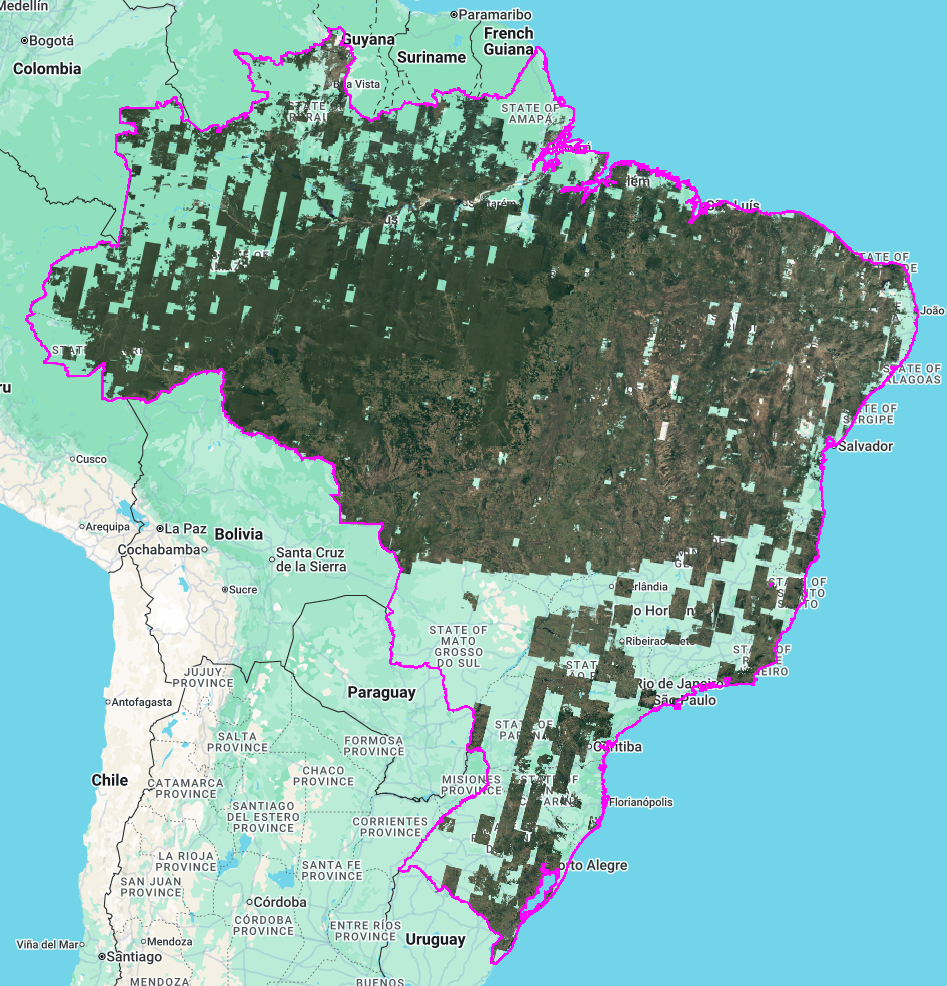
The primary objective of the G-BFID v1.0 basemaps is to establish a high-resolution, near-2008 baseline for the administrative territory of Brazil. However, maintaining a strict temporal window (2007–2009) while filtering for high-quality, low-cloud images resulted in spatial gaps, particularly in regions with persistent cloud cover.
Scene selection and quality filtering
To ensure data integrity, a candidate pool was identified from 2007–2009 with <50% initial cloud cover. From this, a total of just over 10,000 images were ingested and further filtered to exclude those with significant quality issues:
- Discontinuity check: Images with manually identified telemetry or geometric artifacts, including discontinuous scenes bundled together by the data provider, were excluded.
- Cloud QA: Scenes rejected by professional image analysts for being entirely cloud-cover or other reasons.
- Data density: Only images with >10% valid pixels (Visual Basemap) remaining after cloud masking were retained (>5% for Analytic Basemap).
Spatial distribution
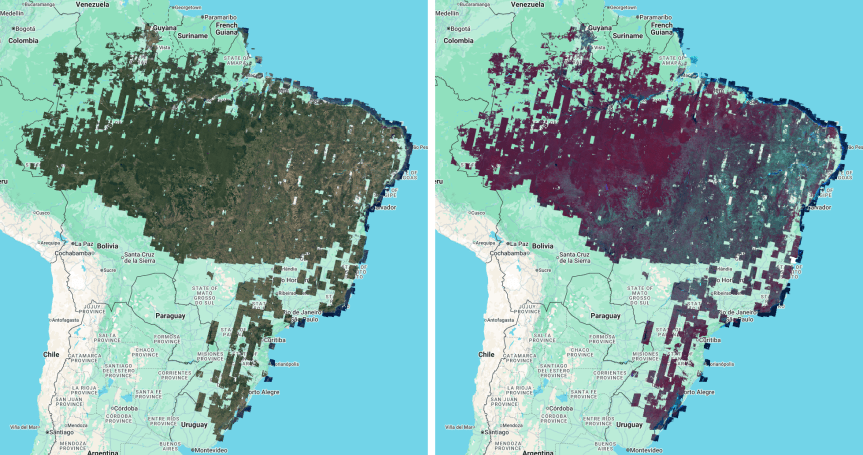
As shown in Figure 5, the mosaics achieve the highest density in the "Arc of Deforestation" and the north/central-west regions. Transparent areas represent regions where no SPOT 2, 4, or 5 imagery passed the quality filters listed above within the target timeframe or were cloud masked.
Coverage by state
Figure 6 provides a state-by-state breakdown of valid pixel coverage. Coverage is near-complete (>95%) for states such as Rondônia and Mato Grosso, while states in the south and parts of the northeast show lower density due to the constraints of the archive and cloud masking.
The chart also illustrates that the Visual Basemap consistently provides slightly higher valid pixel coverage than the Analytic Basemap across nearly all states. This difference exists because the Visual product can utilize both the pansharpened and multispectral natural color collections, whereas the Analytic product is derived solely from the multispectral collection.
Processing methodology
The processing methodology for the G-BFID v1.0 basemaps prioritizes data provenance and radiometric integrity to support Forest Code compliance assessments. This section first defines the overarching mosaic architecture and layering logic used to preserve this integrity, followed by the chronological preprocessing and normalization steps applied to individual source images prior to final assembly.
Mosaic method
The final basemaps were created using a mosaic method rather than statistical reducers (such as mean or median composites). This approach ensures the final products retain the original spectral values and spatial textures of the source imagery. By avoiding the averaging of multiple observations, the mosaic preserves the discrete provenance of each pixel.
Layering logic
The input imagery was layered using a hierarchy that favors higher spatial resolution and later satellite missions:
- Visual Basemap: Imagery was sorted by pixel size (prioritizing the highest resolution data available) and then by satellite mission (prioritizing data from newer SPOT satellites).
- Analytic Basemap: Imagery was layered by satellite mission, prioritizing observations from later SPOT missions to target the best available data.
Integrity and traceability
Resampling: All internal reprojections used nearest neighbor resampling. This avoids the interpolative smoothing effects of other methods, ensuring that the original radiometric and spatial properties of the source pixels are not influenced by their neighbors.
Data traceability: A per-pixel
datemetadata band is included in both products. This allows users to identify the exact date of observation for any given location, ensuring full transparency for Forest Code compliance assessments.
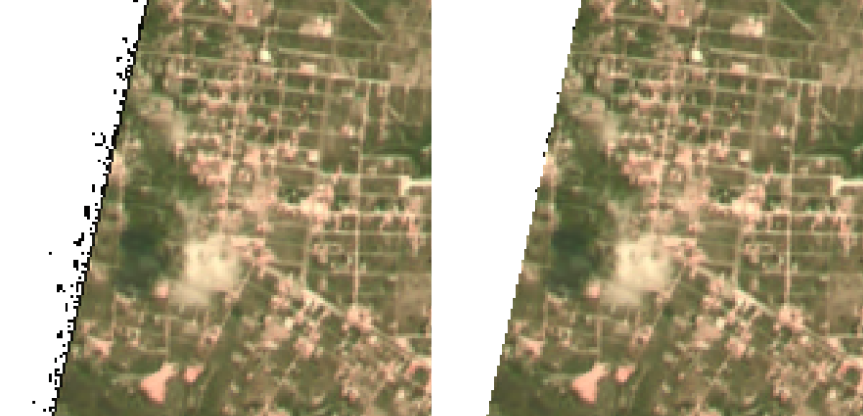
Image edge refinement
To ensure clean boundaries between overlapping scenes, an edge refinement process was applied to remove artifacts present in the source imagery. These artifacts, appearing as speckled or "noisy" pixels along image borders, were a characteristic of the lossy compression in the data delivered by the provider. To address this, a 2.5-pixel focal minimum erosion was applied to the image masks, removing the low-quality edge artifacts and ensuring that only valid data is used in the final mosaics (Figure 7).
Cloud masking
To ensure the highest possible data integrity for G-BFID v1.0, a manual masking procedure was implemented across the imagery archive. This approach was chosen over automated methods to allow for a more conservative exclusion of pixels affected by clouds or other atmospheric interference.
Masking procedure
Trained analysts identified areas containing clouds and related atmospheric artifacts. To ensure these problematic pixels were fully captured, a conservative masking strategy was employed using simplified, coarse geometries. Rather than precisely tracing individual cloud perimeters, larger rectangular areas were masked to ensure the resulting mosaic remained as clear as possible.
While this approach is intentionally aggressive—often removing valid pixels adjacent to clouds—it was deemed necessary to provide a high-integrity product for the 2008 baseline.
Masking policy and integration
Manual masks were produced exclusively for the multispectral and pansharpened natural color image collections. Because the multispectral natural color product is derived from the multispectral data, these masks were then propagated to the coincident multispectral images during processing.
Any multispectral image that did not have a matching, manually-masked natural color counterpart was excluded from the final mosaic. This ensures that every pixel included in the G-BFID v1.0 suite—regardless of the product type—has had clouds removed.
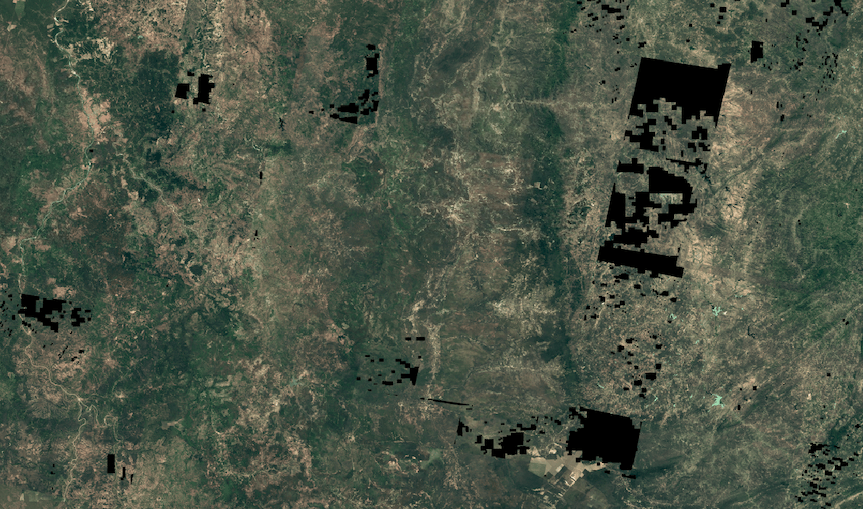
Interpretation of data gaps
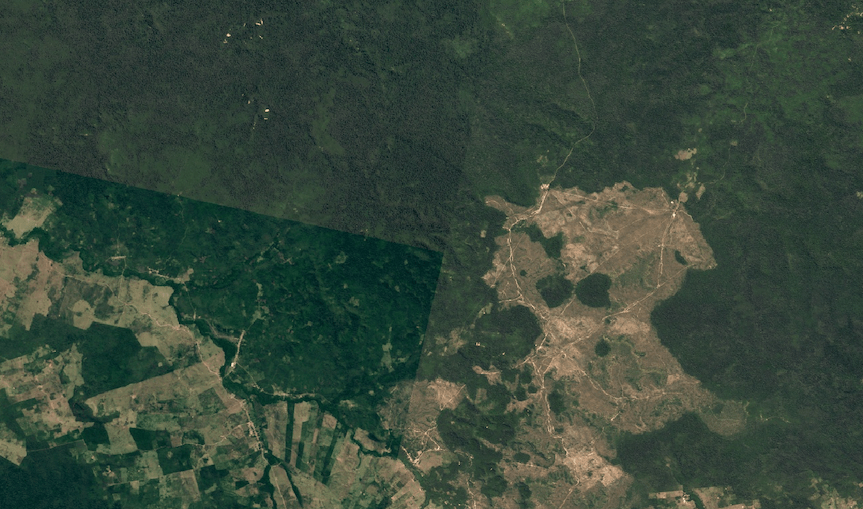
Transparent gaps in the final mosaics represent areas where no valid, high-quality data is available within the 2007–2009 temporal window. These gaps result from a combination of the conservative manual masking described above, the initial rejection of scenes with high cloud cover (>50%), or a total absence of available source imagery from the provider for a specific region. While larger regional gaps typically reflect a lack of available 2008-era images, the distinct "blocky" patterns shown in Figure 9 are a consequence of cloud masking.
Misregistration correction
An automated coregistration workflow was implemented to mitigate significant misregistration in the SPOT source imagery relative to a geographic baseline derived from Landsat Collection 2 data.
Reference baseline
A cloud-free Landsat Collection 2 reference mosaic was generated to serve as a coregistration reference image. This reference image was constructed using a median reducer on Landsat 7 and 8 images intersecting Brazil for the period 2006–2010. The Landsat red band was selected as the primary registration target to match the SPOT red band.
Displacement estimation
The ee.Image.displacement algorithm was used to calculate the pixel-level
offset between the SPOT source data and the Landsat reference.
- Search parameters: A maximum offset of 500 m and a stiffness parameter of 5 were applied to the displacement model.
- Statistical aggregation: Delta x ($dx$) and delta y ($dy$), and confidence values were aggregated across the entire image area using a mean reducer.
- Magnitude calculation: From these aggregated statistics, a total magnitude offset estimate $M = \sqrt{dx^2 + dy^2}$ was calculated to represent the average displacement of the scene.
Correction policy
Scenes were categorized and corrected based on the calculated displacement statistics to prioritize significant improvements while avoiding the introduction of new artifacts:
- Automatic correction: Images exhibiting a displacement magnitude $M > 30$ m with a confidence score $C > 0.3$ were automatically shifted using the estimated $dx$ and $dy$ values.
- Manual assessment: For scenes with very high estimated displacement ($M > 100$ m) but low confidence ($C \le 0.3$), manual review was performed. Corrections were accepted only if the resulting coregistration showed a definitive improvement over the original placement.
- Exclusion: Scenes that remained significantly misregistered after attempted correction, or those with insufficient features for reliable matching, were excluded from the mosaic.
Implementation and quality control
Corrected images were re-projected using nearest neighbor resampling to preserve the original radiometric values and avoid the smoothing effects of bilinear or cubic interpolation.
To ensure spatial traceability, a boolean coregistered band was appended to
each image and preserved in the final mosaic. This metadata allows users to
distinguish between pixels that underwent spatial adjustment and those retained
in their original delivered position.
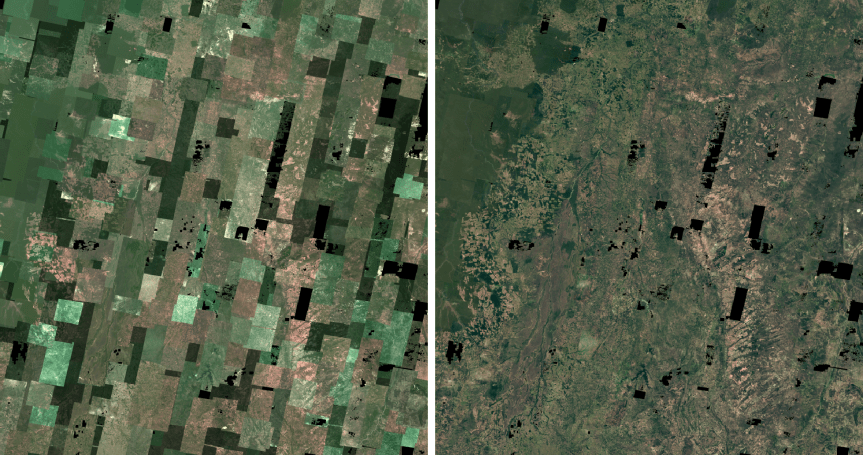
Radiometric normalization
To account for varying atmospheric conditions and sensor differences across the SPOT source collections, radiometric normalization was applied to images comprising the mosaic products. Both the Visual and Analytic basemaps utilize histogram matching against a consistent 2008 Landsat target baseline.
Landsat was selected as the reference over coarser alternatives like MODIS because its 30-meter resolution more closely aligns with the 5 to 20-meter SPOT data. This similarity ensures that the spectral histograms are more equally representative, allowing for a more accurate radiometric transfer during the matching process. The specific methodology for this harmonization differs slightly based on whether the final use case is visual or analytic.
Visual Basemap
To minimize radiometric discontinuities between adjacent images and ensure a near-seamless appearance, a color-balancing workflow was implemented using histogram matching. Pixel values were adjusted to match a consistent 2008 Landsat mosaic target baseline.
The process follows these steps:
- Analysis masking: To ensure stable statistics during histogram matching,
a temporary analysis mask is generated to exclude areas that could skew the
data. This masking targets two primary features:
- High-change areas: Pixels exceeding the 95th percentile of absolute difference between the SPOT image and the Landsat reference mosaic are excluded.
- Water bodies: High reflectance variability over water is excluded using the JRC Yearly Water Classification History dataset. The dataset is filtered to the year 2008, and an inverse mask is applied to ensure only non-water classes are retained for the statistical analysis.
- Lookup table (LUT) generation: Using the masked data, cumulative histograms are calculated for both the source SPOT bands and the target Landsat bands.
- Interpolation: Source pixel values are remapped to target values using the generated LUT, aligning the radiometric profile of the SPOT data with the 2008 Landsat reference.
Analytic Basemap
Processing the Analytic Basemap mirrors the Visual Basemap, but includes converting DN values to top-of-atmosphere reflectance:
1. Top-of-atmosphere (TOA) reflectance conversion
The SPOT raw digital numbers (DN) are converted to TOA reflectance to account for physical sensor properties and solar geometry:
- Radiance calculation: Application of the provider's band-specific physical gain and bias metadata.
- Reflectance normalization: Radiance is normalized by solar irradiance, the cosine of the sun zenith angle, and the Earth-Sun distance for the specific day of acquisition.
2. Histogram matching
To further minimize radiometric differences between disparate SPOT images a histogram matching workflow is applied:
Analysis masking: This step uses the exact same analysis masking described in the Visual Basemap section above: excluding >95th percentile change pixels and filtering out water pixels via the inverted 2008 JRC classification mask.
Harmonization: Similar to the Visual Basemap, pixel values are remapped via a lookup table to align the radiometric profile with a Landsat TOA reference. This establishes mosaic-wide radiometric consistency for training broad-scale machine learning models and running reliable inferences.
Limitations and known issues
While G-BFID v1.0 provides a high-resolution 2008-era baseline, users should be aware of several limitations inherent to the historical SPOT archive and the processing methodologies employed.
Spatial completeness and gaps
The basemaps don't provide 100% geographic coverage of Brazil. Gaps exist where no imagery met the project’s strict 2008-era temporal window (2007–2009), cloud cover thresholds, or quality standards. These gaps are most frequent in regions with persistent cloud cover or lower historical satellite acquisition frequency. See the Geographic Coverage and Gaps section for details.
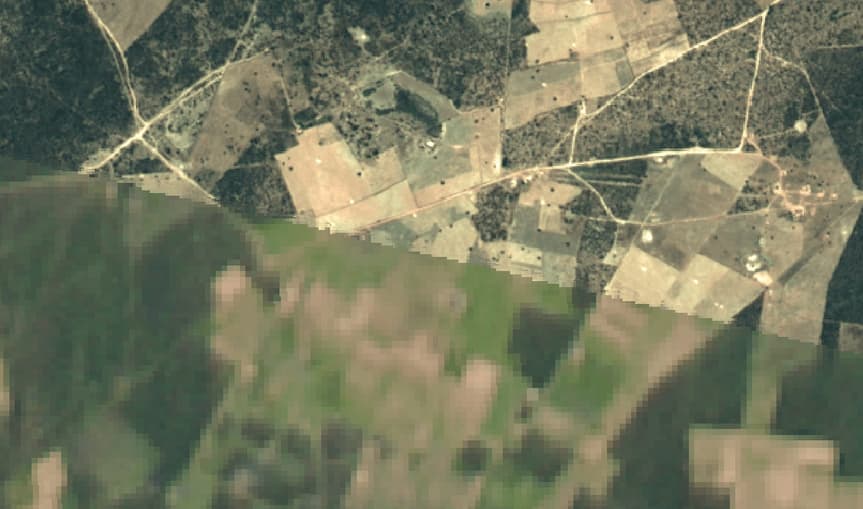
Variable native resolution
While the final products are delivered at a nominal pixel size of 5 meters (Visual) and 10 meters (Analytic), the source imagery consists of a mix of 5 m, 10 m, and 20 m native pixels. Because nearest neighbor resampling was used to preserve spectral integrity, the boundaries between different resolutions may be visible.
Residual misregistration
Despite the automated coregistration workflow, spatial shifts may persist in some areas. Residual misregistration is most likely to occur in regions with extreme terrain relief or in dense, homogeneous forest areas where the algorithm lacked sufficient landmarks to calculate high-confidence displacement vectors.
Atmospheric and cloud artifacts
The manual cloud masking process was intentionally conservative and aggressive; however, it is not exhaustive. Users may encounter occasional residual artifacts, such as very thin cirrus haze or small cloud shadows.
Radiometric inconsistency and ML performance
While histogram matching was used to minimize radiometric discontinuities, residual spectral variation remains between adjacent images. For automated land cover classification or machine learning applications, this variability increases the spectral variance for a given land cover type across the mosaic. This broader data range can reduce the precision of class separation during inference, potentially leading to higher rates of error.
Spectral saturation
In areas of extreme brightness—such as highly reflective urban surfaces, specific soil types, or bright sand—pixels may reach the sensor's maximum detectable limit. This "saturation" results in a loss of texture and detail in those specific locations.
Altered band ratios and vegetation indices
To achieve a near-seamless mosaic, histogram matching was applied to each spectral band individually, which inherently alters the original physical ratios between bands. As a result, calculating common indices like NDVI or other band-ratio metrics will produce values that differ from unaltered source datasets. While these derived indices may still capture relative spatial patterns across the mosaic, they should not be used for absolute purposes, cross-sensor comparisons, or analyses that rely on rigid index thresholds.