- Catalog Owner
- Nature Trace
- Dataset Availability
- 2018-01-01T00:00:00Z–2020-12-31T23:59:59Z
- Dataset Producer
- Tags
Description
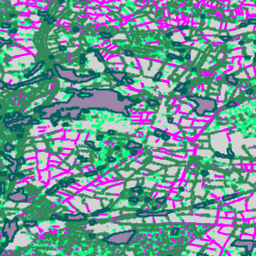
This is the vectorised version of the Farmscapes 2020 raster dataset. It provides polygon geometries representing fine-scale semi-natural landscape features (specifically hedgerows, woodland, and stone walls) across England's agricultural landscapes. This dataset was developed in collaboration with the Oxford Leverhulme Centre for Nature Recovery to serve as a baseline for applications including landscape restoration, biodiversity monitoring, and ecological connectivity analysis.
It is derived by vectorising the high-resolution (25cm) Farmscapes 2020 probability maps, filtered to exclude 'hedge gap' features, and simplified to retain only the feature classification attribute.
Limitations
- Geographic Scope: Model performance is reduced in dense urban environments and mountainous areas, which were underrepresented in the training data that focused primarily on rural landscapes.
- Temporal Accuracy: The source imagery was captured between 2018 and 2020. Consequently, the dataset does not account for landscape changes that have occurred since this period.
- Class-Specific performance: The stone wall class exhibits lower accuracy compared to woodland and hedgerows, a result of significant class imbalance in the training data.
Table Schema
Table Schema
| Name | Type | Description |
|---|---|---|
| feature_name | STRING | The type of the landscape feature: "hedgerow", "copse", "linear_woodland", "stone wall", or "woodland". |
Terms of Use
Terms of Use
This dataset is licensed under CC-BY 4.0 and requires the following attribution: "This dataset is produced by Google".
Citations
Michelangelo Conserva, Alex Wilson, Charlotte Stanton, Vishal Batchu, Varun Gulshan , "Mapping Farmed Landscapes from Remote Sensing" (in review). doi:10.48550/arXiv.2506.13993,
Explore with Earth Engine
Code Editor (JavaScript)
var fc = ee.FeatureCollection('projects/nature-trace/assets/farmscapes/england_v1_0_vectorised');

var styles = {
  'hedgerow': {color: 'FF00FF', fillColor: '40FF00FF'},
  'copse': {color: '00FF7F', fillColor: '4000FF7F'},
  'linear_woodland': {color: '2E8B57', fillColor: '402E8B57'},
  'stone wall': {color: 'D3D3D3', fillColor: '40D3D3D3'},
  'woodland': {color: '005e5e', fillColor: '40005e5e'},
};

var styleDict = ee.Dictionary(styles);

var styledFc = fc.map(function(f) {
  var featureStyle = ee.Dictionary(styleDict.get(f.get('feature_name')));
  return f.set('style', featureStyle);
});

var styledImage = styledFc.style({
  styleProperty: 'style', width: 2
});

Map.addLayer(styledImage, {}, 'Farmscapes Vectors');

var legend = ui.Panel({
  style: {
    position: 'top-left',
    padding: '8px 15px',
    backgroundColor: 'rgba(255, 255, 255, 0.9)',
    border: '1px solid black'
  }
});

legend.add(ui.Label({
  value: 'Farmscapes Vectors',
  style: {fontWeight: 'bold', fontSize: '16px', margin: '0 0 4px 0', padding: '0'}
}));

var palette = [
  {color: 'FF00FF', name: 'Hedgerow'},
  {color: '00FF7F', name: 'Copse'},
  {color: '2E8B57', name: 'Linear Woodland'},
  {color: 'D3D3D3', name: 'Stone Wall'},
  {color: '005e5e', name: 'Woodland'},
];

palette.forEach(function(item) {
  var colorBox = ui.Label({
    style: {backgroundColor: '#' + item.color, padding: '8px', margin: '0 0 4px 0'}
  });
  var desc = ui.Label({value: item.name, style: {margin: '0 0 4px 6px'}});
  legend.add(ui.Panel({
    widgets: [colorBox, desc],
    layout: ui.Panel.Layout.Flow('horizontal')
  }));
});

Map.add(legend);

var lon = -1.43;
var lat = 52.973;
Map.setCenter(lon, lat, 15);
Visualize as a FeatureView
A FeatureView is a view-only, accelerated representation of a
FeatureCollection. For more details, visit the
FeatureView documentation.
Code Editor (JavaScript)
var fv = ui.Map.FeatureViewLayer(
    'projects/nature-trace/assets/farmscapes/england_v1_0_vectorised_FeatureView');

fv.setVisParams({
  lineWidth: 2,
  color: '808080',
  polygonFillOpacity: 0.25,
  rules: [
    {
      filter: ee.Filter.eq('feature_name', 'hedgerow'),
      color: 'FF00FF',
      polygonFillColor: 'FF00FF'
    },
    {
      filter: ee.Filter.eq('feature_name', 'copse'),
      color: '00FF7F',
      polygonFillColor: '00FF7F'
    },
    {
      filter: ee.Filter.eq('feature_name', 'linear_woodland'),
      color: '2E8B57',
      polygonFillColor: '2E8B57'
    },
    {
      filter: ee.Filter.eq('feature_name', 'stone wall'),
      color: 'D3D3D3',
      polygonFillColor: 'D3D3D3'
    },
    {
      filter: ee.Filter.eq('feature_name', 'woodland'),
      color: '005e5e',
      polygonFillColor: '005e5e'
    }
  ]
});
fv.setName('Farmscapes Vectors');
Map.add(fv);

var legend = ui.Panel({
  style: {
    position: 'top-left',
    padding: '8px 15px',
    backgroundColor: 'rgba(255, 255, 255, 0.9)',
    border: '1px solid black'
  }
});
legend.add(ui.Label({
  value: 'Farmscapes Vectors',
  style:
      {fontWeight: 'bold', fontSize: '16px', margin: '0 0 4px 0', padding: '0'}
}));

var palette = [
  {color: 'FF00FF', name: 'Hedgerow'}, {color: '00FF7F', name: 'Copse'},
  {color: '2E8B57', name: 'Linear Woodland'},
  {color: 'D3D3D3', name: 'Stone Wall'}, {color: '005e5e', name: 'Woodland'},
];

palette.forEach(function(item) {
  var colorBox = ui.Label({
    style:
        {backgroundColor: '#' + item.color, padding: '8px', margin: '0 0 4px 0'}
  });
  var desc = ui.Label({value: item.name, style: {margin: '0 0 4px 6px'}});
  legend.add(ui.Panel(
      {widgets: [colorBox, desc], layout: ui.Panel.Layout.Flow('horizontal')}));
});

Map.add(legend);

var lon = -1.43;
var lat = 52.973;
Map.setCenter(lon, lat, 15);