Page Summary
-
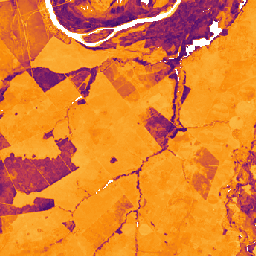
This dataset, part of the Global Pasture Watch Catalog, provides global median vegetation height from 2000 at 30-m spatial resolution.
-
The dataset is based on ICESat-2 ATL08 median height data and modeled using machine learning with GLAD Landsat ARD and additional covariates.
-
Originally for open ecosystems, the dataset offers global coverage but median height in forests should not be interpreted as top of canopy.
-
Limitations include sensitivity to vegetation heterogeneity, insufficient data density for seasonal changes, data restrictions, difficulty detecting very short vegetation, and underestimation of maximum heights.
- Catalog Owner
- Global Pasture Watch
- Dataset Availability
- 2000-01-01T00:00:00Z–2024-01-01T00:00:00Z
- Dataset Producer
- Land and Carbon Lab Global Pasture Watch
- Contact
- Land & Carbon Lab
- Cadence
- 1 Year
- Tags
Description
This dataset provides global median vegetation height from 2000 at 30-m spatial resolution. Produced by the Land & Carbon Lab’s Global Pasture Watch initiative, this dataset provides median vegetation height values (50th percentile) globally at 30-m spatial resolution from 2000 onwards. The dataset is based on ICESat-2 ATL08 median height of vegetation returns and is modeled via machine learning (ensemble Gradient Boosted Trees) using the GLAD Landsat ARD (collection-2) aggregated every two months (see Consoli et al., 2024) and combined with additional covariates, including terrain elevation (GEDTM30), geometric mean temperature, and MODIS long-term temperature and water vapor.
Originally designed to support the monitoring of open ecosystems (grasslands, open shrublands, savannas, tundra), the dataset offers wall-to-wall coverage of all terrestrial ecosystems. Thus, median height values of forest ecosystems should not be interpreted as top of canopy. For comparison with other existing canopy height products access the app GPW Height Comparison Toolkit (GPW-HCT).
Estimates of 90% prediction interval values (5th & 95th percentiles) are available in OpenLandMap STAC.
Per-pixel trend analysis are computed on-the-fly using GEE App.
Limitations:
Vegetation heterogeneity: The median height is sensitive to shrubs and trees within landscapes dominated by herbaceous cover. Users focused on herbaceous biomass should consider using fractional cover maps to address sub-pixel mixtures. Future versions may incorporate ICESat-2's vertical structure information for a better separation of woody cover.
Sub-annual and seasonal patterns: Current ICESat-2 data density is insufficient to map seasonal height changes common in grassy ecosystems. Increased Lidar acquisitions or denser sampling from ongoing measurement are needed to capture more frequent snapshots, which would improve monitoring of intra-annual changes and disturbances, including grazing, fire, and harvesting.
Data restrictions and uncertainty: The training data was restricted to strong-beam, night-time measurements to minimize signal noise, and additional filters were applied, but this does not fully account for all sources of data uncertainty in the ICESat-2 mission. Furthermore, cloud cover and smoke hinder signal penetration, increasing uncertainty in some regions. Specifically for 2019, the model presented slightly poorer performance compared to more recent years, which might be related to differences in data availability and quality at the beginning of the ICESat-2 mission.
Difficulty detecting very short vegetation: Lidar sensors, including ICESat-2, struggle to accurately measure very low canopies, especially with sparse cover or partial ground occlusion. The training data does not identify vegetation less than 50 cm from the ground surface, which may lead to overestimation of height in the shortest or most sparse land covers, such as wetland saltpans.
Underestimation of maximum heights: The trained machine learning model exhibited a tendency toward the mean, which resulted in overly narrow and optimistic prediction intervals. Due to the underestimation of vegetation height in the upper extremes, care should be taken when interpreting absolute values in regions with very tall forests, but relative patterns and trends are still informative.
Limited independent validation: While validated against ICESat-2 data (testing set), broader validation using airborne or drone Lidar would be necessary to fully assess the quality of the dataset at regional level.
For more information see Hunter et. al, 2025, Zenodo and Global Pasture Watch GitHub site
Bands
Bands
Pixel size: 30 meters (all bands)
| Name | Units | Min | Max | Scale | Pixel Size | Description |
|---|---|---|---|---|---|---|
height |
m | 0 | 10 | 0.1 | 30 meters | Median vegetation height |
Image Properties
Image Properties
| Name | Type | Description |
|---|---|---|
| version | INT | Product version |
Terms of Use
Terms of Use
Citations
Parente, L., Hunter, M., Ho, Y., Bonannella, C. el al. (2025). Global Pasture Watch - Annual short vegetation height maps at 30-m spatial resolution (2000—2022) (Version v1) [Data set]. Zenodo. doi:https://doi.org/10.5281/zenodo.15198654
Hunter, M.O., Parente, L., Ho, Yf. et al. (2025) Global 30-m annual median vegetation height maps (2000—2022) based on ICESat-2 data and Machine Learning. Scientific Data 12, 1470. doi: https://doi.org/10.1038/s41597-025-05739-6
DOIs
Explore with Earth Engine
Code Editor (JavaScript)
Map.setCenter(-49.265188, -16.602052, 4);

var short_veg_height_m = ee.ImageCollection("projects/global-pasture-watch/assets/gsvh-30m/v1/short-veg-height_m"),
    style = {"opacity":1,"bands":["height"],"min":0,"max":10,"palette":["#fcffa4","#f98d0a","#bb3755","#57106e","#000004"]};

var SCALE_FACTOR = 0.1
var svhVis = {min: 0, max: 10, palette: "fcffa4,f98d0a,bb3755,57106e,000004"}
var svh = ee.ImageCollection(
    "projects/global-pasture-watch/assets/gsvh-30m/v1/short-veg-height_m"
)

var svh2024 = svh.filterDate('2024-01-01', '2025-01-01').first().multiply(SCALE_FACTOR);
Map.addLayer(svh2024, svhVis, 'Median vegetation height (2024)');

var svh2000 = svh.filterDate('2000-01-01', '2001-01-01').first().multiply(SCALE_FACTOR);
Map.addLayer(svh2000, svhVis, 'Median vegetation height (2000)');