Page Summary
-
This dataset, which provided annual Landsat 8 images for Digital Earth Australia, was removed on March 01, 2025.
-
The dataset offered statistical tools including a geomedian for an "average" cloud-free image and median absolute deviation measures (EMAD, SMAD, BCMAD) to show annual landscape variance.
-
It was part of the Geoscience Australia Publisher Catalog and not managed by Google Earth Engine.
-
The dataset provided bands for various surface reflectances and median absolute deviations, as well as a count of pixels used for calculation.
-
The terms of use for this dataset were CC-BY-4.0.

- Catalog Owner
- Geoscience Australia
- Dataset Availability
- 2013-01-01T00:00:00Z–2022-01-01T00:00:00Z
- Dataset Producer
- Geoscience Australia NGIS
- Contact
- Geoscience Australia
- Tags
Description
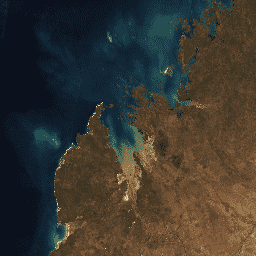
This product provides statistical tools to exploit the time series of Landsat 8 data available in Digital Earth Australia, providing annual images of general conditions and how much an area changes for a given year.
The geomedian part of the product provides an "average" cloud-free image over the given year. The geomedian image is calculated with a multi-dimensional median, using all the spectral measurements from the satellite imagery at the same time in order to maintain the relationships among the measurements.
The median absolute deviation part of the product uses three measures of variance, each of which provides a "second order" high dimensional statistical composite for the given year. The three variance measures show how much an area varies from the "average" in terms of "distance" based on factors such as brightness and spectra:
- Euclidean distance (EMAD)
- Cosine (spectral) distance (SMAD)
- Bray Curtis dissimilarity (BCMAD)
Together, they provide information on variance in the landscape over the given year and are useful for change detection applications.
For more information, please see the DEA Geometric Median and Median Absolute Deviation Landsat
This product is part of the Digital Earth Australia Program
Bands
Pixel Size
25 meters
Bands
| Name | Min | Max | Wavelength | Description |
|---|---|---|---|---|
blue |
0* | 10000* | 0.452-0.512 μm | Band blue surface reflectance geometric median. |
green |
0* | 10000* | 0.533-0.590 μm | Band green surface reflectance geometric median. |
red |
0* | 10000* | 0.636-0.673 μm | Band red surface reflectance geometric median. |
near_infrared |
0* | 10000* | 0.851-0.879 μm | Band near infrared surface reflectance geometric median. |
shortwave_infrared_1 |
0* | 10000* | 1.566-1.651 μm | Band shortwave infrared 1 surface reflectance geometric median. |
shortwave_infrared_2 |
0* | 10000* | 2.107-2.294 μm | Band shortwave infrared 2 surface reflectance geometric median. |
Euclidean_distance_median_absolute_deviation |
0* | 10000* | The Median Absolute Deviation using Euclidean distance (EMAD). EMAD is more sensitive to changes in target brightness. |
|
spectral_distance_median_absolute_deviation |
0* | 10000* | The Median Absolute Deviation using Cosine (spectral) distance (SMAD). SMAD is more sensitive to change in target spectral response. |
|
Bray_Curtis_dissimilarity_median_absolute_deviation |
0* | 10000* | The Median Absolute Deviation using Bray Curtis dissimilarity (BCMAD). BCMAD is more sensitive to the distribution of the observation values through time. |
|
count |
0* | 400* | The number of the available pixels used for calculation per calendar year. |
Terms of Use
Terms of Use
Citations
Roberts, D., Mueller, N., & Mcintyre, A. (2017). High-dimensional pixel composites from earth observation time series. IEEE Transactions on Geoscience and Remote Sensing, 55(11), 6254-6264. doi:10.1109/TGRS.2017.2723896. Roberts, D., Dunn, B., & Mueller, N. (2018). Open data cube products using high-dimensional statistics of time series. IGARSS 2018 - 2018 IEEE International Geoscience and Remote Sensing Symposium, 8647-8650. doi:10.1109/IGARSS.2018.8518312.
