- Disponibilidad del conjunto de datos
- 2018-06-11T00:00:00Z–2018-06-11T00:00:00Z
- Productor del conjunto de datos
- World Resources Institute
- Etiquetas
Descripción
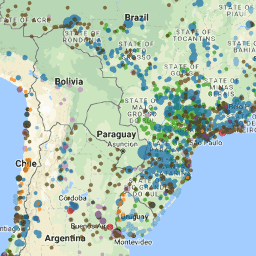
La base de datos Global Power Plant Database es una base de datos integral de código abierto de centrales eléctricas de todo el mundo. Centraliza los datos de las centrales eléctricas para facilitar la navegación, la comparación y la obtención de estadísticas. Cada central eléctrica está geolocalizada y las entradas contienen información sobre la capacidad, la generación, la propiedad y el tipo de combustible de la central. En junio de 2018, la base de datos incluía alrededor de 28,500 centrales eléctricas de 164 países. Se actualizará de forma continua a medida que haya datos disponibles.
La metodología para la creación del conjunto de datos se proporciona en la publicación del World Resources Institute "A Global Database of Power Plants".
El código asociado para la creación del conjunto de datos se puede encontrar en GitHub. La versión de vanguardia de la base de datos (que puede contener diferencias sustanciales con respecto a la versión de Earth Engine) también está disponible en GitHub.
Si usas este conjunto de datos, el proveedor (WRI) te solicita que registres tu uso y, de manera opcional, que te registres para recibir notificaciones de actualización.
Esquema de la tabla
Esquema de la tabla
| Nombre | Tipo | Descripción |
|---|---|---|
| country | STRING | Código de país de 3 caracteres que corresponde a las especificaciones de ISO 3166-1 alpha-3 |
| country_lg | STRING | Formato más largo de la designación del país |
| nombre | STRING | Nombre o título de la planta de energía, generalmente en forma romanizada |
| gppd_idnr | STRING | Identificador de 10 o 12 caracteres de la central eléctrica |
| capacitymw | DOUBLE | Capacidad de generación eléctrica en megavatios |
| latitud | DOUBLE | Ubicación geográfica en grados decimales |
| longitude | DOUBLE | Ubicación geográfica en grados decimales |
| fuel1 | STRING | Fuente de energía utilizada en la generación o exportación de electricidad |
| fuel2 | STRING | Fuente de energía utilizada en la generación o exportación de electricidad |
| fuel3 | STRING | Fuente de energía utilizada en la generación o exportación de electricidad |
| fuel4 | STRING | Fuente de energía utilizada en la generación o exportación de electricidad |
| comm_year | STRING | Año de operación de la planta, ponderado según la capacidad de la unidad cuando hay datos disponibles |
| propietario | STRING | Accionista mayoritario de la planta de energía, generalmente en forma romanizada |
| source | STRING | Entidad que informa los datos; puede ser una organización, un informe o un documento, generalmente en forma romanizada |
| url | STRING | Documento web correspondiente al campo "source" |
| src_latlon | STRING | Atribución de la información de ubicación geográfica |
| cap_year | DOUBLE | Año en que se informó la información de capacidad |
| gwh_2013 | DOUBLE | Generación de electricidad en gigavatios-hora para el año 2013 |
| gwh_2014 | DOUBLE | Generación de electricidad en gigavatios-hora para el año 2014 |
| gwh_2015 | DOUBLE | Generación de electricidad en gigavatios-hora registrada en el año 2015 |
| gwh_2016 | DOUBLE | Generación de electricidad en gigavatios-hora informada para el año 2016 |
| gwh_estimt | DOUBLE | Generación anual estimada de electricidad en gigavatios-hora para el año 2015 |
Condiciones de Uso
Condiciones de Uso
Citas
Global Energy Observatory, Google, KTH Royal Institute of Technology en Estocolmo, Universidad de Groningen y World Resources Institute. 2018. Base de datos de plantas de energía a nivel mundial. Se publicó en Resource Watch y Google Earth Engine. https://resourcewatch.org/ https://earthengine.google.com/
Explora con Earth Engine
Editor de código (JavaScript)
// Visualization for WRI/GPPD/power_plants

var table = ee.FeatureCollection('WRI/GPPD/power_plants');

// Get a color from a fuel
var fuelColor = ee.Dictionary({
  'Coal': '000000',
  'Oil': '593704',
  'Gas': 'bc80bd',
  'Hydro': '0565A6',
  'Nuclear': 'e31a1c',
  'Solar': 'ff7f00',
  'Waste': '6a3d9a',
  'Wind': '5ca2d1',
  'Geothermal': 'fdbf6f',
  'Biomass': '229a00'
});

// List of fuels to add to the map
var fuels = [
    'Coal', 'Oil', 'Gas', 'Hydro', 'Nuclear',
    'Solar', 'Waste', 'Wind', 'Geothermal', 'Biomass'];

/**
 * Computes size from capacity and color from fuel type.
 *
 * @param {!ee.Geometry.Point} pt A point
 * @return {!ee.Geometry.Point} Input point with added style dictionary.
 */
function addStyle(pt) {
  var size = ee.Number(pt.get('capacitymw')).sqrt().divide(10).add(2);
  var color = fuelColor.get(pt.get('fuel1'));
  return pt.set(
      'styleProperty', ee.Dictionary({'pointSize': size, 'color': color}));
}

// Make a FeatureCollection out of the power plant data table.
var pp = ee.FeatureCollection(table).map(addStyle);
print(pp.first());

/**
 * Adds power plants of a certain fuel type to the map.
 *
 * @param {string} fuel A fuel type
 */
function addLayer(fuel) {
  print(fuel);
  Map.addLayer(
      pp.filter(ee.Filter.eq('fuel1', fuel))
          .style({styleProperty: 'styleProperty', neighborhood: 50}),
      {}, fuel, true, 0.65);
}

// Apply `addLayer` to each record in `fuels`.
fuelColor.keys().evaluate(function(fuelsList) {
  fuelsList.map(addLayer);
});
Visualiza como FeatureView
Un FeatureView es una representación acelerada y de solo lectura de un FeatureCollection. Para obtener más detalles, consulta la
documentación de FeatureView.
Editor de código (JavaScript)
var fvLayer = ui.Map.FeatureViewLayer('WRI/GPPD/power_plants_FeatureView');

var visParams = {
  opacity: 0.65,
  color: {
    property: 'fuel1',
    categories: [
      ['Coal', '000000'],
      ['Oil', '593704'],
      ['Gas', 'bc80bd'],
      ['Hydro', '0565a6'],
      ['Nuclear', 'e31a1c'],
      ['Solar', 'ff7f00'],
      ['Waste', '6a3d9a'],
      ['Wind', '5ca2d1'],
      ['Geothermal', 'fdbf6f'],
      ['Biomass', '229a00']
    ],
    defaultValue: 'ffffff'
  },
  rules: [
    {
      filter: ee.Filter.expression('capacitymw < 500'),
      pointSize: 5,
    },
    {
      filter: ee.Filter.expression('capacitymw >= 500 AND capacitymw < 1000'),
      pointSize: 10,
    },
    {
      filter: ee.Filter.expression('capacitymw >= 1000'),
      pointSize: 15,
    }
  ]
};

fvLayer.setVisParams(visParams);
fvLayer.setName('Power plant (fuel type and capacity)');

Map.setCenter(16, 49, 4);
Map.add(fvLayer);