- 数据集可用时间
- 2018-06-11T00:00:00Z–2018-06-11T00:00:00Z
- 数据集生产者
- 世界资源研究所
- 标签
说明
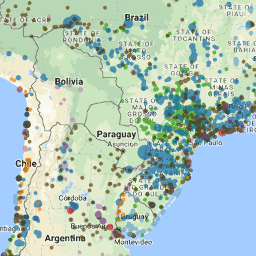
Global Power Plant Database 是一个全面的开源数据库,其中收录了世界各地的发电厂。它集中了发电厂数据,以便更轻松地浏览、比较和获取数据洞见。每个发电厂都有地理位置信息,条目包含发电厂容量、发电量、所有权和燃料类型方面的信息。截至 2018 年 6 月,该数据库包含来自 164 个国家/地区的大约 28,500 座发电厂。随着数据的不断发布,此页面也会持续更新。
有关数据集创建的方法,请参阅世界资源研究所的出版物 “A Global Database of Power Plants”。
有关创建数据集的相关代码可在 GitHub 上找到。 GitHub 上还提供了数据库的极新版本(可能与 Earth Engine 中的版本存在显著差异)。
如果您使用此数据集,提供方 (WRI) 要求您注册使用情况,并(可选)订阅以接收更新通知。
表格结构
表格结构
| 名称 | 类型 | 说明 |
|---|---|---|
| country | STRING | 与 ISO 3166-1 alpha-3 规范对应的 3 字符国家/地区代码 |
| country_lg | STRING | 国家/地区名称的完整形式 |
| name | STRING | 电厂的名称或标题,通常采用罗马化形式 |
| gppd_idnr | STRING | 电厂的 10 或 12 字符标识符 |
| capacitymw | 双精度 | 发电容量(以兆瓦为单位) |
| latitude | 双精度 | 以十进制度表示的地理定位 |
| longitude | 双精度 | 以十进制度表示的地理定位 |
| fuel1 | STRING | 发电或出口所用的能源 |
| fuel2 | STRING | 发电或出口所用的能源 |
| fuel3 | STRING | 发电或出口所用的能源 |
| fuel4 | STRING | 发电或出口所用的能源 |
| comm_year | STRING | 工厂运行年限(如有数据,则按单位容量加权) |
| 所有者 | STRING | 发电厂的大股东,一般以罗马化形式表示 |
| 来源 | STRING | 报告数据的实体;可以是组织、报告或文档,通常采用罗马化形式 |
| 网址 | STRING | 与“source”字段对应的 Web 文档 |
| src_latlon | STRING | 地理位置信息的提供方信息 |
| cap_year | 双精度 | 报告容量信息的年份 |
| gwh_2013 | 双精度 | 2013 年报告的发电量(以吉瓦时为单位) |
| gwh_2014 | 双精度 | 2014 年报告的发电量(以吉瓦时为单位) |
| gwh_2015 | 双精度 | 2015 年报告的发电量(以吉瓦时为单位) |
| gwh_2016 | 双精度 | 2016 年报告的发电量(以吉瓦时为单位) |
| gwh_estimt | 双精度 | 2015 年的估计年发电量(以吉瓦时为单位) |
使用条款
使用条款
引用
Global Energy Observatory、Google、斯德哥尔摩皇家理工学院、格罗宁根大学、世界资源研究所。2018 年。Global Power Plant Database。发布于 Resource Watch 和 Google Earth Engine;https://resourcewatch.org/ https://earthengine.google.com/
通过 Earth Engine 探索
代码编辑器 (JavaScript)
// Visualization for WRI/GPPD/power_plants

var table = ee.FeatureCollection('WRI/GPPD/power_plants');

// Get a color from a fuel
var fuelColor = ee.Dictionary({
  'Coal': '000000',
  'Oil': '593704',
  'Gas': 'bc80bd',
  'Hydro': '0565A6',
  'Nuclear': 'e31a1c',
  'Solar': 'ff7f00',
  'Waste': '6a3d9a',
  'Wind': '5ca2d1',
  'Geothermal': 'fdbf6f',
  'Biomass': '229a00'
});

// List of fuels to add to the map
var fuels = [
    'Coal', 'Oil', 'Gas', 'Hydro', 'Nuclear',
    'Solar', 'Waste', 'Wind', 'Geothermal', 'Biomass'];

/**
 * Computes size from capacity and color from fuel type.
 *
 * @param {!ee.Geometry.Point} pt A point
 * @return {!ee.Geometry.Point} Input point with added style dictionary.
 */
function addStyle(pt) {
  var size = ee.Number(pt.get('capacitymw')).sqrt().divide(10).add(2);
  var color = fuelColor.get(pt.get('fuel1'));
  return pt.set(
      'styleProperty', ee.Dictionary({'pointSize': size, 'color': color}));
}

// Make a FeatureCollection out of the power plant data table.
var pp = ee.FeatureCollection(table).map(addStyle);
print(pp.first());

/**
 * Adds power plants of a certain fuel type to the map.
 *
 * @param {string} fuel A fuel type
 */
function addLayer(fuel) {
  print(fuel);
  Map.addLayer(
      pp.filter(ee.Filter.eq('fuel1', fuel))
          .style({styleProperty: 'styleProperty', neighborhood: 50}),
      {}, fuel, true, 0.65);
}

// Apply `addLayer` to each record in `fuels`.
fuelColor.keys().evaluate(function(fuelsList) {
  fuelsList.map(addLayer);
});
以 FeatureView 形式直观呈现
FeatureView 是 FeatureCollection 的只读加速表示形式。如需了解详情,请访问
FeatureView 文档。
代码编辑器 (JavaScript)
var fvLayer = ui.Map.FeatureViewLayer('WRI/GPPD/power_plants_FeatureView');

var visParams = {
  opacity: 0.65,
  color: {
    property: 'fuel1',
    categories: [
      ['Coal', '000000'],
      ['Oil', '593704'],
      ['Gas', 'bc80bd'],
      ['Hydro', '0565a6'],
      ['Nuclear', 'e31a1c'],
      ['Solar', 'ff7f00'],
      ['Waste', '6a3d9a'],
      ['Wind', '5ca2d1'],
      ['Geothermal', 'fdbf6f'],
      ['Biomass', '229a00']
    ],
    defaultValue: 'ffffff'
  },
  rules: [
    {
      filter: ee.Filter.expression('capacitymw < 500'),
      pointSize: 5,
    },
    {
      filter: ee.Filter.expression('capacitymw >= 500 AND capacitymw < 1000'),
      pointSize: 10,
    },
    {
      filter: ee.Filter.expression('capacitymw >= 1000'),
      pointSize: 15,
    }
  ]
};

fvLayer.setVisParams(visParams);
fvLayer.setName('Power plant (fuel type and capacity)');

Map.setCenter(16, 49, 4);
Map.add(fvLayer);