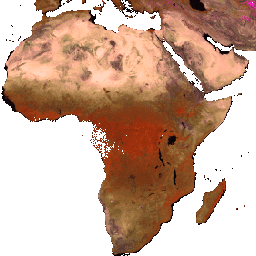
The mosaics are created by using the MODIS 8-Day 500 meter
BRDF-Albedo Quality product. Data Quality flags are used to select
the best observations from the MODIS 8-day 500 meter Nadir
BRDF-Adjusted Reflectance imagery product. This specific mosaic picks
observations from the three highest quality categories over
a 1-year period of MODIS data.
The MODIS NBAR annual mosaics have been used by government
agencies and NGOs in tropical countries as input to generate
aboveground biomass/carbon maps. The Woods Hole Research Center has
been using the dataset for country capacity building and technical
training workshops in tropical countries.
Bands
Pixel Size 463 meters
Bands
Name
Pixel Size
Wavelength
Description
Nadir_Reflectance_Band1
meters
620-670nm
Best NBAR at local solar noon for band 1
Nadir_Reflectance_Band2
meters
841-876nm
Best NBAR at local solar noon for band 2
Nadir_Reflectance_Band3
meters
459-479nm
Best NBAR at local solar noon for band 3
Nadir_Reflectance_Band4
meters
545-565nm
Best NBAR at local solar noon for band 4
Nadir_Reflectance_Band5
meters
1230-1250nm
Best NBAR at local solar noon for band 5
Nadir_Reflectance_Band6
meters
1628-1652nm
Best NBAR at local solar noon for band 6
Nadir_Reflectance_Band7
meters
2105-2155nm
Best NBAR at local solar noon for band 7
Terms of Use
Terms of Use
MODIS data and products acquired through the LP DAAC have no restrictions on subsequent use, sale, or redistribution.
Citations
Citations:
Baccini, A., Laporte, N., Goetz, S. J., Sun, M., & Dong, H. (2008). A first map of tropical Africa's above-ground biomass derived from satellite imagery. Environmental Research Letters, 3(4), 045011. doi:10.1088/1748-9326/3/4/045011
The mosaics are created by using the MODIS 8-Day 500 meter BRDF-Albedo Quality product. Data Quality flags are used to select the best observations from the MODIS 8-day 500 meter Nadir BRDF-Adjusted Reflectance imagery product. This specific mosaic picks observations from the three highest quality categories over a 1-year period …
[[["Easy to understand","easyToUnderstand","thumb-up"],["Solved my problem","solvedMyProblem","thumb-up"],["Other","otherUp","thumb-up"]],[["Missing the information I need","missingTheInformationINeed","thumb-down"],["Too complicated / too many steps","tooComplicatedTooManySteps","thumb-down"],["Out of date","outOfDate","thumb-down"],["Samples / code issue","samplesCodeIssue","thumb-down"],["Other","otherDown","thumb-down"]],[],[[["\u003cp\u003eThis dataset provides annual mosaics of MODIS Nadir BRDF-Adjusted Reflectance (NBAR) at 463 meters resolution, derived from the best observations over a 1-year period.\u003c/p\u003e\n"],["\u003cp\u003eIt covers the period from February 18, 2000, to January 1, 2017, and includes seven spectral bands.\u003c/p\u003e\n"],["\u003cp\u003eThe data has been used for generating aboveground biomass/carbon maps, particularly in tropical regions.\u003c/p\u003e\n"],["\u003cp\u003eIt is freely available for research, education, and non-profit use with no restrictions on subsequent use, sale, or redistribution.\u003c/p\u003e\n"],["\u003cp\u003eThe dataset is accessible through Google Earth Engine and can be explored using provided code snippets.\u003c/p\u003e\n"]]],["This dataset provides annual mosaics of MODIS Nadir BRDF-Adjusted Reflectance (NBAR) data from 2000 to 2017, derived from the MODIS 8-Day 500-meter BRDF-Albedo Quality product. Observations are selected based on the highest quality categories within each year. The mosaics, with a 463-meter pixel size, include seven reflectance bands at different wavelengths. It was developed by the Woods Hole Research Center and Boston University. The dataset is accessible through Google Earth Engine, with no restrictions on its use.\n"],null,["# MODIS 1-year Nadir BRDF-Adjusted Reflectance (NBAR) Mosaic\n\nDataset Availability\n: 2000-02-18T00:00:00Z--2017-01-01T00:00:00Z\n\nDataset Provider\n:\n\n\n [Baccini, A. (Woods Hole Research Center), Sulla-Menashe, D. (Boston University)](https://doi.org/10.1088/1748-9326/3/4/045011)\n\nCadence\n: 1 Year\n\nTags\n:\n albedo \n annual \n bu \n mcd43a4 \n modis-derived \n nbar \n reflectance \n satellite-imagery \nwhrc \n\n#### Description\n\nThe mosaics are created by using the MODIS 8-Day 500 meter\nBRDF-Albedo Quality product. Data Quality flags are used to select\nthe best observations from the MODIS 8-day 500 meter Nadir\nBRDF-Adjusted Reflectance imagery product. This specific mosaic picks\nobservations from the three highest quality categories over\na 1-year period of MODIS data.\n\nThe MODIS NBAR annual mosaics have been used by government\nagencies and NGOs in tropical countries as input to generate\naboveground biomass/carbon maps. The Woods Hole Research Center has\nbeen using the dataset for country capacity building and technical\ntraining workshops in tropical countries.\n\n### Bands\n\n\n**Pixel Size**\n\n463 meters\n\n**Bands**\n\n| Name | Pixel Size | Wavelength | Description |\n|---------------------------|------------|-------------|------------------------------------------|\n| `Nadir_Reflectance_Band1` | meters | 620-670nm | Best NBAR at local solar noon for band 1 |\n| `Nadir_Reflectance_Band2` | meters | 841-876nm | Best NBAR at local solar noon for band 2 |\n| `Nadir_Reflectance_Band3` | meters | 459-479nm | Best NBAR at local solar noon for band 3 |\n| `Nadir_Reflectance_Band4` | meters | 545-565nm | Best NBAR at local solar noon for band 4 |\n| `Nadir_Reflectance_Band5` | meters | 1230-1250nm | Best NBAR at local solar noon for band 5 |\n| `Nadir_Reflectance_Band6` | meters | 1628-1652nm | Best NBAR at local solar noon for band 6 |\n| `Nadir_Reflectance_Band7` | meters | 2105-2155nm | Best NBAR at local solar noon for band 7 |\n\n### Terms of Use\n\n**Terms of Use**\n\nMODIS data and products acquired through the LP DAAC have no restrictions on subsequent use, sale, or redistribution.\n\n### Citations\n\nCitations:\n\n- Baccini, A., Laporte, N., Goetz, S. J., Sun, M., \\& Dong, H. (2008). A first map of tropical Africa's above-ground biomass derived from satellite imagery. Environmental Research Letters, 3(4), 045011. [doi:10.1088/1748-9326/3/4/045011](https://doi.org/10.1088/1748-9326/3/4/045011)\n\n### DOIs\n\n- \u003chttps://doi.org/10.1088/1748-9326/3/4/045011\u003e\n\n### Explore with Earth Engine\n\n| **Important:** Earth Engine is a platform for petabyte-scale scientific analysis and visualization of geospatial datasets, both for public benefit and for business and government users. Earth Engine is free to use for research, education, and nonprofit use. To get started, please [register for Earth Engine access.](https://console.cloud.google.com/earth-engine)\n\n### Code Editor (JavaScript)\n\n```javascript\nvar dataset = ee.ImageCollection('WHBU/NBAR_1YEAR');\n\nMap.addLayer(dataset.mean(), {min:0, max:7000});\n```\n[Open in Code Editor](https://code.earthengine.google.com/?scriptPath=Examples:Datasets/WHBU/WHBU_NBAR_1YEAR) \n[MODIS 1-year Nadir BRDF-Adjusted Reflectance (NBAR) Mosaic](/earth-engine/datasets/catalog/WHBU_NBAR_1YEAR) \nThe mosaics are created by using the MODIS 8-Day 500 meter BRDF-Albedo Quality product. Data Quality flags are used to select the best observations from the MODIS 8-day 500 meter Nadir BRDF-Adjusted Reflectance imagery product. This specific mosaic picks observations from the three highest quality categories over a 1-year period ... \nWHBU/NBAR_1YEAR, albedo,annual,bu,mcd43a4,modis-derived,nbar,reflectance,satellite-imagery \n2000-02-18T00:00:00Z/2017-01-01T00:00:00Z \n-60.1 -180 60.1 180 \nGoogle Earth Engine \nhttps://developers.google.com/earth-engine/datasets\n\n- [https://doi.org/10.1088/1748-9326/3/4/045011](https://doi.org/https://doi.org/10.1088/1748-9326/3/4/045011)\n- [https://doi.org/10.1088/1748-9326/3/4/045011](https://doi.org/https://developers.google.com/earth-engine/datasets/catalog/WHBU_NBAR_1YEAR)"]]