Page Summary
-
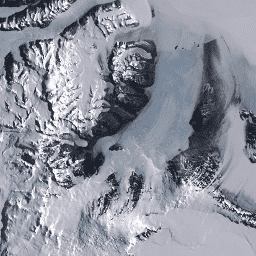
The Landsat Image Mosaic of Antarctica (LIMA) is a seamless and virtually cloudless mosaic created from processed Landsat 7 ETM+ scenes.
-
This dataset is the 16-bit Intermediate LIMA, consisting of pan-sharpened normalized surface reflectance scenes (Landsat ETM+ bands 1, 2, 3, and 4).
-
The mosaic has a pixel size of 15 meters and includes bands for Blue, Green, Red, and Near infrared wavelengths.
-
Images are in the public domain and can be used freely, though credit to the LIMA Project is appreciated.
- Dataset Availability
- 1999-06-30T00:00:00Z–2002-09-04T00:00:00Z
- Dataset Producer
- USGS
- Tags
Description
The Landsat Image Mosaic of Antarctica (LIMA) is a seamless and virtually cloudless mosaic created from processed Landsat 7 ETM+ scenes.
This LIMA dataset is the 16-bit Intermediate LIMA. The mosaic consists of pan-sharpened normalized surface reflectance scenes (Landsat ETM+ bands 1, 2, 3, and 4). The mosaic was constructed by ordering cloud free images on top and trimming image boundaries when tile discontinuities occurred.
Users can find the mosaic tile footprints available at: USGS/LIMA/MOSAIC_TILE_FOOTPRINTS
Bands
Bands
Pixel size: 15 meters (all bands)
| Name | Pixel Size | Wavelength | Description |
|---|---|---|---|
B1 |
15 meters | 0.45 - 0.52 μm | Blue |
B2 |
15 meters | 0.52 - 0.60 μm | Green |
B3 |
15 meters | 0.63 - 0.69 μm | Red |
B4 |
15 meters | 0.77 - 0.90 μm | Near infrared |
Terms of Use
Terms of Use
These images are in the public domain and can be used freely and without acknowledgement. However, credit to the Landsat Image Mosaic of Antarctica (LIMA) Project is greatly appreciated.
Citations
Bindschadler, R., Vornberger, P., Fleming, A., Fox, A., Mullins, J., Binnie, D., Paulson, S., Granneman, B., and Gorodetzky, D., 2008, The Landsat Image Mosaic of Antarctica, Remote Sensing of Environment, 112, pp. 4214-4226. PDF
Explore with Earth Engine
Code Editor (JavaScript)
var dataset = ee.Image('USGS/LIMA/MOSAIC');
var antarctica = dataset.select(['B3', 'B2', 'B1']);
var antarcticaVis = {
  min: 0.0,
  max: 10000.0,
};
Map.setCenter(164.619, -77.99, 7);
Map.addLayer(antarctica, antarcticaVis, 'Antartica Imagery (RGB)');