Page Summary
-
This dataset, providing high-resolution global cropland data, has been superseded by USGS/GFSAD1000_V1.
-
The data is from 2010, covers five major global cropland types at a nominal 1km scale, and is an 8-class product.
-
The dataset includes a 'landcover' band with a pixel size of 1000 meters, representing crop dominance classes.
-
Information from this dataset, provided by the USGS, is generally in the public domain and can be used without restriction.
- Dataset Availability
- 2010-01-01T00:00:00Z–2011-01-01T00:00:00Z
- Dataset Producer
- Global Food Security-support Analysis Data at 30m Project (GFSAD30)
- Tags
Description
The GFSAD is a NASA-funded project to provide high-resolution global cropland data and their water use that contributes towards global food security in the twenty-first century. The GFSAD products are derived through multi-sensor remote sensing data (e.g., Landsat, MODIS, AVHRR), secondary data, and field-plot data and aims at documenting cropland dynamics.
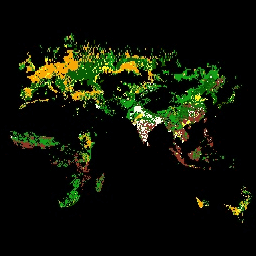
At a nominal 1km scale, V0.0 provides the spatial distribution of the five major global cropland types (wheat, rice, corn, barley, and soybeans) which occupy 60% of all global cropland areas. The map is produced by overlaying these crops over the remote sensing derived global irrigated and rainfed cropland area map of the International Water Management Institute. V0.0 an 8-class product that provides information on global: cropland extent, crop dominance, irrigated versus rainfed cropping, and cropping intensity (single, double, triple, and continuous crops). The GFSAD1000 nominal 2010 product was created with data from 2007 to 2012.
Bands
Bands
Pixel size: 1000 meters (all bands)
| Name | Min | Max | Pixel Size | Description |
|---|---|---|---|---|
landcover |
0 | 9 | 1000 meters | Crop dominance class descriptions |
landcover Class Table
| Value | Color | Description |
|---|---|---|
| 0 | black | Non-croplands |
| 1 | white | Irrigated: wheat and rice |
| 2 | green | Irrigated mixed crops 1: Wheat, rice, barley, soybeans |
| 3 | yellow | Irrigated mixed crops 2: wheat, rice, cotton, orchards |
| 4 | brown | Rainfed: wheat, rice, soybeans, sugarcane, corn, cassava |
| 5 | orange | Rainfed: wheat, barley |
| 6 | forestgreen | Rainfed: corn, soybens |
| 7 | darkgreen | Rainfed mixed crops: wheat, corn, rice, barley, soybeans |
| 8 | darkseagreen | Fractions of mixed crops: wheat, maize, rice, barley, soybeans |
| 9 | purple | Other classes |
Terms of Use
Terms of Use
Most U.S. Geological Survey (USGS) information resides in the public domain and may be used without restriction. Additional information on Acknowledging or Crediting USGS as Information Source is available.
Citations
Thenkabail P.S., Knox J.W., Ozdogan, M., Gumma, M.K., Congalton, R.G., Wu, Z., Milesi, C., Finkral, A., Marshall, M., Mariotto, I., You, S. Giri, C. and Nagler, P. 2012. Assessing future risks to agricultural productivity, water resources and food security: how can remote sensing help?. Photogrammetric Engineering and Remote Sensing, August 2012 Special Issue on Global Croplands: Highlight Article. 78(8): 773-782.
Explore with Earth Engine
Code Editor (JavaScript)
var dataset = ee.Image('USGS/GFSAD1000_V0');
var cropDominance = dataset.select('landcover');
var cropDominanceVis = {
  min: 0.0,
  max: 9.0,
  palette: [
    'black', 'white', 'green', 'yellow', 'brown', 'orange', '02be11', '015e08',
    '02a50f', 'purple'
  ],
};
Map.setCenter(-17.22, 13.72, 2);
Map.addLayer(cropDominance, cropDominanceVis, 'Crop Dominance');