Page Summary
-
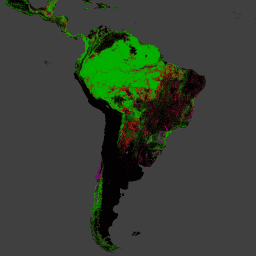
This dataset provides results from time-series analysis of Landsat images showing global forest extent and change from 2000 to 2022.
-
The dataset includes bands representing tree canopy cover in 2000, forest loss during the study period, forest gain from 2000-2012, year of forest loss, and reference multispectral imagery.
-
This specific version of the dataset has been superseded by a newer version.
- Dataset Availability
- 2000-01-01T00:00:00Z–2022-01-01T00:00:00Z
- Dataset Producer
- Hansen/UMD/Google/USGS/NASA
- Tags
Description
Results from time-series analysis of Landsat images in characterizing global forest extent and change.
The 'first' and 'last' bands are reference multispectral imagery from the first and last available years for Landsat spectral bands corresponding to red, NIR, SWIR1, and SWIR2. Reference composite imagery represents median observations from a set of quality-assessed growing-season observations for each of these bands.
Please see the User Notes for this Version 1.10 update, as well as the associated journal article: Hansen, Potapov, Moore, Hancher et al. "High-resolution global maps of 21st-century forest cover change." Science 342.6160 (2013): 850-853.
Bands
Bands
Pixel size: 30.92 meters (all bands)
| Name | Units | Min | Max | Pixel Size | Wavelength | Description | |||||||||||||||||||||||||||||||||||||||||||||||||||||||||||||||||||||||||||||||||||||||||||||
|---|---|---|---|---|---|---|---|---|---|---|---|---|---|---|---|---|---|---|---|---|---|---|---|---|---|---|---|---|---|---|---|---|---|---|---|---|---|---|---|---|---|---|---|---|---|---|---|---|---|---|---|---|---|---|---|---|---|---|---|---|---|---|---|---|---|---|---|---|---|---|---|---|---|---|---|---|---|---|---|---|---|---|---|---|---|---|---|---|---|---|---|---|---|---|---|---|---|---|---|
treecover2000 |
% | 0 | 100 | 30.92 meters | None | Tree canopy cover for year 2000, defined as canopy closure for all vegetation taller than 5m in height. |
|||||||||||||||||||||||||||||||||||||||||||||||||||||||||||||||||||||||||||||||||||||||||||||
loss |
30.92 meters | None | Forest loss during the study period, defined as a stand-replacement disturbance (a change from a forest to non-forest state). |
||||||||||||||||||||||||||||||||||||||||||||||||||||||||||||||||||||||||||||||||||||||||||||||||
gain |
30.92 meters | None | Forest gain during the period 2000-2012, defined as the inverse of loss (a non-forest to forest change entirely within the study period). Note that this has not been updated in subsequent versions. |
||||||||||||||||||||||||||||||||||||||||||||||||||||||||||||||||||||||||||||||||||||||||||||||||
first_b30 |
30.92 meters | 0.63-0.69µm | Landsat 7 band 3 (red) cloud-free image composite. Reference multispectral imagery from the first available year, typically 2000. |
||||||||||||||||||||||||||||||||||||||||||||||||||||||||||||||||||||||||||||||||||||||||||||||||
first_b40 |
30.92 meters | 0.77-0.90µm | Landsat 7 band 4 (NIR) cloud-free image composite. Reference multispectral imagery from the first available year, typically 2000. |
||||||||||||||||||||||||||||||||||||||||||||||||||||||||||||||||||||||||||||||||||||||||||||||||
first_b50 |
30.92 meters | 1.55-1.75µm | Landsat 7 band 5 (SWIR) cloud-free image composite. Reference multispectral imagery from the first available year, typically 2000. |
||||||||||||||||||||||||||||||||||||||||||||||||||||||||||||||||||||||||||||||||||||||||||||||||
first_b70 |
30.92 meters | 2.09-2.35µm | Landsat 7 band 7 (SWIR) cloud-free image composite. Reference multispectral imagery from the first available year, typically 2000. |
||||||||||||||||||||||||||||||||||||||||||||||||||||||||||||||||||||||||||||||||||||||||||||||||
last_b30 |
30.92 meters | 0.63-0.69µm | Landsat 7 band 3 (red) cloud-free image composite. Reference multispectral imagery from the last available year, typically the last year of the study period. |
||||||||||||||||||||||||||||||||||||||||||||||||||||||||||||||||||||||||||||||||||||||||||||||||
last_b40 |
30.92 meters | 0.77-0.90µm | Landsat 7 band 4 (NIR) cloud-free image composite. Reference multispectral imagery from the last available year, typically the last year of the study period. |
||||||||||||||||||||||||||||||||||||||||||||||||||||||||||||||||||||||||||||||||||||||||||||||||
last_b50 |
30.92 meters | 1.55-1.75µm | Landsat 7 band 5 (SWIR) cloud-free image composite. Reference multispectral imagery from the last available year, typically the last year of the study period. |
||||||||||||||||||||||||||||||||||||||||||||||||||||||||||||||||||||||||||||||||||||||||||||||||
last_b70 |
30.92 meters | 2.09-2.35µm | Landsat 7 band 7 (SWIR) cloud-free image composite. Reference multispectral imagery from the last available year, typically the last year of the study period. |
||||||||||||||||||||||||||||||||||||||||||||||||||||||||||||||||||||||||||||||||||||||||||||||||
datamask |
30.92 meters | None | Three values representing areas of no data, mapped land surface, and permanent water bodies. |
||||||||||||||||||||||||||||||||||||||||||||||||||||||||||||||||||||||||||||||||||||||||||||||||
lossyear |
0 | 22 | 30.92 meters | None | Year of gross forest cover loss event. Forest loss during the study period, defined as a stand-replacement disturbance, or a change from a forest to non-forest state. Encoded as either 0 (no loss) or else a value in the range 1-22, representing loss detected primarily in the year 2001-2022, respectively. |
||||||||||||||||||||||||||||||||||||||||||||||||||||||||||||||||||||||||||||||||||||||||||||||
Terms of Use
Terms of Use
Citations
Hansen, M. C., P. V. Potapov, R. Moore, M. Hancher, S. A. Turubanova, A. Tyukavina, D. Thau, S. V. Stehman, S. J. Goetz, T. R. Loveland, A. Kommareddy, A. Egorov, L. Chini, C. O. Justice, and J. R. G. Townshend. 2013. "High-Resolution Global Maps of 21st-Century Forest Cover Change." Science 342 (15 November): 850-53. 10.1126/science.1244693 Data available on-line at: https://glad.earthengine.app/view/global-forest-change.
DOIs
Explore with Earth Engine
Code Editor (JavaScript)
var dataset = ee.Image('UMD/hansen/global_forest_change_2022_v1_10');
var treeCoverVisParam = {
  bands: ['treecover2000'],
  min: 0,
  max: 100,
  palette: ['black', 'green']
};
Map.addLayer(dataset, treeCoverVisParam, 'tree cover');

var treeLossVisParam = {
  bands: ['lossyear'],
  min: 0,
  max: 22,
  palette: ['yellow', 'red']
};
Map.addLayer(dataset, treeLossVisParam, 'tree loss year');
import ee
import geemap.core as geemap
Colab (Python)
dataset = ee.Image('UMD/hansen/global_forest_change_2022_v1_10')

tree_cover_vis_param = {
    'bands': ['treecover2000'],
    'min': 0,
    'max': 100,
    'palette': ['black', 'green'],
}

tree_loss_vis_param = {
    'bands': ['lossyear'],
    'min': 0,
    'max': 22,
    'palette': ['yellow', 'red'],
}

m = geemap.Map()
m.add_layer(dataset, tree_cover_vis_param, 'tree cover')
m.add_layer(dataset, tree_loss_vis_param, 'tree loss year')
m