- 数据集可用时间
- 1981-01-01T00:00:00Z–2026-03-26T00:00:00Z
- 数据集生产者
- UCSB/CHC
- 步频
- 1 Custom_time_unit
- 标签
说明
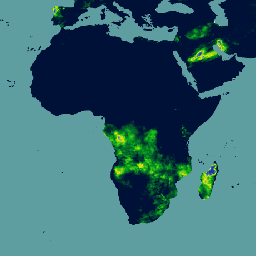
Climate Hazards Center Infrared Precipitation with Stations (CHIRPS v3) 是一个 40 多年的高分辨率准全球降雨量数据集。它涵盖北纬 60 度到南纬 60 度之间的所有经度,提供从 1981 年到近期的降雨量数据。CHIRPS v3 将基于卫星的热红外降雨量估算值与实地观测站观测值相结合,生成陆地上 0.05° 网格化的降雨量时间序列。这是该数据集的 3.0 版,如需了解详情,请参阅 the CHC page。
频段
频段
像素大小:5566 米(所有频段)
| 名称 | 单位 | 最小值 | 全速 | 像素大小 | 说明 |
|---|---|---|---|---|---|
precipitation |
毫米/五日 | 0* | 1072.43* | 5566 米 | 降水概率 |
图像属性
图像属性
| 名称 | 类型 | 说明 |
|---|---|---|
| 月 | 双精度 | 月 |
| 五日 | 双精度 | 五日 |
| 年 | 双精度 | 年 |
使用条款
使用条款
本数据集属于公共领域。在法律允许的最大范围内, Pete Peterson 已放弃对 Climate Hazards Center Infrared Precipitation with Stations (CHIRPS) 的所有版权及相关或邻接权利。
引用
引用:
Climate Hazards Center Infrared Precipitation with Stations version 3. CHIRPS3 数据仓库 doi:10.15780/G2JQ0P (2025)。
通过 Earth Engine 探索
代码编辑器 (JavaScript)
var dataset = ee.ImageCollection('UCSB-CHC/CHIRPS/V3/PENTAD')
                  .filter(ee.Filter.date('2018-05-01', '2018-05-05'));
var precipitation = dataset.select('precipitation');
var precipitationVis = {
  min: 0,
  max: 112,
  palette: ['#001137', '#0aab1e', '#e7eb05', '#2c7fb8', '#253494'],
};
Map.setCenter(17.93, 7.71, 2);
Map.addLayer(precipitation, precipitationVis, 'Precipitation');