- Dataset Availability
- 1978-11-01T00:00:00Z–2026-07-12T00:00:00Z
- Dataset Producer
- NASA / GES DISC
- Cadence
- 1 Day
- Tags
Description
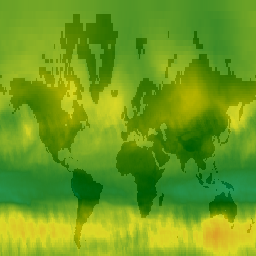
The Total Ozone Mapping Spectrometer (TOMS) data represent the primary long-term, continuous record of satellite-based observations available for use in monitoring global and regional trends in total ozone over the past 25 years. The data are produced by the Laboratory for Atmospheres at NASA's Goddard Space Flight Center. Version 8 TOMS data products include level 3 gridded data (1.0 x 1.25 deg). The Ozone Monitoring Instrument (OMI), aboard the Aura satellite (July 2004 - current), has a higher resolution (1.0 x 1.0 deg).
These data represent a merged ozone product from TOMS/EarthProbe, TOMS/Nimbus-7, TOMS/Meteor-3, OMI/Aura and USGS-interpolated data for dates with no data.
See this document for a summary of changes between v3 and v4.
Bands
Bands
Pixel size: 111000 meters (all bands)
| Name | Units | Min | Max | Pixel Size | Description |
|---|---|---|---|---|---|
ozone |
Dobson | 73* | 983* | 111000 meters | Total column ozone |
Terms of Use
Terms of Use
Distribution of data from the Goddard Earth Sciences Data and Information Services Center (GES DISC) is funded by NASA's Science Mission Directorate (SMD). Consistent with NASA Earth Science Data and Information Policy, data from the GES DISC archive are available free to the user community. For more information visit the GES DISC Data Policy page.
Citations
The data set source should be properly cited when the data are used. A formal reference of the form: <authors>, 2012, last updated 2013: <dataset name>. NASA/GSFC, Greenbelt, MD, USA, NASA Goddard Earth Sciences Data and Information Services Center (GES DISC). Accessed <enter user data access date> at <DOI> is suggested following Parsons et al. (2010), doi:10.1029/2010EO340001
Explore with Earth Engine
Code Editor (JavaScript)
var dataset = ee.ImageCollection('TOMS/MERGED_V4')
                  .filter(ee.Filter.date('2018-08-01', '2018-08-10'));
var columnOzone = dataset.select('ozone');
var columnOzoneVis = {
  min: 100,
  max: 500,
  palette: ['1621a2', 'cyan', 'green', 'yellow', 'orange', 'red'],
};
Map.setCenter(6.75, 46.53, 2);
Map.addLayer(columnOzone, columnOzoneVis, 'Column Ozone');