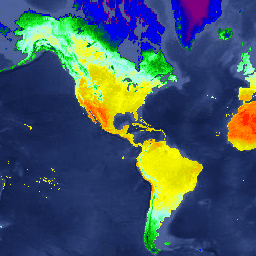
The underlying dataset for this daytime product is MODIS land surface
temperature data (MOD11A2), which was gap-filled using the approach
outlined in Weiss et al. (2014) to eliminate missing data caused by factors
such as cloud cover. Gap-free outputs were then aggregated temporally and
spatially to produce the monthly ≈5km product.
This dataset was produced by Harry Gibson and Daniel Weiss of the
Malaria Atlas Project (Big Data Institute, University of Oxford,
United Kingdom, https://malariaatlas.org/).
Bands
Pixel Size 5000 meters
Bands
Name
Units
Min
Max
Pixel Size
Description
Mean
°C
-74.03*
63.87*
meters
The mean value of daytime land surface temperature for each aggregated pixel.
FilledProportion
%
0*
100*
meters
A quality control band that indicates the percentage of
each resulting pixel that was comprised of raw data (as opposed to
gap-filled estimates).
Weiss, D.J., P.M. Atkinson, S. Bhatt, B. Mappin, S.I. Hay & P.W. Gething
(2014) An effective approach for gap-filling continental scale remotely
sensed time-series. ISPRS Journal of Photogrammetry and Remote Sensing,
98, 106-118.
The underlying dataset for this daytime product is MODIS land surface temperature data (MOD11A2), which was gap-filled using the approach outlined in Weiss et al. (2014) to eliminate missing data caused by factors such as cloud cover. Gap-free outputs were then aggregated temporally and spatially to produce the monthly ≈5km …
[[["Easy to understand","easyToUnderstand","thumb-up"],["Solved my problem","solvedMyProblem","thumb-up"],["Other","otherUp","thumb-up"]],[["Missing the information I need","missingTheInformationINeed","thumb-down"],["Too complicated / too many steps","tooComplicatedTooManySteps","thumb-down"],["Out of date","outOfDate","thumb-down"],["Samples / code issue","samplesCodeIssue","thumb-down"],["Other","otherDown","thumb-down"]],[],[[["\u003cp\u003eThis dataset provides monthly daytime land surface temperature data at a 5km resolution, derived from MODIS and gap-filled to address cloud cover issues.\u003c/p\u003e\n"],["\u003cp\u003eThe data covers the period from March 2001 to June 2015 and was produced by the Oxford Malaria Atlas Project.\u003c/p\u003e\n"],["\u003cp\u003eIt includes a band indicating the percentage of raw data used in each pixel for quality control.\u003c/p\u003e\n"],["\u003cp\u003eThe dataset is available under a CC-BY-NC-SA-4.0 license and can be accessed and analyzed within Google Earth Engine.\u003c/p\u003e\n"],["\u003cp\u003eThis product is based on the methodology outlined in Weiss et al.(2014) for gap-filling continental-scale remotely sensed time-series data.\u003c/p\u003e\n"]]],[],null,["Dataset Availability\n: 2001-03-01T00:00:00Z--2015-06-01T00:00:00Z\n\nDataset Provider\n:\n\n\n [Oxford Malaria Atlas Project](https://www.bdi.ox.ac.uk/research/malaria-atlas-project)\n\nCadence\n: 1 Month\n\nTags\n:\n[climate](/earth-engine/datasets/tags/climate) [lst](/earth-engine/datasets/tags/lst) [map](/earth-engine/datasets/tags/map) [oxford](/earth-engine/datasets/tags/oxford) [surface-temperature](/earth-engine/datasets/tags/surface-temperature) \n\nDescription \nThe underlying dataset for this daytime product is MODIS land surface\ntemperature data (MOD11A2), which was gap-filled using the approach\noutlined in Weiss et al. (2014) to eliminate missing data caused by factors\nsuch as cloud cover. Gap-free outputs were then aggregated temporally and\nspatially to produce the monthly ≈5km product.\n\nThis dataset was produced by Harry Gibson and Daniel Weiss of the\nMalaria Atlas Project (Big Data Institute, University of Oxford,\nUnited Kingdom, \u003chttps://malariaatlas.org/\u003e).\n\nBands\n\n\n**Pixel Size**\n\n5000 meters\n\n**Bands**\n\n| Name | Units | Min | Max | Description |\n|--------------------|-------|----------|---------|---------------------------------------------------------------------------------------------------------------------------------------------------|\n| `Mean` | °C | -74.03\\* | 63.87\\* | The mean value of daytime land surface temperature for each aggregated pixel. |\n| `FilledProportion` | % | 0\\* | 100\\* | A quality control band that indicates the percentage of each resulting pixel that was comprised of raw data (as opposed to gap-filled estimates). |\n\n\\* estimated min or max value\n\nTerms of Use\n\n**Terms of Use**\n\n[CC-BY-NC-SA-4.0](https://spdx.org/licenses/CC-BY-NC-SA-4.0.html)\n\nCitations \nCitations:\n\n- Weiss, D.J., P.M. Atkinson, S. Bhatt, B. Mappin, S.I. Hay \\& P.W. Gething\n (2014) An effective approach for gap-filling continental scale remotely\n sensed time-series. ISPRS Journal of Photogrammetry and Remote Sensing,\n 98, 106-118.\n\nExplore with Earth Engine **Important:** Earth Engine is a platform for petabyte-scale scientific analysis and visualization of geospatial datasets, both for public benefit and for business and government users. Earth Engine is free to use for research, education, and nonprofit use. To get started, please [register for Earth Engine access.](https://console.cloud.google.com/earth-engine)\n\nCode Editor (JavaScript) \n\n```javascript\nvar dataset = ee.ImageCollection('Oxford/MAP/LST_Day_5km_Monthly')\n .filter(ee.Filter.date('2015-01-01', '2015-12-31'));\nvar daytimeLandSurfaceTemp = dataset.select('Mean');\nvar visParams = {\n min: -20.0,\n max: 50.0,\n palette: [\n '800080', '0000ab', '0000ff', '008000', '19ff2b', 'a8f7ff', 'ffff00',\n 'd6d600', 'ffa500', 'ff6b01', 'ff0000'\n ],\n};\nMap.setCenter(-88.6, 26.4, 1);\nMap.addLayer(\n daytimeLandSurfaceTemp, visParams, 'Daytime Land Surface Temperature');\n```\n[Open in Code Editor](https://code.earthengine.google.com/?scriptPath=Examples:Datasets/Oxford/Oxford_MAP_LST_Day_5km_Monthly) \n[Oxford MAP LST: Malaria Atlas Project Gap-Filled Daytime Land Surface Temperature](/earth-engine/datasets/catalog/Oxford_MAP_LST_Day_5km_Monthly) \nThe underlying dataset for this daytime product is MODIS land surface temperature data (MOD11A2), which was gap-filled using the approach outlined in Weiss et al. (2014) to eliminate missing data caused by factors such as cloud cover. Gap-free outputs were then aggregated temporally and spatially to produce the monthly ≈5km ... \nOxford/MAP/LST_Day_5km_Monthly, climate,lst,map,oxford,surface-temperature \n2001-03-01T00:00:00Z/2015-06-01T00:00:00Z \n-90 -180 90 180 \nGoogle Earth Engine \nhttps://developers.google.com/earth-engine/datasets\n\n- [](https://doi.org/https://www.bdi.ox.ac.uk/research/malaria-atlas-project)\n- [](https://doi.org/https://developers.google.com/earth-engine/datasets/catalog/Oxford_MAP_LST_Day_5km_Monthly)"]]